US Dollar weakens as risk flows start to drive markets

US Dollar weakens as risk flows start to drive markets

The US Dollar (USD) has lost its footing after having registered strong gains against its major rivals for two straight trading days. The upbeat macroeconomic data releases from China seem to have eased fears over a global economic slowdown. Hence, the USD is having a difficult time attractions investors as a safe haven.

The US Dollar Index, which tracks the USD performance against a basket of six major currencies, turned south and declined toward 101.50 despite having closed above 102.00 on Monday.

Technical analysis: US Dollar unable to gather further strength vs Euro

Following the two-day slide that saw the pair come within a touching distance of 1.0900, EUR/USD has regained its traction early Tuesday. The Relative Strength Index (RSI) indicator on the daily chart has returned to the 60 area, reflecting the lack of seller interest. Furthermore, the pair continues to trade within the ascending regression channel coming from late September.

EUR/USD faces immediate resistance at 1.1000 (psychological level, static level). Once the pair reaffirms that level as support, it could target 1.1100 (psychological level, static level), 1.1160 (static level from April 2022) and 1.1200 (psychological level).

On the downside, 1.0900 (20-day Simple Moving Average (SMA) stays intact as support ahead of 1.0800 (psychological level), 1.0760 (50-day SMA) and 1.0720 (100-day SMA).

US Dollar struggles to extend rebound amid improving risk mood

US Dollar struggles to extend rebound amid improving risk mood

The US Dollar (USD) has lost its footing after having registered strong gains against its major rivals for two straight trading days. The upbeat macroeconomic data releases from China seem to have eased fears over a global economic slowdown. Hence, the USD is having a difficult time attractions investors as a safe haven.

The US Dollar Index, which tracks the USD performance against a basket of six major currencies, turned south and declined toward 101.50 despite having closed above 102.00 on Monday.

Daily digest market movers: US Dollar reverses direction following Monday’s climb

  • US stock index futures trade in positive territory early Tuesday, pointing to a higher opening in Wall Street following Monday’s choppy action.
  • The data from China showed that the world’s second-largest economy expanded by an annualized rate of 4.5% in the first quarter, much stronger than the 2.9% growth recorded in the last quarter of 2022. This reading also came in better than analysts’ estimate for an expansion of 4%. Other data revealed that Industrial Production expanded by 3.9% and Retail Sales rose by 10.6% on a yearly basis, compared to analysts’ estimate of 7.4%.
  • 10-year US Treasury bond yield holds steady above 3.5% after having gained nearly 6% in the last three trading day.
  • Richmond Fed President Thomas Barkin said on Monday that he wants to see more evidence of inflation settling back to target.
  • The US Census Bureau will release Housing Starts and Building Permits data for March on Tuesday.
  • The data published by the US Census Bureau revealed on Friday that Retail Sales declined by 1% on a monthly basis in March. On a positive note, March’s reading of -0.4% got revised higher to -0.2%.
  • The University of Michigan’s (UoM) Consumer Confidence Index improved modestly to 63.5 in April’s flash estimate from 62 in March.
  • The one-year consumer inflation expectation component of the UoM’s survey climbed to 4.6% from 3.6% in March, providing a boost to the USD.
  • “Monetary policy will need to remain tight for a substantial period and longer than markets anticipate,” Federal Reserve Governor Christopher Waller said on Friday. Waller further argued that the recent data show that the Fed hasn’t made much progress on its inflation goal.
  • In an interview with Reuters on Friday, Atlanta Fed President Raphael Bostic noted that recent developments in the US economy were consistent with one more rate hike.
  • According to the CME Group’s FedWatch Tool, markets are currently pricing in a more-than-80% probability of a 25 basis points (bps) Fed rate hike in May.
  • NY Fed Empire State Manufacturing Index improved sharply to 10.8 in April from -24.6 in March, compared to the market expectation of -18.
  • On Wednesday, the Fed will release the Beige Book. Existing Home Sales and Initial Jobless Claims data will be featured in the US economic docket on Thursday ahead of S&P Global’s Manufacturing and Services PMI surveys on Friday.
  • Previewing the Fed’s publication, “since the March 21-22 meeting, the data suggest that activity is slowing, the labor market is softening, and price pressures are easing,” said analysts at BBH. “Notably, supply chains continue to improve. We believe the Beige Book will highlight these trends that support a pause after what is widely expected to be another 25 bps hike whilst leaving the door open for further tightening if needed.”

Technical analysis: US Dollar struggles to continue to outperform Euro

Following the two-day slide that saw the pair come within a touching distance of 1.0900, EUR/USD has regained its traction early Tuesday. The Relative Strength Index (RSI) indicator on the daily chart has returned to the 60 area, reflecting the lack of seller interest. Furthermore, the pair continues to trade within the ascending regression channel coming from late September.

EUR/USD faces immediate resistance at 1.1000 (psychological level, static level). Once the pair reaffirms that level as support, it could target 1.1100 (psychological level, static level), 1.1160 (static level from April 2022) and 1.1200 (psychological level).

On the downside, 1.0900 (20-day Simple Moving Average (SMA) stays intact as support ahead of 1.0800 (psychological level), 1.0760 (50-day SMA) and 1.0720 (100-day SMA).

How does Fed’s policy impact US Dollar?

The US Federal Reserve (Fed) has two mandates: maximum employment and price stability. The Fed uses interest rates as the primary tool to reach its goals but has to find the right balance. If the Fed is concerned about inflation, it tightens its policy by raising the interest rate to increase the cost of borrowing and encourage saving. In that scenario, the US Dollar (USD) is likely to gain value due to decreasing money supply. On the other hand, the Fed could decide to loosen its policy via rate cuts if it’s concerned about a rising unemployment rate due to a slowdown in economic activity. Lower interest rates are likely to lead to a growth in investment and allow companies to hire more people. In that case, the USD is expected to lose value.

The Fed also uses quantitative tightening (QT) or quantitative easing (QE) to adjust the size of its balance sheet and steer the economy in the desired direction. QE refers to the Fed buying assets, such as government bonds, in the open market to spur growth and QT is exactly the opposite. QE is widely seen as a USD-negative central bank policy action and vice versa.

German ZEW Economic Sentiment Index worsens to 4.1 in April vs. 15.1 expected

German ZEW Economic Sentiment Index worsens to 4.1 in April vs. 15.1 expected

The German ZEW headline number showed that the Economic Sentiment Index unexpectedly worsened in April, arriving at 4.1 from 13.0 in March, missing the market expectation of 15.1 by a wide margin.

Meanwhile, the Current Situation Index came in at -32.5 from -46.5, better than the market expectation of -40.0.

During the same period, the Eurozone ZEW Economic Sentiment Index worsened to 6.4 from 10.0, compared to the estimates of 19.8.

Key points

The financial market experts are still uncertain.

Experts expect banks to be more cautious in granting loans.

Still high inflation rates and the internationally restrictive monetary policy are also weighing on the economy.

On the positive side, the danger of an acute international financial market crisis seems to have been averted.

Earnings expectations for banks and insurance companies have improved compared to the previous month and are once again clearly in positive territory.

Market reaction

The EUR/USD pair has ignored the mixed data, holding the higher ground near 1.0980, up 0.47% on the day.

Gold Prices Slip as US Dollar Regains Vigor, Oil Repelled by Cluster Resistance

Gold Prices Slip as US Dollar Regains Vigor, Oil Repelled by Cluster Resistance

GOLD PRICE ANALYSIS

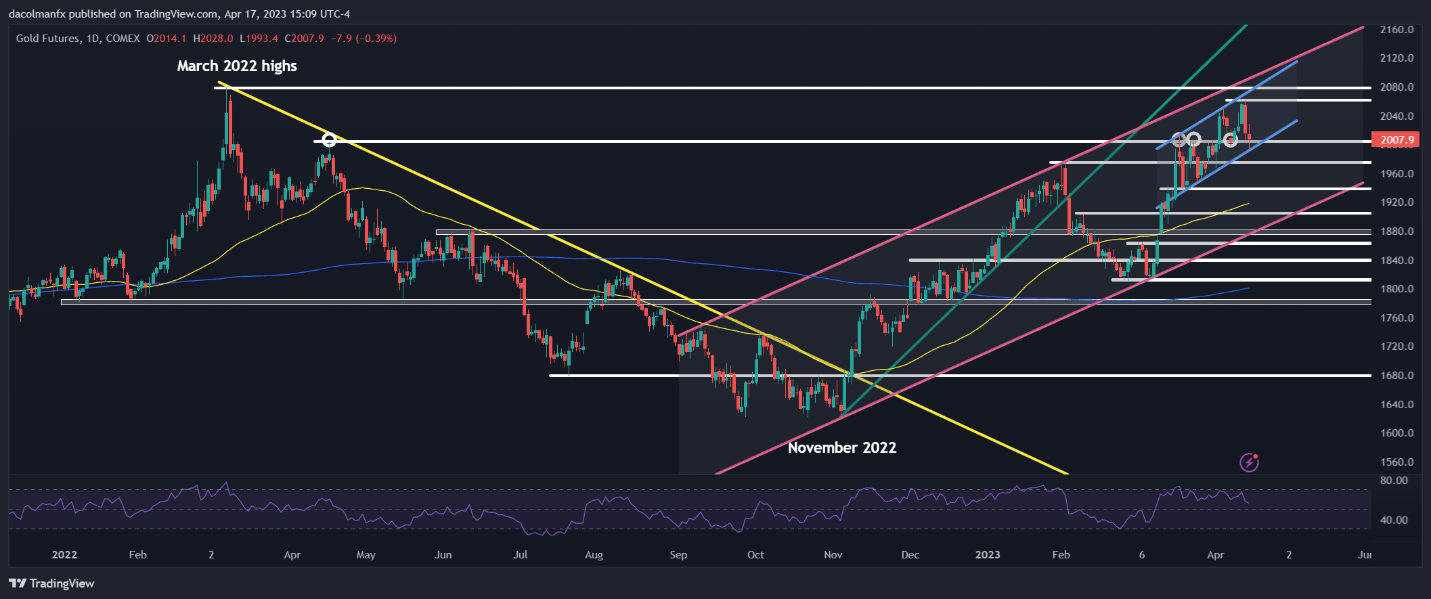
Gold prices (XAU/USD) retreated on Monday, losing ground for the second consecutive trading session and coming within a hair’s breadth of breaking below the psychological $2,000 level, undermined by the solid rally in the U.S. dollar seen in the FX space.

By way of context, the greenback managed to strengthen across the board, supported by rising U.S. Treasury yields, with the 10-year note breaking above its 200-day simple moving average and hitting 3.60%, its highest level in nearly three weeks.

Precious metals, which are priced in U.S. dollars and offer no yield, tend to weaken when the U.S. currency and rates rise, so underperformance is not surprising when these dynamics play out. In any case, gold’s bullish bias remains in place despite Monday’s small pullback.

From a price action perspective, XAU/USD has been trading within the confines of an ascending channel since the middle of last month, with bullion testing the lower limit of that pattern near $2,000 on Monday, a region that represents technical support.

If bulls manage to defend the $2000 floor and spark a rebound off of that zone, initial resistance lies at $2,060. On further strength, attention shifts to $2,075, followed by $2,095. Conversely, if selling pressure intensifies and support is breached, $1,975 is the first downside focus, followed by $1,940.

GOLD TECHNICAL CHART

Graphical user interface, chart, line chart, histogram Description automatically generated

OIL PRICE ANALYSIS

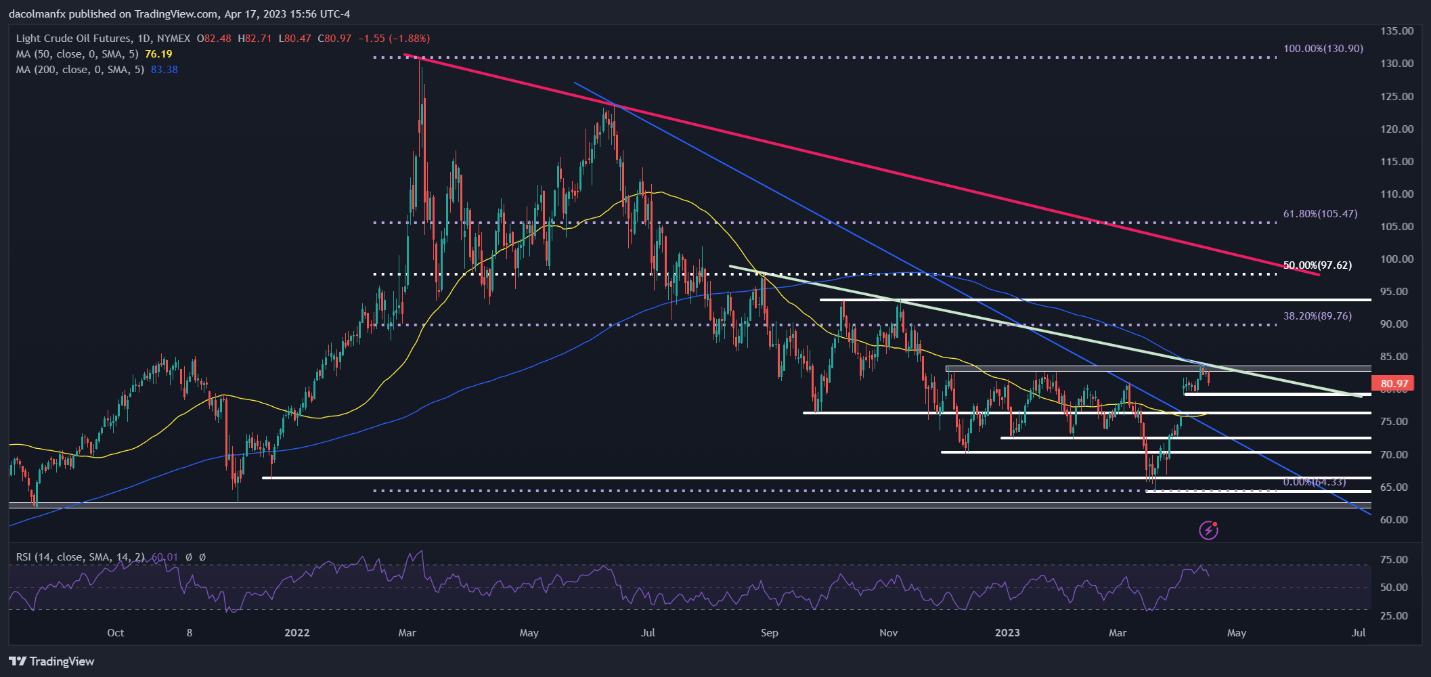
Oil prices sank on Monday, falling as much as 2% to $80.50 at some point during the trading session, hit by U.S. dollar strength and recession anxiety. While the U.S. economy has remained resilient over the past year, activity could decelerate sharply later in the year, especially if interest rates continue to rise. This scenario will dampen demand for energy commodities, weighing on fossil fuels.

In terms of technical analysis, oil has begun to reverse course after rallying more than 30% from its March lows, a sign that bullish momentum is fading. The daily chart below shows that the recent pullback has taken place after prices failed to clear cluster resistance in the $82.60/$83.40 area, where December 2022 and January 2023 highs align with the 200-day simple moving average.

If losses accelerate in the coming days, initial support rests at $79.00, followed by $76.50, just a touch above the 50-day simple moving average. On the flip side, if bulls regain the upper hand and manage to push prices above $82.60/$83.40, buying interest could regain impetus, setting the stage for a rally toward $89.76, the 38.5 Fib retracement of the March 2022/March 2023 correction.

OIL PRICE TECHNICAL CHART

Chart, histogram Description automatically generated


US Dollar Outperforms Again, but Key Resistance Holds. USD/JPY Looks More Interesting

US Dollar Outperforms Again, but Key Resistance Holds. USD/JPY Looks More Interesting

The DXY Dollar Index rose 0.51% on Monday after a solid 0.57% rally on Friday. This made the 1.08% rise over the past 2 trading days the most over 48 hours since early March. As highlighted in my weekly outlook, the USD’s performance from a technical standpoint does not seem like it was out of the blue.

Last week, the dollar fell to the critical 100.82 – 101.29 support zone that was reinforced back in February. At the same time, positive RSI divergence was showing that downside momentum was fading. This can at times precede a turn higher. Over the past 2 days, the currency was unable to clear this zone and instead, reversed higher. Could this be the starting point of an extended bullish move?

At this stage, it seems too early to tell. A Bullish Engulfing emerged at the close of last week looking at the daily chart below. Since then, there has been cautious upside follow-through. But, the near-term falling trendline from March remains in play and is holding as resistance. Confirming a breakout above that could offer an increasingly upside technical bias.

That would place the focus on the 100-day Simple Moving Average (SMA). This line held as key resistance in early March, maintaining the broader downside bias. It could very well do so again if prices continue higher in the coming days.

DXY Daily Chart – Watch the Trendline

DXY Daily Chart – Watch the Trendline

USD/JPY Daily Chart – Watch the 100-Day SMA

Focusing on USD/JPY, the US Dollar has made upside progress beyond the 100-day SMA. That has exposed the March high, which is just below 138.17. Not only that but also prices have closed at the highest in over a month. Meanwhile, a rising trendline from the beginning of this year is slowly guiding the exchange rate higher. In the event of a turn lower, this line could maintain the near-term upside bias.

USD/JPY Daily Chart – Watch the 100-Day SMA

USD/JPY Sentiment Analysis (IGCS) – Bearish

We can look at IG Client Sentiment (IGCS) to see how retail traders have been positioning themselves in USD/JPY. At the time of publishing, about 38% of them were net-long the exchange rate. IGCS typically functions as a contrarian indicator. As such, since most people are net-short, this hints prices may continue rising. But, upside exposure increased by 7.79% and 11.02% compared to yesterday and last week, respectively. As such, recent changes in exposure warn that prices may turn lower instead.

USD/JPY Sentiment Analysis (IGCS) - Bearish

US Dollar Outperforms Again, but Key Resistance Holds. USD/JPY Looks More Interesting

US Dollar Outperforms Again, but Key Resistance Holds. USD/JPY Looks More Interesting

The DXY Dollar Index rose 0.51% on Monday after a solid 0.57% rally on Friday. This made the 1.08% rise over the past 2 trading days the most over 48 hours since early March. As highlighted in my weekly outlook, the USD’s performance from a technical standpoint does not seem like it was out of the blue.

Last week, the dollar fell to the critical 100.82 – 101.29 support zone that was reinforced back in February. At the same time, positive RSI divergence was showing that downside momentum was fading. This can at times precede a turn higher. Over the past 2 days, the currency was unable to clear this zone and instead, reversed higher. Could this be the starting point of an extended bullish move?

At this stage, it seems too early to tell. A Bullish Engulfing emerged at the close of last week looking at the daily chart below. Since then, there has been cautious upside follow-through. But, the near-term falling trendline from March remains in play and is holding as resistance. Confirming a breakout above that could offer an increasingly upside technical bias.

That would place the focus on the 100-day Simple Moving Average (SMA). This line held as key resistance in early March, maintaining the broader downside bias. It could very well do so again if prices continue higher in the coming days.

DXY Daily Chart – Watch the Trendline

DXY Daily Chart – Watch the Trendline

USD/JPY Daily Chart – Watch the 100-Day SMA

Focusing on USD/JPY, the US Dollar has made upside progress beyond the 100-day SMA. That has exposed the March high, which is just below 138.17. Not only that but also prices have closed at the highest in over a month. Meanwhile, a rising trendline from the beginning of this year is slowly guiding the exchange rate higher. In the event of a turn lower, this line could maintain the near-term upside bias.

USD/JPY Daily Chart – Watch the 100-Day SMA

USD/JPY Sentiment Analysis (IGCS) – Bearish

We can look at IG Client Sentiment (IGCS) to see how retail traders have been positioning themselves in USD/JPY. At the time of publishing, about 38% of them were net-long the exchange rate. IGCS typically functions as a contrarian indicator. As such, since most people are net-short, this hints prices may continue rising. But, upside exposure increased by 7.79% and 11.02% compared to yesterday and last week, respectively. As such, recent changes in exposure warn that prices may turn lower instead.

USD/JPY Sentiment Analysis (IGCS) - Bearish


GBP/USD regains 1.2400 after mixed UK jobs data

GBP/USD regains 1.2400 after mixed UK jobs data

GBP/USD is extending its recovery above 1.2400 in the early European morning. Pound Sterling bulls cheer elevated UK’s pay growth level, fanning BoE rate hike bets. The US Dollar remains on the back foot amid a cautious market mood.

Contrary to that, UK Finance Minister was very confident about UK’s economic progress. UK Hunt cited that the British economy will outperform this year. Also, the economy will avoid recession.

S&P500 futures have remained choppy in the Asian session as investors s worried about quarterly results from banking and technology stocks, portraying a cautionary market mood. The US Dollar Index (DXY) has surrendered the crucial support of 102.00 as investors are digesting fears of one more rate hike from the Federal Reserve (Fed), which is expected to get announced in May.

Fed chair Jerome Powell eyes one more rate hike as United States core inflation rebounded in March, indicating extreme stubbornness due to the robust labor cost index. Meanwhile, retail demand for costly products has dropped as households are avoiding the higher cost of financing.

China GDP Beats Expectations; Hang Seng and Shanghai Composite Index To Extend Gains?

China GDP Beats Expectations; Hang Seng and Shanghai Composite Index To Extend Gains?

China/Hong Kong equities could be gearing up for another leg higher as the recovery in the world’s second-largest economy picks up steam.

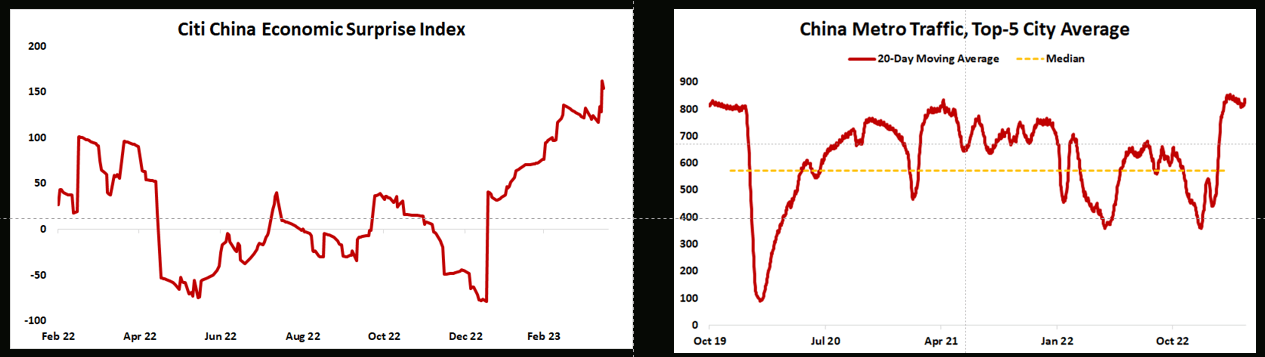
Data released on Tuesday Asia morning showed the Chinese economy grew 4.5% on-year in the January-March quarter, well above 4% expected, and 2.9% in the previous quarter. Industrial production rose 3.9% in March Vs 4% forecast, up from 2.4% in February, retail sales 10.6% last month Vs 7.4% expected, and above 3.5% in February, while fixed asset investment grew 5.1% on-year in the January-March period Vs 5.7% expected.

China Economic Surprise Index

Graphical user interface, chart, line chart  Description automatically generated

Source data: Bloomberg; Chart prepared in Excel

This follows a string of upbeat China data in recent weeks – Economic Surprise Index for China this month hit the highest level at least since 2014 – reflecting the positive spillovers from the economic reopening. Furthermore, hopes of a turnaround in the property cycle (new homes prices rose in March at the fastest pace in 21 months) and hopes that regulatory crackdown on corporates could be ending suggest the growth spurt could turn out to be more than temporary.

Shanghai Composite Index Daily Chart

image2.png

Chart Created by Manish Jaradi Using TradingView

Consensus expects about 5.3% on-year growth for China for the year 2023, up sharply from around 4.3% in January. The upgrading in the growth outlook bodes well for China/Hong Kong equities – despite the rebound since late 2022, from a valuation perspective, Chinese equities are trading below the past 20 years’ average.

Hang Seng Index Daily Chart

image3.png

Chart Created by Manish Jaradi Using TradingView

Shanghai Com: Rises above a key barrier

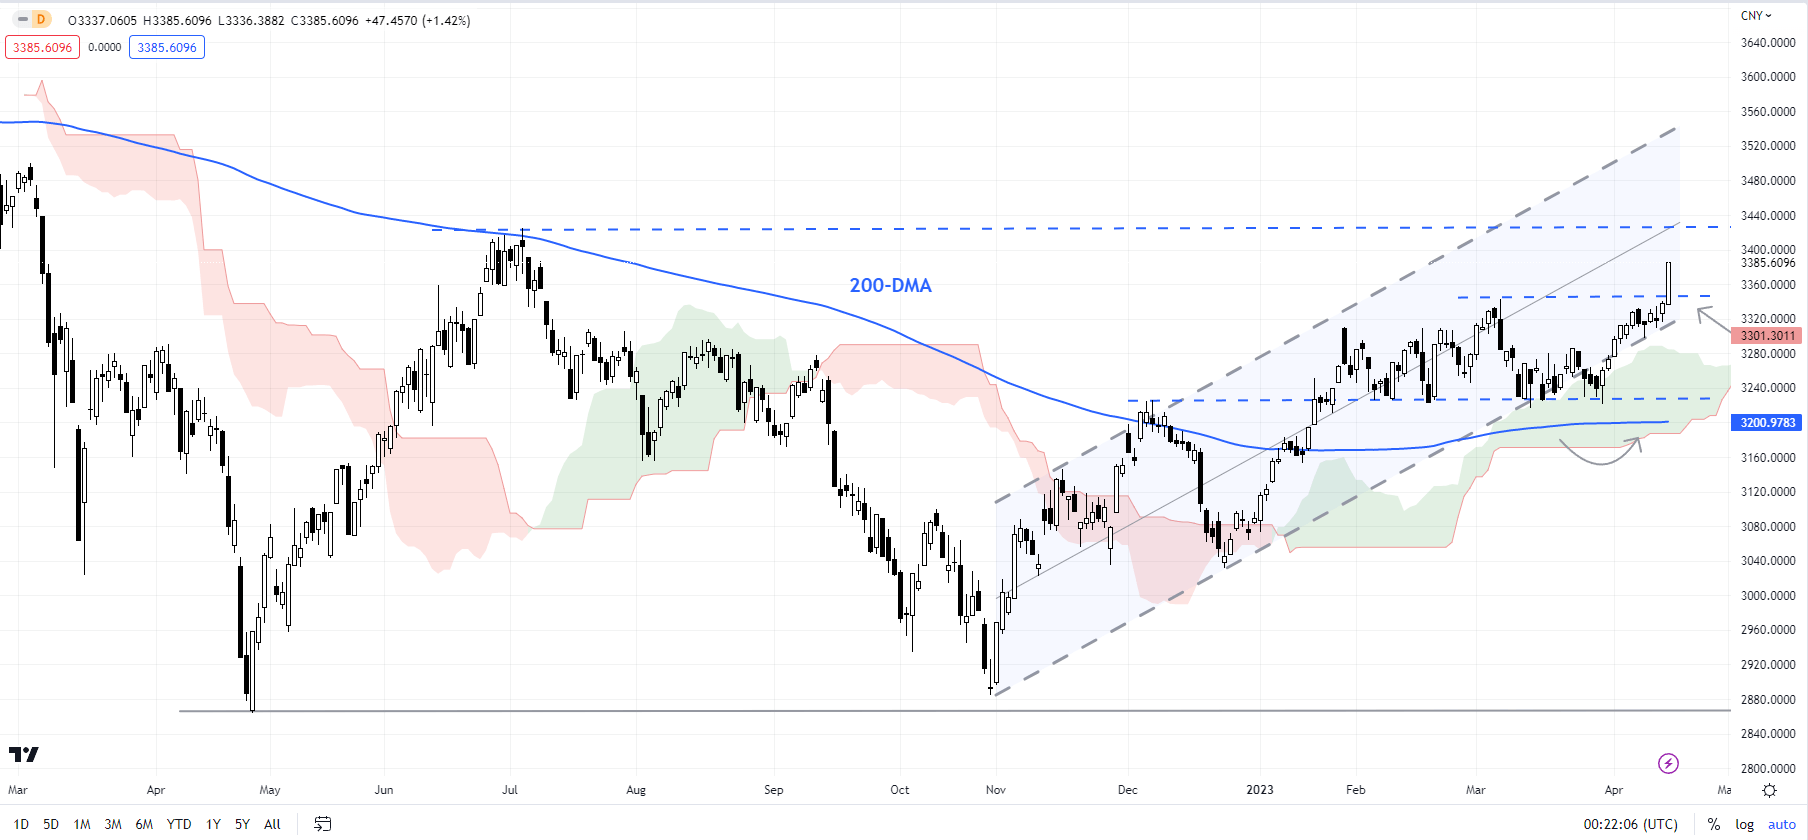
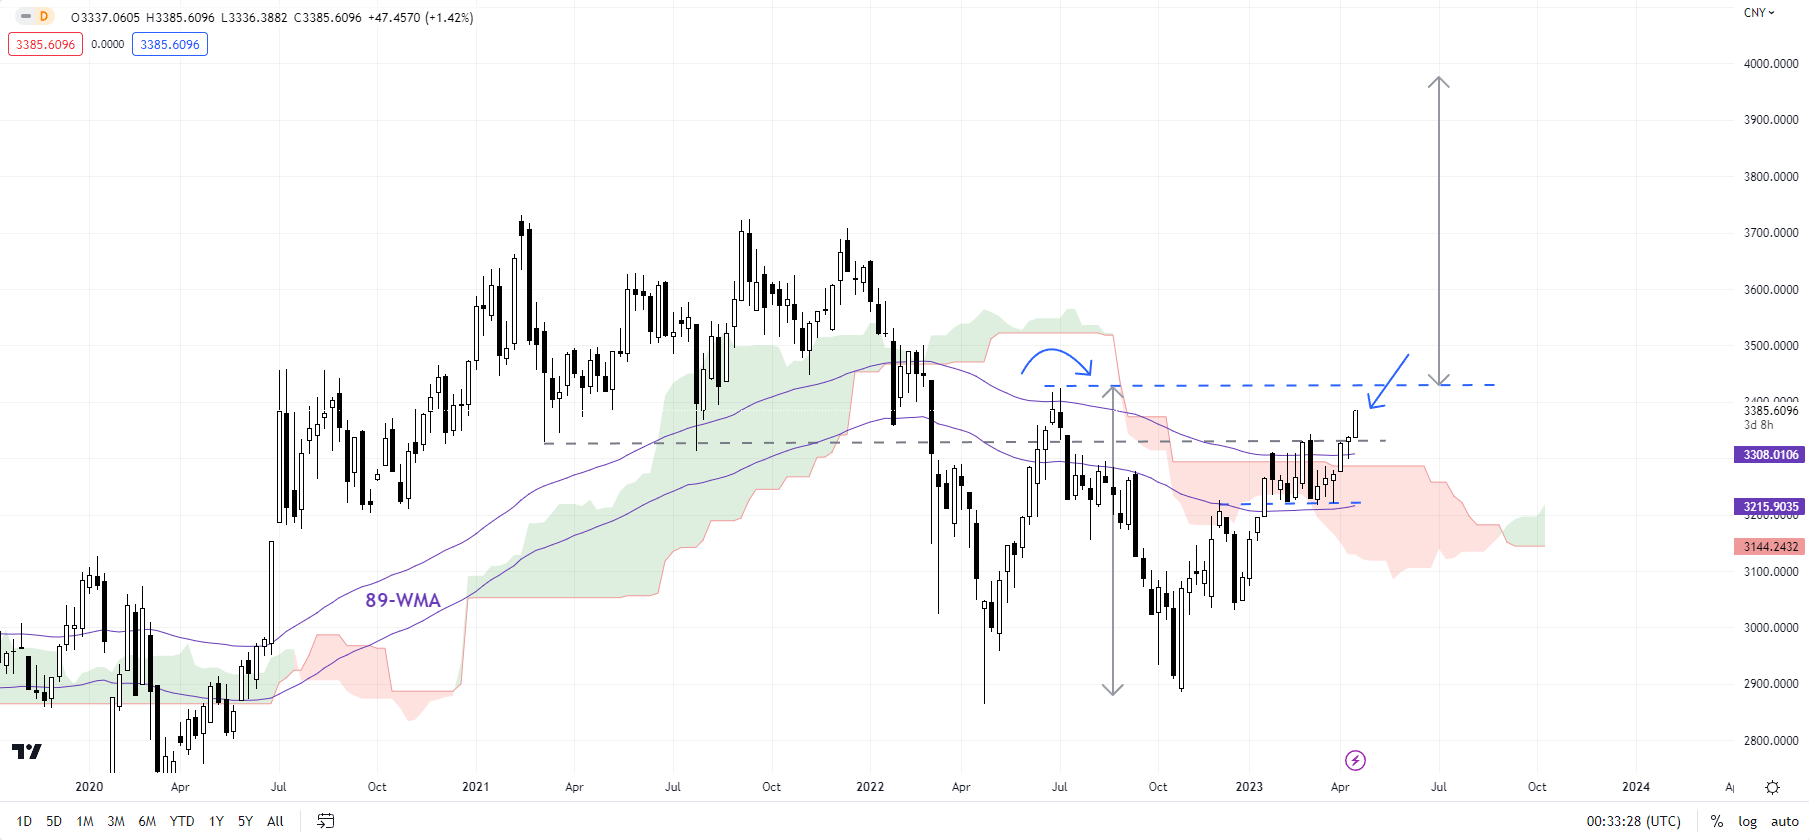
The Shanghai Composite Index’s break above a key hurdle at the early-March high of 3343, roughly coinciding with the 89-week moving average (the rebound in 2022 ran out of steam at the Fibonacci moving average). The index looks set to retest the mid-2022 high of 3425. Any break above 3425 would trigger a major double bottom (the 2022 lows), potentially opening the way for around 15% — above the 2021 high of 3730.

Shanghai Composite Index Weekly Chart

image4.png

Chart Created by Manish Jaradi Using TradingView

Hang Seng: Beginning to flex muscles

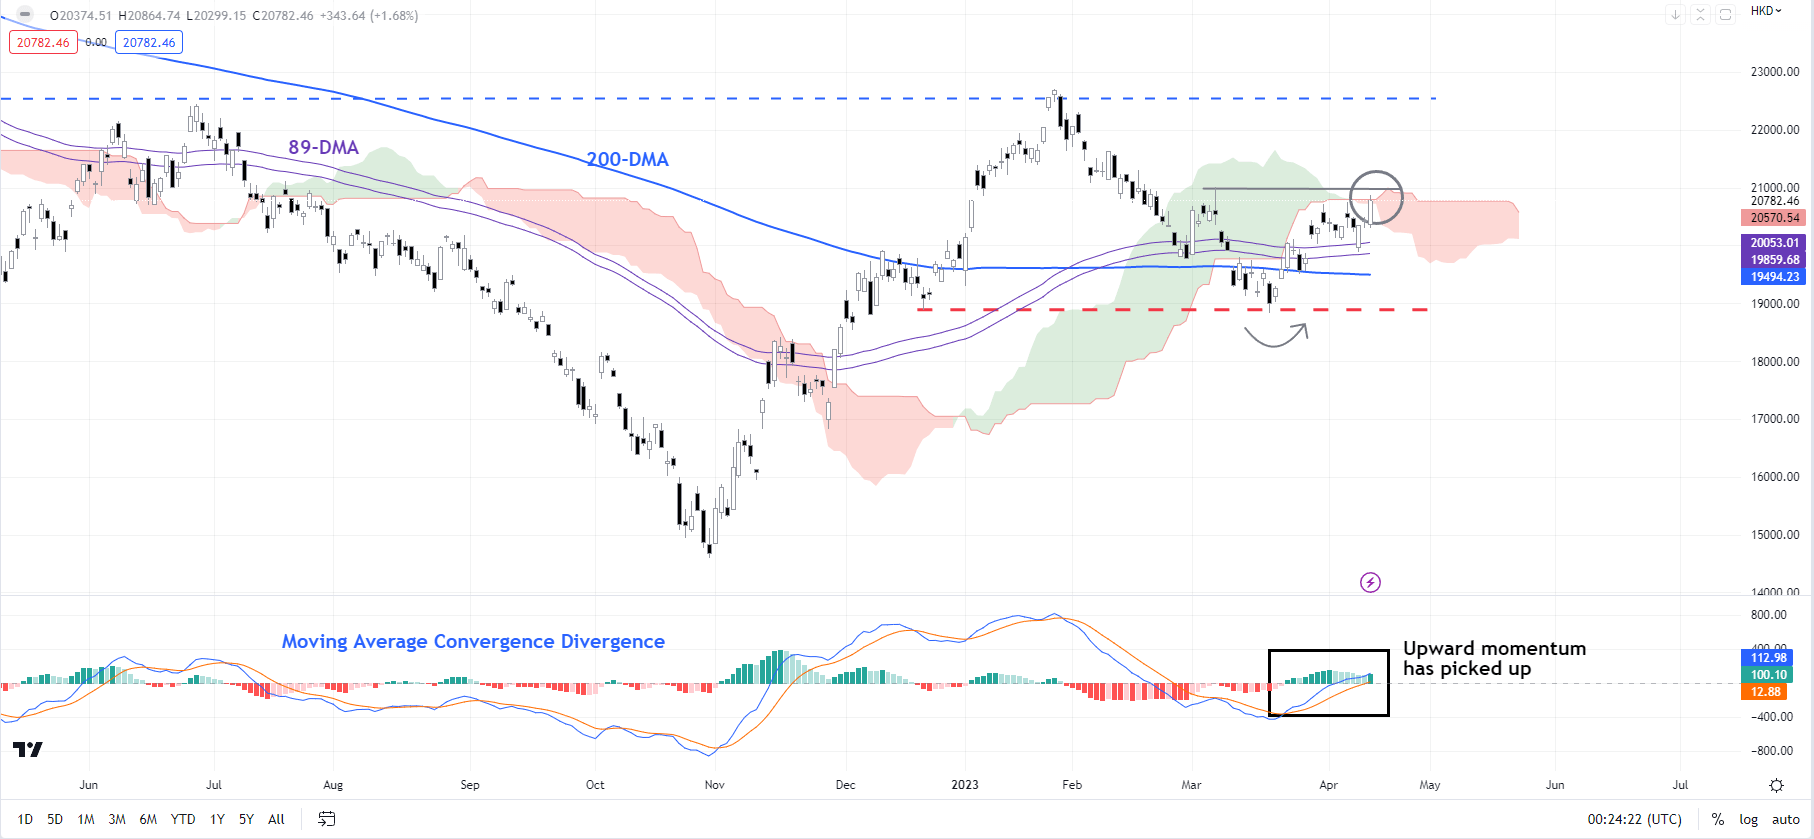
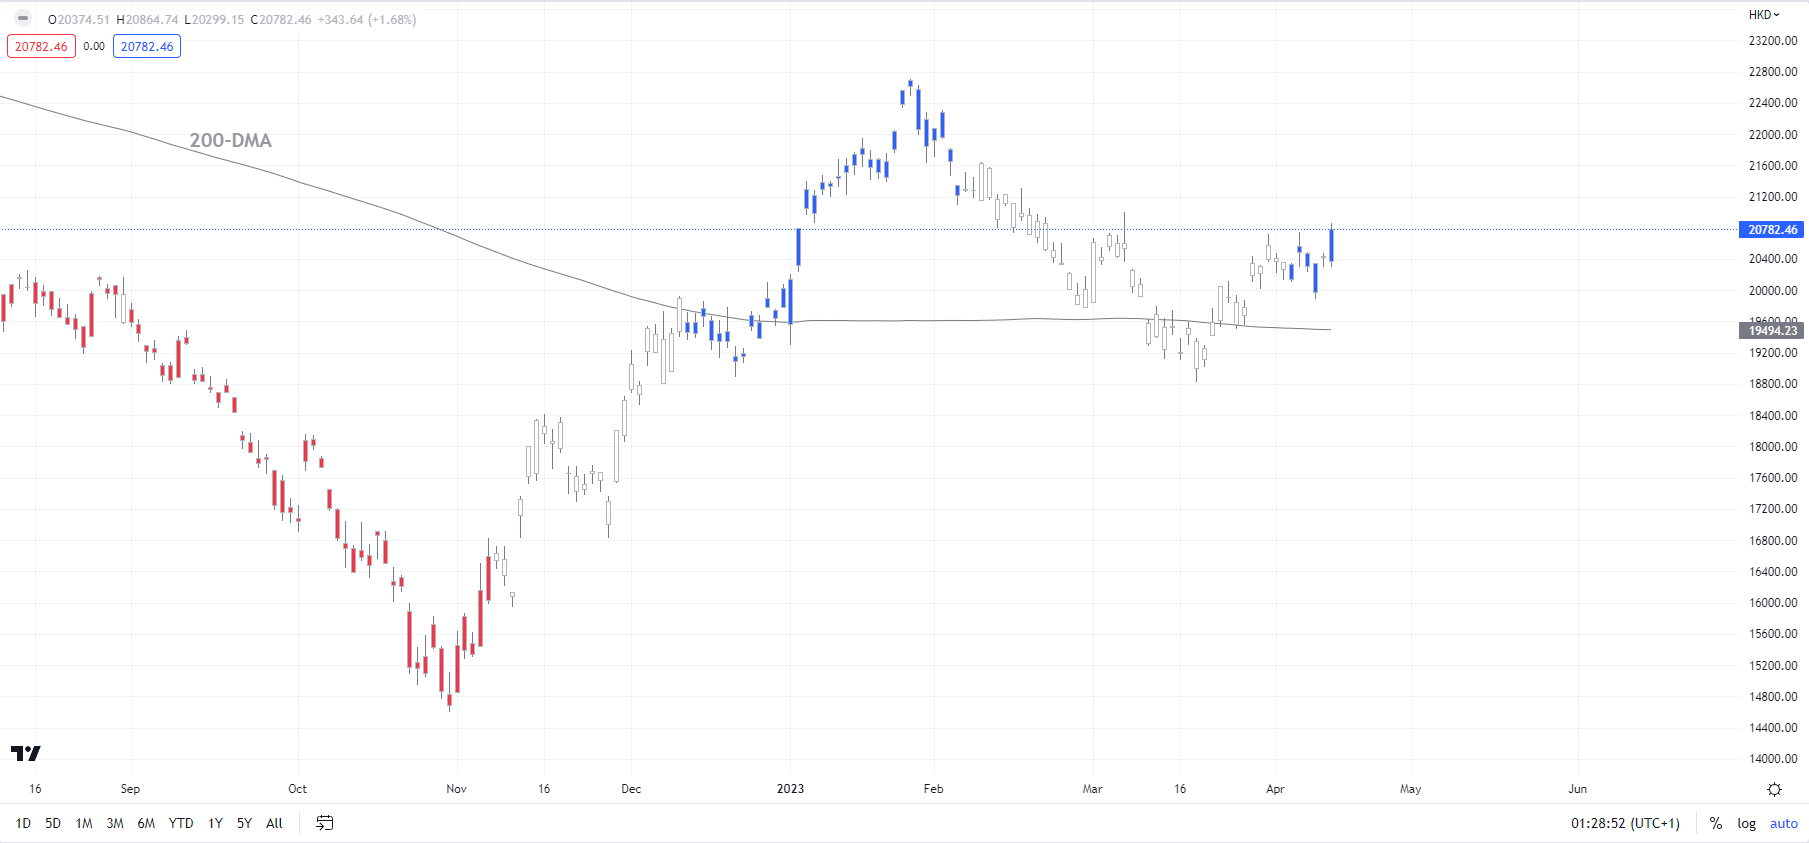
The Hang Seng Index’s hold above vital support at the December low of 18885 confirms that the higher-top-higher-bottom sequence (that is, an uptrend) from the end of 2022 remains in place. The colour-coded charts suggest the bullish phase in the index has resumed (see chart).

The Hang Seng Index is now testing crucial resistance on a horizontal trendline from early March at about 21000, roughly coinciding with the upper edge of the Ichimoku channel on the daily chart. A decisive break above the resistance could open the door toward the January high of 22700.

Hang Seng Index Daily Chart

image5.png

Chart Created by Manish Jaradi Using TradingView

Note: In the above colour-coded chart, Blue candles represent a Bullish phase. Red candles represent a Bearish phase. Grey candles serve as Consolidation phases (within a Bullish or a Bearish phase), but sometimes they tend to form at the end of a trend. Note: Candle colors are not predictive – they merely state what the current trend is. Indeed, the candle color can change in the next bar. False patterns can occur around the 200-period moving average, or around a support/resistance and/or in sideways/choppy market. The author does not guarantee the accuracy of the information. Past performance is not indicative of future performance. Users of the information do so at their own risk.

Australian Dollar Up After RBA Minutes & China GDP Data; Will AUD/USD Sustain Gains?

Australian Dollar Up After RBA Minutes & China GDP Data; Will AUD/USD Sustain Gains?

The hawkish tone of the Reserve Bank of Australia’s (RBA) minutes of the April meeting and upbeat China data could provide support to the Australian dollar against the US dollar.

Minutes of the RBA April 4 meeting showed board members considered the case for another 25 basis point increase as inflation “remained too high and the labour market was very tight”. The board also considered the faster-than-expected pickup in population growth and wage growth before opting to pause the rate hikes.

China GDP and Consensus Global Growth Expectations

image1.png

Source data: Bloomberg; Chart prepared in Excel

Still, “it was important to be clear that monetary policy may need to be tightened at subsequent meetings”, suggesting that the Australian central bank may not be done just yet with tightening. Key focus is now on the Australia January-March CPI due April 26 – persistent inflationary pressures could boost the odds of a rate hike at the RBA’s May 2 meeting. The market is pricing in the RBA Cash Rate at 3.73% by August (Vs 3.6% now), up from 3.67% on Monday.

FX Speculative Positioning

Chart, line chart  Description automatically generated

Furthermore, data released on Tuesday Asia morning showed the Chinese economy grew 4.5% on-year in the January-March quarter, well above 4% expected, and 2.9% in the previous quarter. Industrial production rose 3.9% in March Vs 4% forecast, up from 2.4% in February, retail sales 10.6% last month Vs 7.4% expected, and above 3.5% in February, while fixed asset investment grew 5.1% in March Vs 5.7% expected, and 5.5% in February.

AUD/USD 240-minute Chart

image3.png

Broadly, China macro data have beaten expectations in recent weeks — the Economic Surprise Index for China this month hit the highest level at least since 2014 – reflecting the positive spillovers from the economic reopening. Given that China is Australia’s biggest export market, any improvement in China’s growth outlook could boost Australia’s growth prospects. Speculative positioning in AUD is short, and any repricing higher of RBA rates could be enough to trigger the unwinding of some of those short positions.

AUD/USD Daily Chart

image4.png

On technical charts, AUD/USD has this month held above quite a strong support at the late-March low of 0.6625. However, the pair has been capped under a stiff hurdle around the 200-day moving average, roughly coinciding with the early-April high of 0.6795. AUD/USD needs to cross above the ceiling of around 0.6800 for the outlook to improve.

Can Unlucky Traders Still be Profitable? Finding Optimal Risk Management

Can Unlucky Traders Still be Profitable? Finding Optimal Risk Management

Not Quite Being Lucky

Often, there is an element of luck when it comes to trading. Even if your analysis is spot on, the timing is very difficult. A famous example from the real world can be found in Michael Burry, the storied US investor who correctly predicted the 2008 housing bubble from Michael Lewis’ bestseller “The Big Short”. He had to face down a revolt among his investors that nearly chased him out of the very trades that would land him in the history books. Burry’s financial backers balked at a steady stream of expensive payments made to keep his trades in play as the markets dithered.

There is a way for traders to compensate for luck – risk management. Overlooking this essential component of the strategy is how an incredibly lucky trader – someone who can frequently call trades correctly – may still lose money in the aggregate. Conversely, using risk management effectively is how a poor win rate can still translate into profitability.

How is it that a lucky trader can lose money overall? Consider a person who profited on 8 trades out of 10, making 10 dollars per trade. On the two remaining trades, however, 50 dollars were lost each time. On net, this will leave the trader 20 dollars poorer. In this special report, we will show how an unlucky trader can still be profitable, and what you can do to optimize risk management.

The First Random Walk – Understanding the Sequence

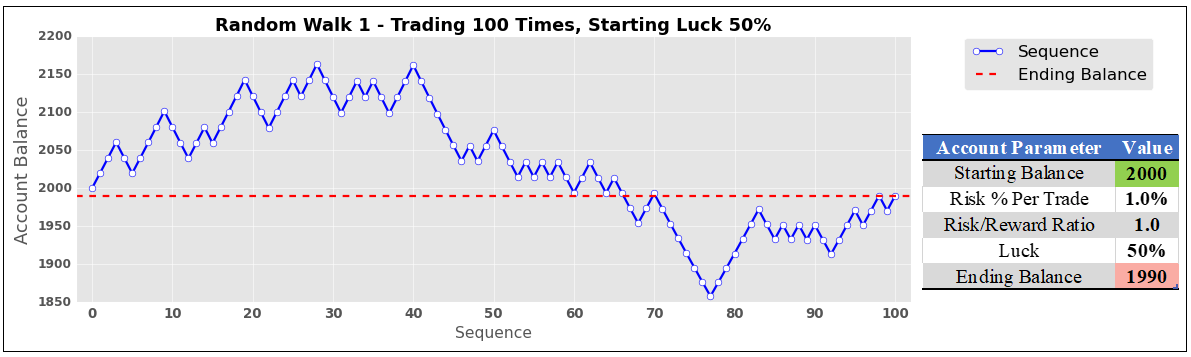
A random walk simulation was used to mimic someone trading 100 times in a row. Each random walk has a few parameters: starting account balance, the maximum risk a person is willing to take per trade as a percentage of the account balance (which stays the same as the trader makes or losses money), the risk-reward ratio (how much the trader wants to make relative to how much is put at risk), and finally the trader’s luck (the chance that a given trade in the sequence is profitable).

The first random walk is shown on the chart below. It simulates a trader that starts with a $2k account, risks 1% per trade, has a risk/reward (RR) ratio of 1:1 (meaning that the first trade risks losing $20 to make a profit of $20), and has 50% luck. Being lucky about half of the time had a predictable outcome. The ending balance ($1990) was nearly identical to where it started ($2000) after one hundred trades.
The First Random Walk – Understanding the Sequence

Study Limitations

It should be noted that this is a study computed with code and has no margin of error or human emotion factored into it. This means that no matter what, it assumes the trader being modeled always sticks to the game plan perfectly. It also assumes that trades can be seamlessly closed – with a profit or loss – at the designated settings with absolute precision. In the real world, stops may not always be executed at the specified price, resulting in some slippage. These simulations also assume 100 trades were taken, which will not match everyone’s level of activity. With that in mind, this is more of a demonstration of the importance of risk management rather than a one-size-fits-all trading system.

The Second Random Walk – Reducing Luck

What happens when we take the same sequence but make our hypothetical trader unlucky, leaving everything else unchanged? With 25% luck, disaster strikes. Someone with a risk/reward ratio of just 1:1 would see their account balance cut almost in half after 100 trades ($1137). As we will find at the end of this journey, however, an increase in the risk/reward ratio can compensate for worse luck.
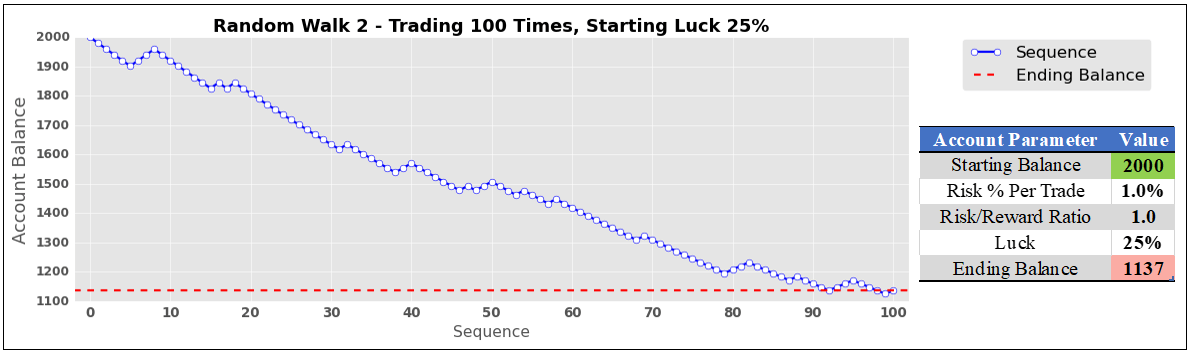
image2.png

Simulating Hundreds of Thousands of Trades to Find Optimal Risk/Reward Ratios

To find ideal risk/reward ratios for given levels of luck, these random walks were run many times to find statistically meaningful interpretations. In this study, one cycle constituted 100 trades conducted 100 times. That is a total of 10,000 trades per cycle! With each cycle, the risk/reward ratio automatically rose by 0.05, starting at 1. The program is coded to keep doing this until 100% of the trades are finished at or above the starting account balance.

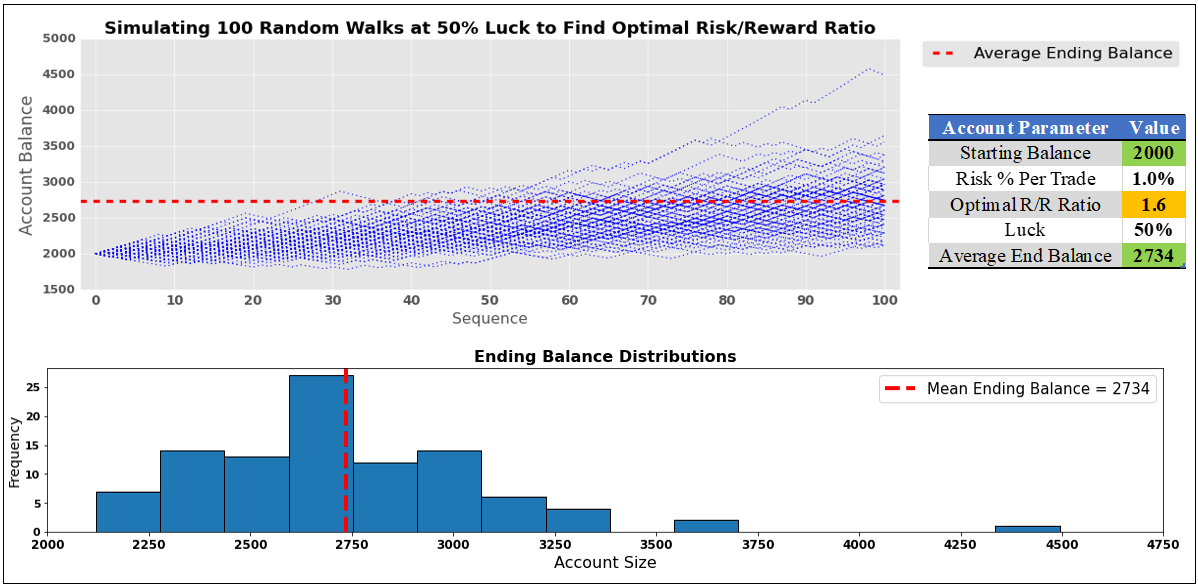
So, what does this look like for someone lucky about half of the time? Well, in the image below, we can see that the optimal risk-reward ratio is on average 1.6 (meaning that with a starting balance of $2k the strategy aims to make $32 in profit while risking $20 on the first trade). The latter two will adjust alongside the evolving account balance to maintain a 1.6 RR ratio, making sure the risk remains at 1% per trade.

The code ended up increasing the risk/reward ratio 6 times. Including the starting point, the cycle ran 7 times. In other words, 70k trades were conducted to find the optimal RR ratio. To further optimize this study, another 10 rounds of random sequences were used. This means that roughly 770,000 trades were placed to find the optimal risk/reward ratio for 50% luck! It is not exactly 770,000 because sometimes the RR ratio was above/under 1.6.

When someone is lucky half of the time, and they use a 1.6 risk-reward ratio, we can expect an average ending balance of $2734 (36.7% return, which remains constant no matter what the starting account balance size is) after 100 trades. In the lower half of the image, there is a normal distribution of outcomes. There were a couple of outliers, with an account topping $4.5k. A few others were above $3.5k.
Simulating Hundreds of Thousands of Trades to Find Optimal Risk/Reward Ratios

The Optimal Risk/Reward Ratio Curve

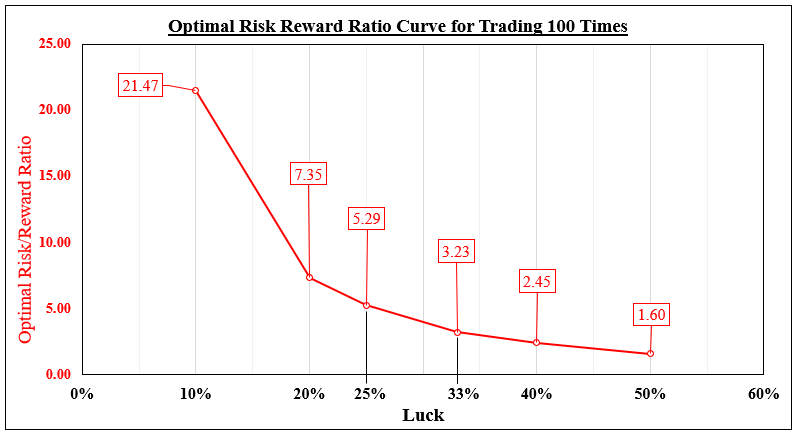
What about other levels of luck? In this study, I used the following: 50%, 40%, 33%, 25%, 20% and 10%. Optimal RR ratios are displayed in the chart below for a given luck level. As expected, lower levels of luck required higher risk/reward ratios to compensate. When you are lucky 40% of the time, an ideal RR ratio for a sequence of 100 trades seems to be 2.45.

At 2.45, a total of 30 cycles were simulated for a given random sequence. Just like before, an additional 10 were performed to help optimize this study. Combining all these sequences, roughly 3,300,000 trades were placed to find the optimal risk/reward ratio for 40% luck.

Someone lucky just 10% of the time can still make a profit. However, this would demand the daunting task of maintaining a 21.47 risk/reward ratio.
The Optimal Risk/Reward Ratio Curve

Is Trading Success Based on Luck?

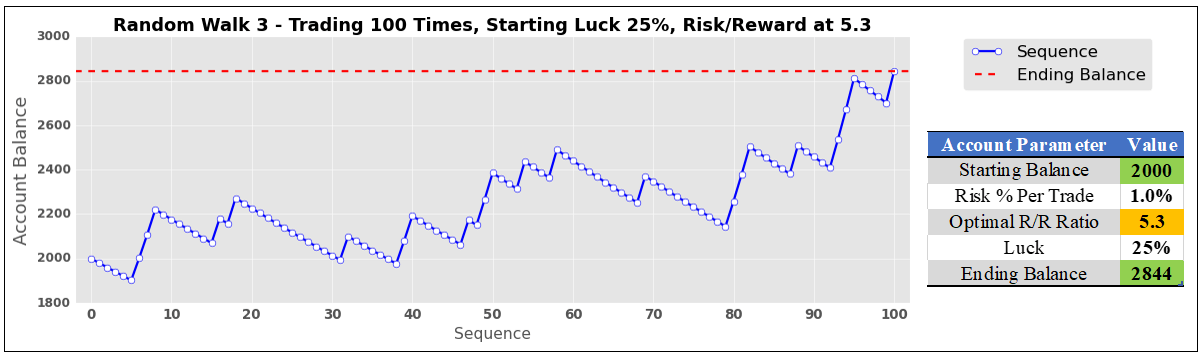
Now, let us revisit the earlier scenario of a trader that is lucky just 25% of the time. Using a 1:1 risk-reward ratio, they lost almost half of their account. Using the optimal risk/reward ratio of 5.3 suggested in our analysis, their ending balance becomes $2844, a 42.2% return. Do traders have to be lucky to be profitable? Absolutely not. Success comes down to risk management.

Is Trading Success Based on Luck?