Oil Price Update: Israeli Troops Withdraw from the South, Peace Talks Underway

Oil Price Update: Israeli Troops Withdraw from the South, Peace Talks Underway

Israeli Troops Pulled out of Southern of Gaza as Peace Talks Got Under Way

Israeli soldiers have been called back from Southern Israel after sparking outrage over the recent aggression that killed seven aid workers. The US sent a particularly strong message that civilians need to be protected and that Israel needs to allow more aid into the besieged territory.

Hammas insist on a full withdrawal of IDF soldiers, something Israel in not prepared to facilitate, and it is not yet known whether the partial withdrawal of soldiers is some sort of compromise ahead of peace talks or a way to appease global outrage.

Either way, the slight de-escalation has been seen as a step in the right direction to allow much needed aid to find its way to civilians in need.

However, the potential for a broader conflict has risen since the April 1st attack on an Iranian embassy in Syria which killed senior Iranian commanders. Risk sentiment remains on edge after Iran warned of an ‘inevitable’ retaliation.

Brent crude oil gaps lower as tensions appear to ease at the start of the week

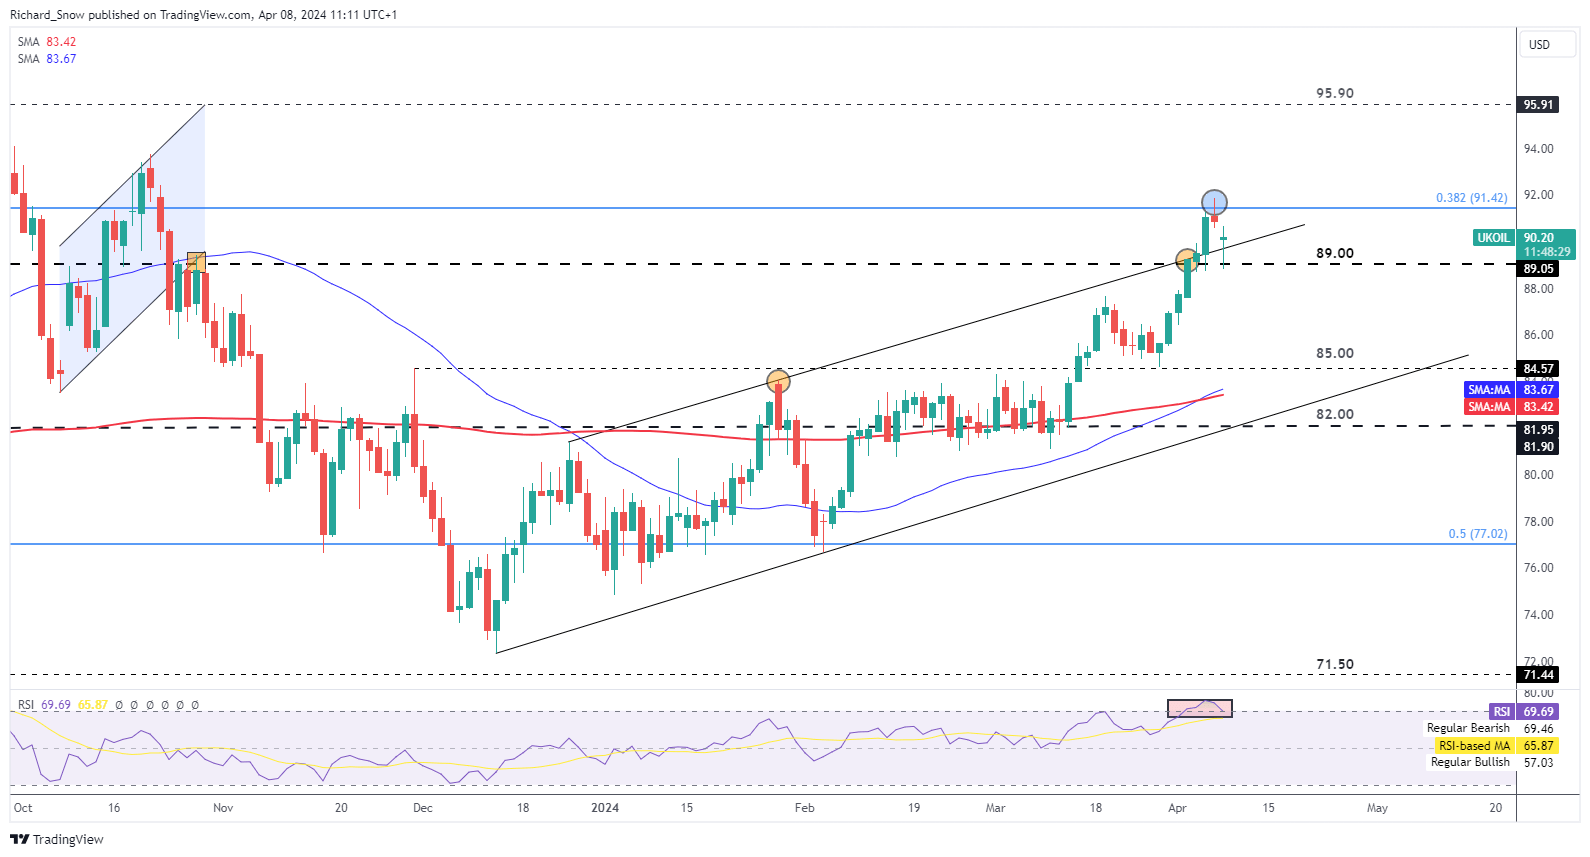
Brent crude oil broke above the longer-term ascending channel, heading well above the $90 marker, finding resistance near $91.42. Prices gapped lower at the start of trading week as tensions eased but stull remain elevated. A hold above the upward sloping trendline (former resistance) appears as the most immediate test for oil bulls. Prices dropped below $89 intra-day but have recovered from the daily low. A bullish bias remains constructive as long as prices remain above $85. However, on a more short-term basis, overbought territory on the RSI poses a challenge for bulls in the shorter-term. Lastly, more evidence of a pullback from here emerges via the bounce at the 38.2% retracement of the 2020-2022 major rise.

Brent Crude Daily Chart

image1.png

WTI Eyes Overbought Conditions as the Commodity Eases on Monday

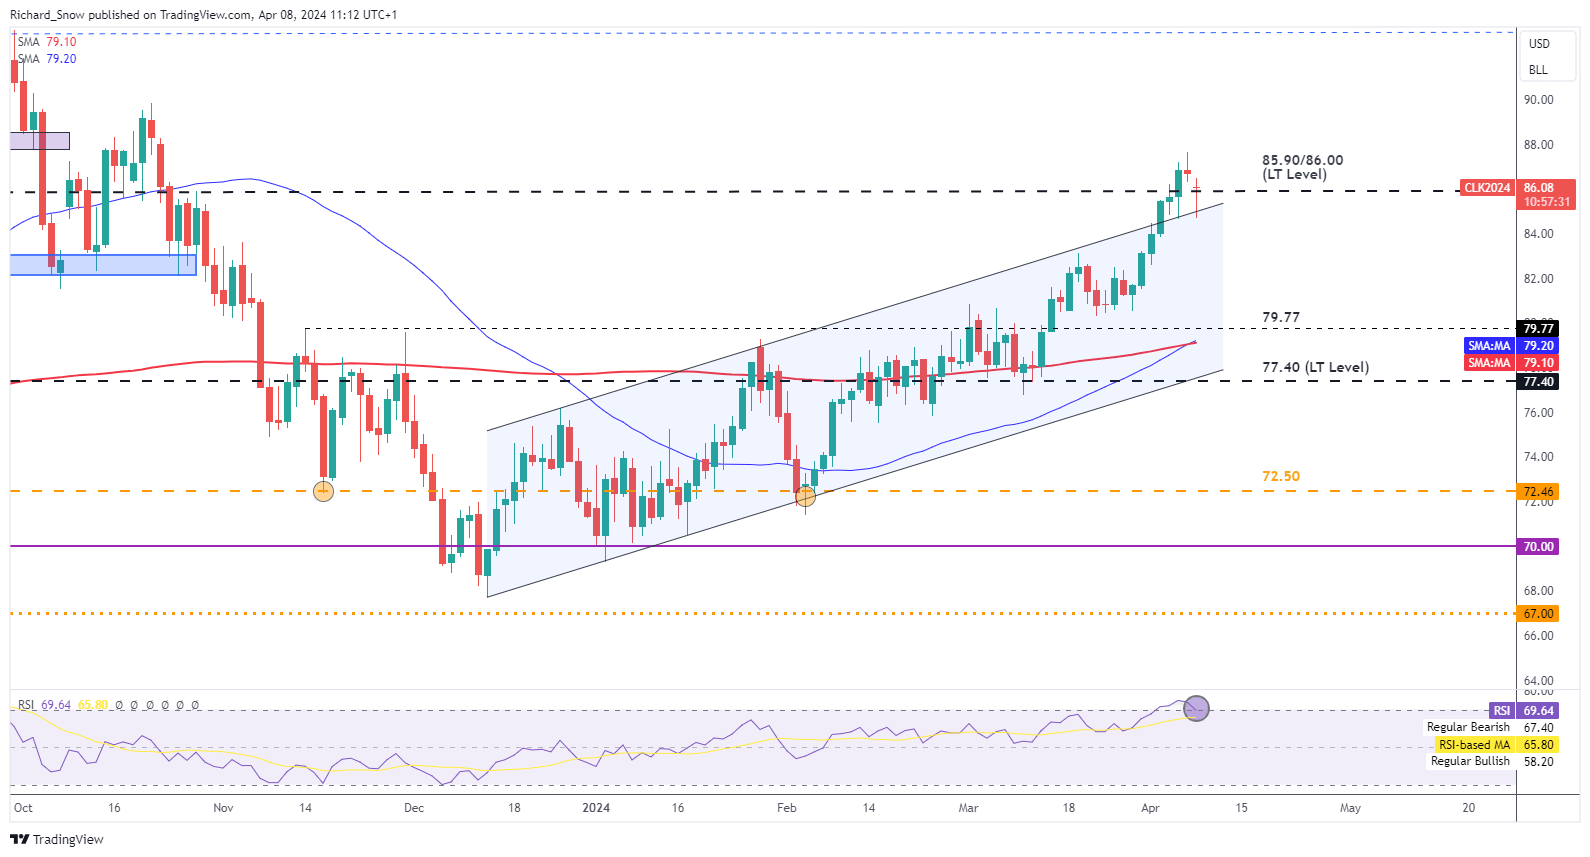
WTI trades in a similar fashion to Brent crude oil, heading lower at the start of the week after breaching into overbought territory. The move lower is already showing signs of restraint as the daily candle reveals a long lower wick but it will be important to wait for the candle close before confirming such a suspicion.

Further bearish signals would include the RSI recovering from overbought territory and a close back within the ascending channel. A bullish crossover will help bulls maintain a bullish bias but keep in mind the moving averages are inherently lagged in nature.

WTI Daily Chart

Source: TradingView, prepared by Richard Snow

image2.png

Oil – US Crude Bearish


Bitcoin (BTC) Nears New All-Time High as Halving Event Looms, Coinbase (COIN) Benefits

Bitcoin (BTC) Nears New All-Time High as Halving Event Looms, Coinbase (COIN) Benefits

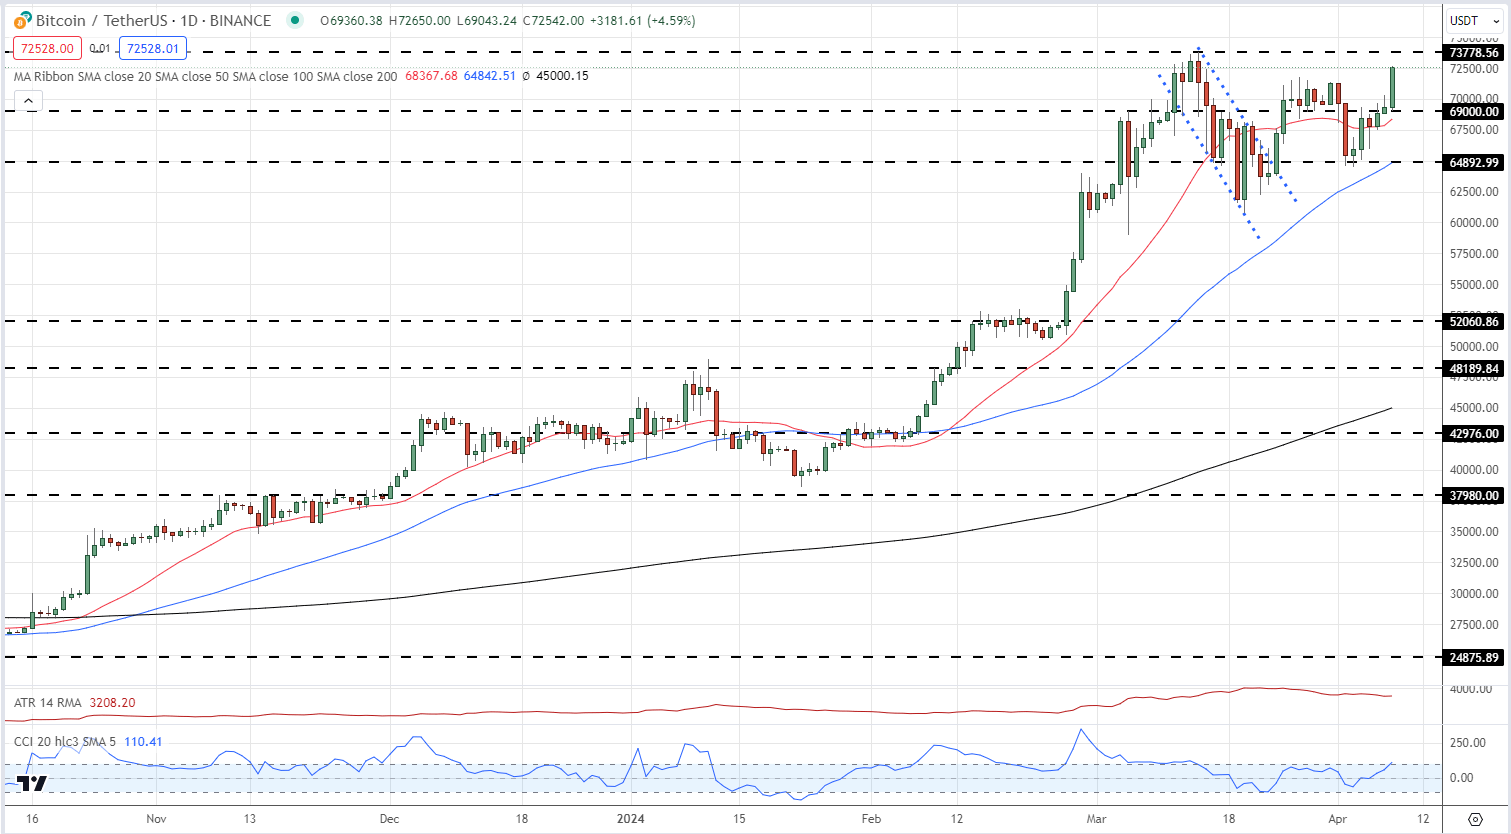
Bitcoin is back above $70k and is within touching distance of posting a new all-time high as buyers become increasingly active ahead of the upcoming halving event. The recent, short-term, sell-off has now been fully retraced with today’s move taking Bitcoin back above a cluster of recent highs between $71.2k and $71.8k. There is little in the way of technical resistance before BTC/USD enters unchartered territory.

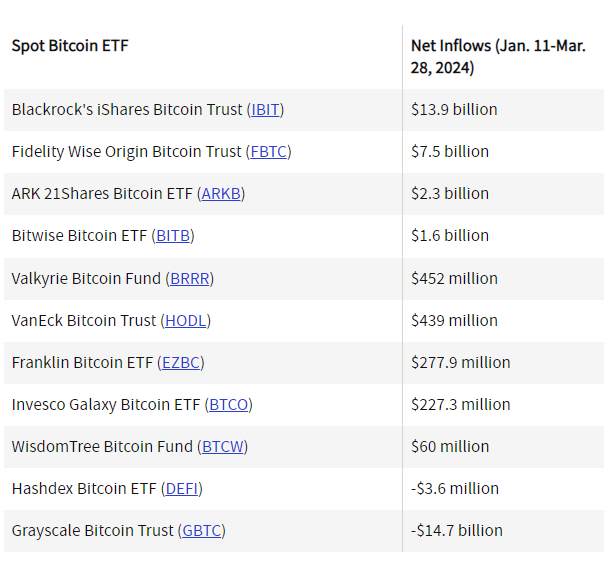
The driver of Bitcoin’s robust rally over the last few months has been heavy institutional buying after eleven spot Bitcoin ETFs were approved in early January. In the first quarter of 2024, these eleven ETFs bought a net $12.1 billion worth of Bitcoin – $26.8 billion inflows vs. $14.7 billion outflows.

image1.png

Investopedia/BitMEX Research

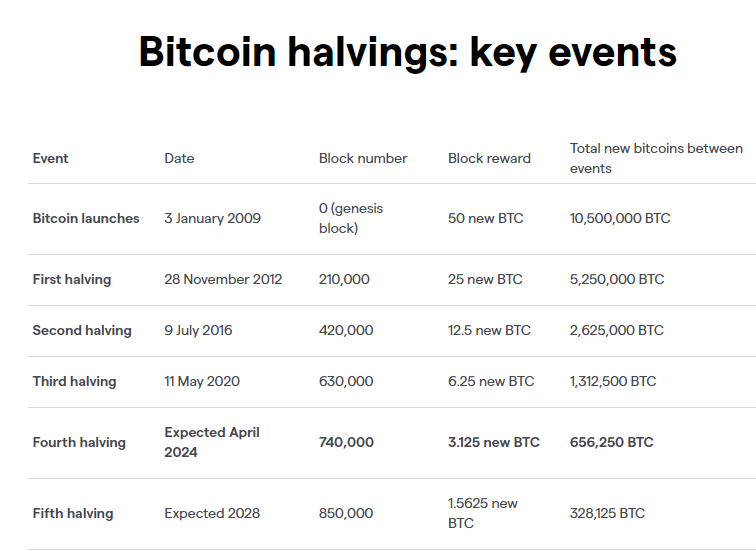
This heavy demand will soon run into a supply shock as the number of new Bitcoins mined will be reduced by 50% at the new halving event. These halving events occur every four years when the reward for mining a new block gets reduced from 6.25 BTC to 3.125 BTC per block. Bitcoin halving will continue every 210,000 blocks until all 21 million coins have been mined, predicted in 2040.

image2.png

Bitcoin (BTC) Daily Price Chart

image3.png

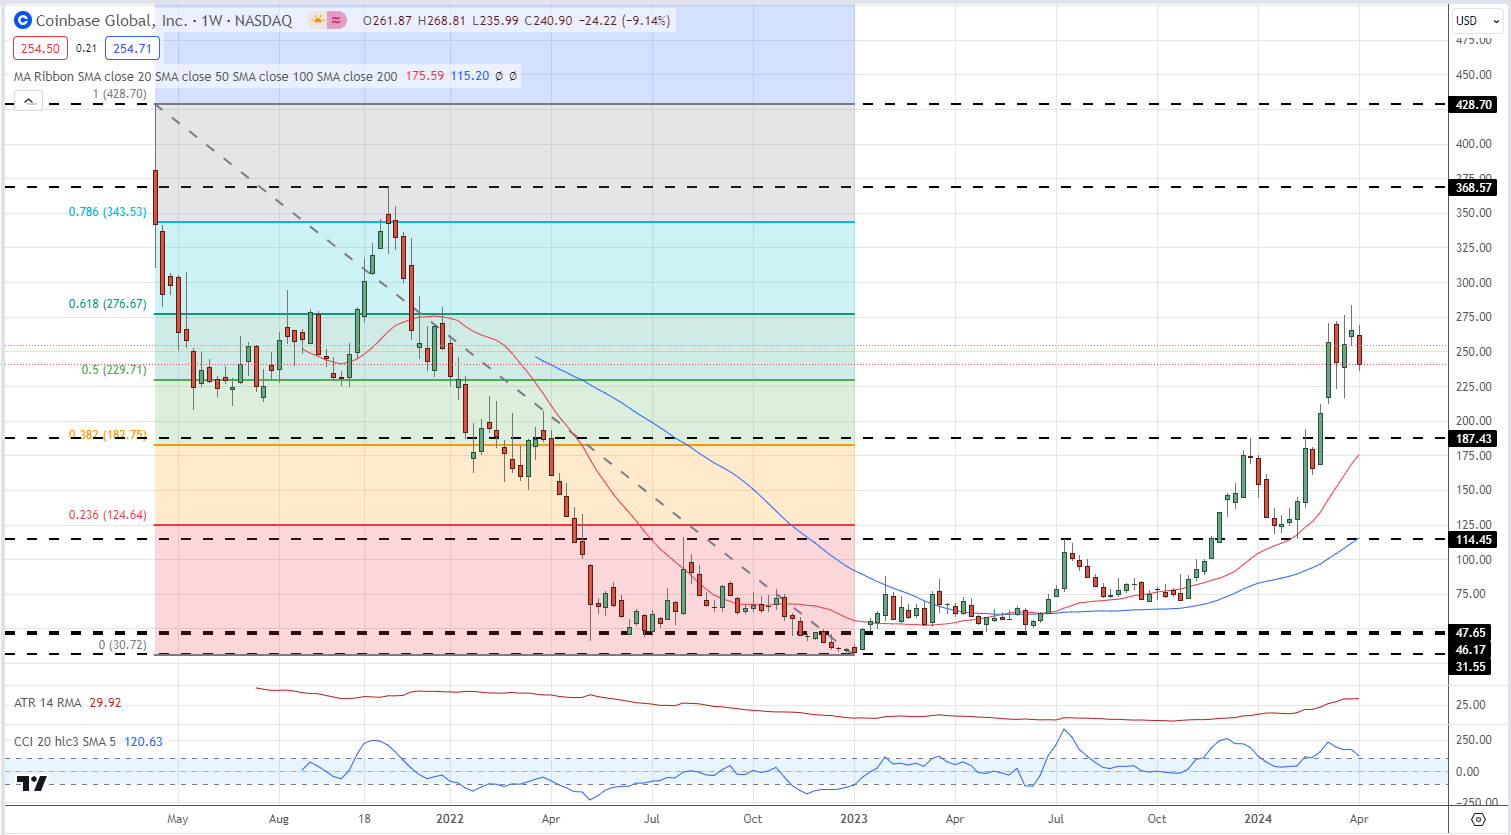
Coinbase (COIN), the largest cryptocurrency exchange in the US, is one company that benefits from renewed activity in the cryptocurrency space. Despite being involved in an ongoing lawsuit with the US Securities and Exchange Commission (SEC), Coinbase has seen its share price more than double since early February. The weekly chart shows Coinbase tested and rejected the 61.8% Fibonacci retracement level at $277 in late March and this level could soon come under pressure again unless the SEC case stymies further progress. Above here the 78.6% retracement level at $344 comes into view.

Coinbase (COIN) Weekly Price Chart

image4.png

German Manufacturing PMI Falls from 42.5 to 41.9 in March

German Manufacturing PMI Falls from 42.5 to 41.9 in March

German Manufacturing PMI

In March, the German Manufacturing PMI declined from 42.5 to a five-month low of 41.9, slightly higher than the preliminary figure of 41.6.

According to the finalized survey,

  • Supplier delivery times improved markedly, impacting on the headline figure.
  • Purchasing activity slowed further, though the rate of decline was less than in February.
  • The rate of job shedding was the most marked in three-and-a-half years, highlighting excess capacity issues plaguing the manufacturing sector.
  • New orders continued to decrease, albeit at a less marked pace, with export orders falling at the slowest rate in 11 months.
  • The weak demand environment pressured input prices, rising at the slowest pace since March 2023.
  • Average factory gate prices declined at the fastest pace in five months. Firms attributed the decline in factory gate charges to competition for new business.
  • Manufacturers were more optimistic about the 12-month outlook in hopes of improved demand in the second half of the year.

Shortly after the German Manufacturing PMI, the Eurozone Manufacturing PMI numbers garnered investor attention. The Eurozone Manufacturing PMI declined from 46.5 to 46.1 in March, up from a preliminary 45.7.

ECB Monetary Policy Impact Analysis

The Manufacturing PMI numbers followed the unexpected February slide in German retail sales. Significantly, recent economic indicators from Germany align with recent revisions to growth forecasts for the German economy.

These figures also bolster speculation of a June ECB interest rate cut. Persistently weak demand may further suppress inflationary pressures, potentially prompting a more dovish stance from the ECB.

However, the manufacturing sector accounts for less than 30% of the German economy. The ECB focus will likely remain on the services sector, the main contributor to euro area inflation. Finalized German Services Sector PMI numbers will be out on Thursday. According to preliminary numbers, the Services PMI increased from 48.3 to 49.8 in March.

EUR/USD Reaction to German Retail Sales

Before the finalized German Manufacturing PMI survey, the EUR/USD rose to a high of $1.07440 before falling to a low of $1.07246.

In response to the German Manufacturing PMI, the EUR/USD rose to a high of $1.07427 before falling to a low of $1.07300.

On Tuesday, the EUR/USD was down 0.07% to $1.07353.

EUR/USD reaction to German and Eurozone Manufacturing PMIs.
020424 EURUSD 3 Minute Chart

Up Next

Later today, preliminary German inflation figures for March will warrant investor attention. Softer-than-expected inflation numbers could fuel bets on a May ECB interest rate cut. Economists forecast the annual inflation rate to ease from 2.5% to 2.2%.

However, the US economic calendar also needs consideration amidst shifting expectations of an H1 2024 Fed rate cut. The US JOLTs Job Openings Report and US factory orders will be in focus.

Economists forecast JOLTs Job Openings to fall from 8.863 million to 8.740 million in February. A less marked-than-expected decline could impact bets on a June Fed rate cut. Economists expect factory orders to increase by 1.0% in February after sliding by 3.6% in January. Better-than-expected numbers could support expectations the US economy will avoid a recession.

Beyond the numbers, investors must also monitor central bank chatter. FOMC members John Williams, Michelle Bowman, Mary Daly, and Loretta Mester are on the calendar to speak.

EUR/USD, GBP/USD, DXY Price Forecast: PMI Surprises, Dollar Eyes 105.25

EUR/USD, GBP/USD, DXY Price Forecast: PMI Surprises, Dollar Eyes 105.25

Market Overview

The EUR/USD recently saw Spanish Unemployment Change outperforming expectations at -33.4K against the forecasted 10.0K. Additionally, the Spanish Manufacturing PMI stood at 51.4, slightly above the anticipated 51.1.

Events Ahead

In the upcoming sessions, attention turns to the U.S. with JOLTS Job Openings expected at 8.76 million and Factory Orders predicted to show a 1.1% increase, following a -3.6% decline. Speeches from FOMC members, including Bowman and Mester, will be closely watched for insights into future monetary policy, which could impact both EUR/USD and GBP/USD.

For GBP/USD, recent data will come into play with the UK’s Final Manufacturing PMI projected at 49.9. Economic indicators like M4 Money Supply, Mortgage Approvals, and Net Lending to Individuals will also provide critical insights into the UK’s financial health.

US Dollar Index (DXY)

Dollar Index

Dollar IndexThe Dollar Index is exhibiting a modest uptrend, currently at 105.059, with a 0.09% increase today. It is trading above its pivot point of 104.949, hinting at a bullish sentiment. The immediate resistance levels are at 105.248, 105.489, and 105.773, which could cap upward movements.

Support is found at 104.726, 104.483, and 104.216, marking potential fallback positions. The 50-day and 200-day EMAs, at 104.320 and 103.850 respectively, bolster the bullish outlook, but a fall below the pivot could switch the trend to bearish.

EUR/USD Technical Forecast

EUR/USD Price Chart - Source: Tradingview

EUR/USD Price Chart – Source: Tradingview

GBP/USD Technical Forecast

GBP/USD Price Chart - Source: Tradingview

GBP/USD Price Chart – Source: TradingviewThe GBP/USD pair is trading at 1.25436, experiencing a slight decline of 0.06%. The pivot point at 1.25836 acts as the critical juncture for future price movements, with immediate resistance levels observed at 1.26401, 1.26917, and 1.27549.

Support is found at 1.25190, 1.24830, and 1.24514, providing potential floors for price pullbacks. The 50-day and 200-day EMAs, at 1.26338 and 1.26738 respectively, indicate a bearish trend below the pivot.

A movement above this pivot may tilt the balance towards a bullish trend for GBP/USD, suggesting a cautious market sentiment.

Bitcoin (BTC) News Today: Investor Alert – BTC Falls on ETF Market Flows

Bitcoin (BTC) News Today: Investor Alert – BTC Falls on ETF Market Flows

Bitcoin-Spot ETF Market Flow Data Triggers BTC Pullback

On Monday (April 1), BTC declined by 2.30%. Reversing a 2.38% gain from Sunday, BTC ended the day at $69,739.

BTC reacted to US manufacturing sector data for March, which tested investor bets on a June Fed rate cut. The ISM Manufacturing PMI rose from 47.8 to 50.3 in March, with the sub-components signaling a pickup in inflationary pressure.

10-year US Treasury yields jumped 2.54%, leaving riskier assets in negative territory. BTC fell to a Monday session low of $68,093 before retaking the $69,000 handle.

BTC-spot ETF market flow data also impacted buyer demand for BTC.

Grayscale Bitcoin Trust Net Outflows Rebound

Grayscale Bitcoin Trust (GBTC) net outflow data for Monday (April 1) dashed hopes of a rundown in outflows. According to preliminary numbers from Farside Investors, GBTC saw net outflows of $303 million, up from $104.9 million on Thursday (March 28). Figures for the broader US BTC-spot ETF market were also lackluster.

  • Fidelity Wise Origin Bitcoin Fund (FBTC) saw net inflows of $44 million (April 1), down from $68.1 million (March 28).
  • ARK 21-Shares Bitcoin ETF (ARKB) saw net outflows of $0.3 million, down from net inflows of $27.6 million. Significantly, ARKB saw net inflows of $200.7 million on March 27.
  • iShares Bitcoin Trust (IBIT) must see net inflows of at least $252 million for the BTC-spot ETF market to avoid total net outflows on April 1.

Bloomberg Intelligence ETF Analyst James Seyffart reacted to the GBTC numbers, saying,

“[…] Honestly, higher than I expected. Thought this was (would) have slowed by now.”

On February 14, 2024, the bankruptcy courts permitted Genesis Global Holdco LLC to sell $1.3 billion GBTC shares. Since the ruling, GBTC has seen total net outflows of $8,388.6 million. The numbers reveal that $7 billion of total net outflows were not attributable Genesis ruling to offload GBTC shares.

Technical Analysis

Bitcoin Analysis

BTC remained above the 50-day and 200-day EMAs, affirming the bullish price signals.

A break above the $69,000 resistance level would support a move toward the March 14 ATH of $73,808.

On Tuesday, BTC-spot ETF market flow data, US economic data, and Fed chatter need consideration.

However, a fall through the $66,000 handle would give the bears a run at the $64,000 support level.

With a 14-Daily RSI reading of 50.47, BTC could return to the ATH of $73,808 before entering overbought territory.

BTC Daily Chart sends bullish price signals.

BTCUSD 020424 Daily Chart

Ethereum Analysis

ETH hovered above the 50-day and 200-day EMAs, confirming the bullish price trends.

A break above the $3,480 resistance level would support a move to the $3,650 handle. An ETH breakout from the $3,650 handle could give the bulls a run at the $3,835 resistance level.

Investors should continue monitoring ETH-spot ETF-related chatter amid falling bets of an SEC approval.

Conversely, an ETH break below the 50-day EMA could signal a drop to the $3,244 support level.

The 14-period Daily RSI reading of 45.41 indicates an ETH fall to the $3,244 support level before entering oversold territory.

ETH Daily Chart sends bullish price signals.
ETHUSD 020424 Daily Chart
Natural Gas and Oil Forecast: Middle East Risks Elevate Bullish Oil Trends

Natural Gas and Oil Forecast: Middle East Risks Elevate Bullish Oil Trends

Market Overview

Oil prices experienced a surge, driven by promising demand indicators from China and the U.S., alongside escalating Middle East tensions impacting supply concerns. Improved manufacturing activity in China and the U.S. hints at a robust demand rebound for oil.

Meanwhile, the conflict in Gaza, with Iran’s involvement, raises apprehensions about potential disruptions in oil supply. Upcoming OPEC+ meetings will be crucial in determining future supply cuts and production policies.

The compounded effect of geopolitical risks and demand recovery is poised to push oil prices higher, potentially affecting the broader energy market, including natural gas, as market dynamics shift.

Natural Gas Price Forecast

Natural Gas
Natural GasNatural Gas (NG) trades at $1.8950, marking a 0.68% decline, with a bearish outlook below the $1.9128 pivot point. Key resistance levels are at $1.9396, $1.9720, and $2.0068, while immediate support is found at $1.8797, followed by $1.8587 and $1.8257, coinciding with Fibonacci retracement levels.

The 50 EMA and 200 EMA, at $1.8198 and $1.8235 respectively, suggest a potential downward trend continuation. A shift above the pivot could introduce a bullish sentiment, but current indicators and Fibonacci levels emphasize a bearish trend for Natural Gas.

WTI Oil Price Forecast

WTI Price Chart
WTI Price Chart

Brent Price Chart
Brent Price Chart

The 50-day EMA at $86.09 and the 200-day EMA at $84.01 bolster a bullish sentiment, further confirmed by a bullish engulfing candle pattern.

The technical landscape leans towards an upward trajectory, maintaining bullishness above the $87.56 threshold. However, a dip beneath this pivot could catalyze a sell-off, urging traders to monitor closely.

Gold, Silver, Copper Daily Forecast: XAU Hits $2,257; More Buying Ahead?

Gold, Silver, Copper Daily Forecast: XAU Hits $2,257; More Buying Ahead?

Market Overview

Gold prices reached a new peak, with spot gold hitting $2,257 per ounce, despite the stronger dollar and U.S. manufacturing data indicating economic robustness. This growth dampened immediate rate cut expectations, elevating Treasury yields and the dollar, affecting gold’s allure to international buyers.

The rising ISM manufacturing index contrasts with the slowed core PCE inflation, maintaining prospects for a rate cut in June. Geopolitical tensions further underpin gold’s appeal as a safe-haven asset, potentially influencing silver and copper markets as investors navigate through economic indicators and global uncertainties.

Gold Prices Forecast

Gold - Chart
Gold – ChartAs of April 2, Gold is trading at $2,256.71, marking a 0.22% increase. The technical landscape is shaped by a pivotal point at $2,250.11, guiding the short-term market trajectory.

Gold faces resistance at $2,273.31, $2,288.22, and $2,306.08, with support levels stationed at $2,233.78, $2,217.46, and $2,203.47. The 50-day and 200-day EMAs at $2,218.62 and $2,172.89, respectively, alongside a bullish engulfing candlestick pattern, signify a potential upward trend.

The market outlook for Gold remains bullish above the $2,250.11 pivot, with a downturn risk if it dips below this threshold.

Silver Prices Forecast

Silver - Chart
Silver – Chart

Silver, on April 2, is trading at $25.32350, reflecting a gain of 0.96%. Its technical framework is defined by a pivot point at $25.10. Resistance is observed at $25.38, $25.78, and $26.13, while support levels are established at $24.74, $24.39, and $24.07.

The 50-day and 200-day Exponential Moving Averages (EMAs) are positioned at $24.90 and $24.59 respectively, suggesting an upward trend. Additionally, a bullish engulfing candlestick pattern alongside an upward price channel underscores the buying momentum in Silver.

The outlook is bullish above $25.10, with a descent below this point possibly igniting a sell-off.

Copper Prices Forecast

Copper - Chart
Copper – ChartCopper is currently priced at $4.07, showing a minor decrease of 0.02%. The pivot point at $4.05 serves as a baseline for its trading range, with resistance levels at $4.09, $4.13, and $4.17, and support levels established at $4.00, $3.96, and $3.91.

The 50-day and 200-day EMAs, both hovering around $4.05 and $4.01 respectively, indicate a stable market trend. Presently, Copper is oscillating between $4.10 and $4.05, indicating a neutral market disposition.

The trend could turn bullish above $4.05, whereas a descent below this threshold may lead to a sell-off.

XRP News Today: Scrutiny Over Coinbase Ruling Intensifies Amid SEC vs. Ripple Battle

XRP News Today: Scrutiny Over Coinbase Ruling Intensifies Amid SEC vs. Ripple Battle

US Economic Indicators and US Treasury Yields Impact XRP

On Monday, better-than-expected US ISM Manufacturing PMI numbers for March impacted riskier assets. The ISM Manufacturing PMI increased from 47.8 to 50.3 in March. Economists forecast a rise to 48.4. US Treasuries reacted to the numbers, with 10-year Treasury yields climbing 2.54%.

BTC-Spot ETF Market Outflows Surprised the Crypto Market

US BTC-spot ETF market outflow data for Grayscale Bitcoin Trust (GBTC) surprised investors. On Monday, GBTC saw net outflows of $303 million, testing buyer demand for BTC and the broader crypto market.

The figures for Monday coincided with ongoing uncertainty about the SEC vs. Ripple case.

SEC vs. Crypto-Related News Continued to Draw Scrutiny

There were no SEC vs. Ripple case-related updates to influence buyer appetite for XRP on Monday.

However, the crypto community continued scrutinizing a recent court ruling in the SEC vs. Coinbase (COIN) case. On March 27, Judge Katherine Failla partially granted the Coinbase Motion to Dismiss (MTD). Judge Failla did not grant the MTD for charges against Coinbase for operating as an unregistered securities exchange.

The SEC vs. Coinbase case could set a legal precedent before an SEC appeal against the Programmatic Sales of XRP ruling. Amicus Curiae attorney John E. Deaton believed the SEC would settle the Ripple case if Judge Failla granted the Coinbase MTD.

Ripple Chief Legal Officer Stuart Alderoty delved deeper into the March 27 ruling on Monday. Alderoty highlighted concerns about the Coinbase ruling, saying,

“Last week’s Coinbase decision has 4 different confusing definitions of what constitutes a crypto “ecosystem.”

In the court ruling, Judge Failla stated,

“In the instant Complaint, the SEC uses the term “ecosystem” in its narrower sense, to refer to the coordinated enterprises contemplated by the issuers and promoters of the thirteen crypto-assets at issue here. This Court uses the term similarly in its analysis of whether transactions in these crypto-assets qualify as “securities” under the federal securities law.”

Alderoty added,

“If this sounds like legal gibberish… it is. According to the SEC, whenever you acquire a token you are always investing in an amorphous “ecosystem” regardless of why, how, or where you acquired it.”

Referring to the Programmatic Sales of XRP ruling, Alderoty concluded,

“Once Judge Torres in the Ripple case (Ivy League educated, with Bronx street sense) looked at the full evidentiary record, she understood the SEC had strayed far from “Howey” where a promoter made promises directly to investors about a clearly defined enterprise.”

The interpretation of Howey and the matter of investment contracts and enterprises remains a matter for the courts to address. Until now, there has been no precedent for crypto exchanges offering cryptos for sale in a secondary market with no investment contracts.

In the Programmatic Sales ruling, Judge Analisa Torres opined that,

“Ripple’s Programmatic Sales were blind bid/ask transactions, and Programmatic Buyers could not have known if their payments of money went to Ripple, or any other seller of XRP. […] Since 2017, Ripple’s Programmatic Sales represented less than 1% of the global XRP trading volume. […] Therefore, the vast majority of individuals who purchased XRP from digital asset exchanges did not invest their money in Ripple at all.”

Unfortunately, Judge Torres clearly stated the Programmatic Sales ruling cannot set a precedent in future crypto-related cases. The SEC vs. Coinbase case is significant for the US digital asset space and the crypto market in general.

The lack of a US crypto regulatory framework and legal precedent will be a headwind for XRP and the broader market.

XRP Price Action

Weekly Chart sends bullish price signals.
XRPUSD 020424 Weekly Chart

Daily Chart

XRP held above the 50-day and 200-day EMAs, sending bullish price trends.

An XRP return to the $0.62 handle could give the bulls a run at the $0.6609 resistance level. A break above the $0.6609 resistance level would support a move toward the $0.70 handle.

Investors must track crypto case-related chatter and SEC activity.

Conversely, a break below the 50-day EMA could give the bears a run at the 200-day EMA and the $0.5740 support level.

The 14-day RSI reading, 47.66, indicates an XRP fall to the $0.5740 support level before entering oversold territory.

XRP Daily Chart sends bullish price signals.
XRPUSD 020424 Daily Chart

4-Hourly Chart

On the 4-hourly, XRP hovered below the 50-day and 200-day EMAs. The EMAs sent bearish price signals.

A break above the 200-day and 50-day EMAs would give the bulls a run at the $0.6609 resistance level.

However, a drop below the $0.60 handle would bring the $0.5740 support level into play.

The 4-hourly RSI, with a reading of 41.24, suggests an XRP fall to the $0.5740 support level before entering oversold territory.

XRP 4-Hourly Chart sends bearish near-term price signals.
XRPUSD 020424 4-Hourly Chart
Trading Breakouts with Fibonacci Retracements

Trading Breakouts with Fibonacci Retracements

Trading Breakouts with Fibonacci

The breakout market condition is one of the more exciting backdrops because, by definition, something relatively ‘new’ is happening. It can also be a favored strategy amongst forex traders because it can allow for outsized moves that may last for an extended period of time; potentially plotting for a price breakout to develop into a new trend that may allow for

Fibonacci breakouts: Introduction

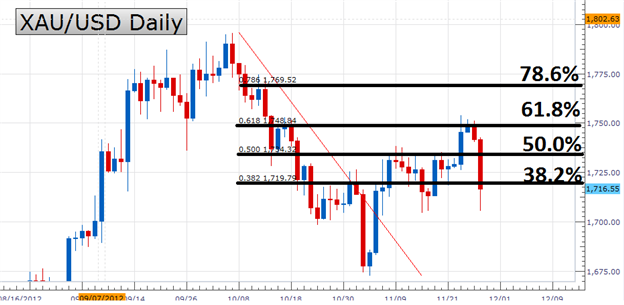
Fibonacci retracements are a popular tool to use when looking to exploit possible breakout opportunities. Identifying key levels inside of trends using Fibonacci retracements gives traders specific price zones to monitor for price breaks above or below. Implementing multiple time frame analysis can aid traders, bymagnifying long-term information in the effort of finding more granular accuracy in terms of possible entry points. This article will outline how Fibonacci retracements can be used to identify breakout opportunities and how other technical analysis techniques can beincorporated to compliment possible breakout decisions.

If you’re puzzled by trading losses, why not take a step in the right direction? Download our guide, “Traits of Successful Traders,” and gain valuable insights to steer clear of common pitfalls that can lead to costly errors.

How to Trade Range Breakouts with Fibonacci Retracements

The GBP/USD charts below exhibit a potential breakout opportunity using Fibonacci retracements. The first step as always when using the Fibonacci retracement is to locate the relevant high/low or vice versa and draw the Fibonacci retracement as seen on the weekly chart (red box, to the left of the chart). This represents a well-defined high to low. As evident from successive lower highs and lower lows price has tended towards a downward bias. This step is key as identifying the trend will aid in future trade decisions. Trend identification can be recognized in various ways such as price action (used below), oscillators and other technical indicators.

GBP/USD Daily chart:

GBP/USD with Fibonacci

Notice how after the major move was in, price action went into a range-bound state; with fairly clear definition of resistance around the 76.4% retracement to go along with supports at 38.2 and 50% retracements. Once the longer-term picture has been drawn, traders can look to focus in on smaller time frame charts for more detail. The eight-hour chart focuses in on what happened after that major move. GBP/USD began to range for much of the four months after, with numerous inflections showing off of these Fibonacci retracement levels. But, by mid-July, towards the right side of the chart, buyers began to take control, witnessed by a pullback to and show of support around the 61.8% retracement (highlighted in blue).

At that point, buyers take-over and force a bullish breakout at the same 76.4% retracement that had previously held the highs (indicated by the green box). And after the breakout takes place, buyers continue to drive as a fresh short-term bullish trend has formed.

New to trading financial markets? Here’s a guide on how to build confidence. Download the free guide now!!

GBP/USD Eight-Hour Price Chart

GBP/USD 8 Hour Chart

Fibonacci Support/Resistance: To Break or Not to Break, that is the Question

For traders implementing strategy across markets, there are two primary ways of going about it. Traders can look for directional moves or they can look for mean reversion. With a trend trading strategy, traders are looking to harness the prevailing bias in looking for some element of continuation. Range traders, on the other hand, are looking to take the other side of the matter, looking to get short after a bullish move finds resistance or, on the opposing side, looking to get long after a bearish move brings in a level of support.

The transitory state between a range and a fresh trend is the breakout; when prices push out of the range and go into what could be a fresh trend that might continue. As such, speculating for breakouts can be dangerous because, by nature, the trader is expecting something different to happen as opposed to the status quo.

So key for such approaches are strong risk and trade management, along with an analytical framework that can produce support or resistance levels that can allow for the strategy to be properly implemented. Fibonacci can certainly help in that regards.

Fibonacci breakouts: Summary

Range breakouts can be complex to identify and analyze but implementing Fibonacci retracements can give traders a clearer picture of where support and resistance zones exist. In conjunction with other technical tools, traders can make educated trade decisions on Fibonacci breakout strategies.

Key steps to consider when employing a Fibonacci breakout strategy:

  1. Correctly draw Fibonacci retracement using appropriate high/low and vice versa
  2. Identify the preceding trend
  3. Apply multiple time frame analysis with additional Fibonacci retracements
  4. Locate range
  5. Assess current market conditions
  6. Look for possible breakout opportunities when price breaks above/below resistance/support in line with preceding trend
  7. Employ sound risk management
How Do Politics and Central Banks Impact FX Markets?

How Do Politics and Central Banks Impact FX Markets?

MARKETS HAVE PASSED THE POLITICAL EVENT HORIZON

For foreign exchange (“forex” or “FX”) traders, the constant background noise that politics represents is an inescapable blackhole. Traditional media drowns in punditry, while social media drowns in puns. It doesn’t matter what asset class you’re trading either.In recent years, even a single tweet from a politician has had the capacity to move not only currencies but also bonds,commodities, and equities.

In an increasingly fractious landscape, traders need a framework by which to interpret information and understand political developments as they happen. After all, politics can become policy after enough time and effort. To this end, FX traders need a way to interpret information and political developments in the context of how fiscal policy could change and how that might impact their portfolios.

Market participants need to pay attention to more than just fiscal policy, however. With central bank activity having gained considerable traction during the Great Recession and thereafter, monetary policy looks to be a powerful lasting influence on markets. Therefore, FX traders need a viable framework to analyze both fiscal and monetary policy in tandem.

ECONOMISTS HAVE A SOLUTION BEYOND THE IS-LM MODEL

Fortunately, one such framework exists: IS-LM-BP model, or what’s known colloquially as the Mundell-Fleming model. Through this framework, FX traders can analyze how directional changes in fiscal policy (e.g. changes in taxes or government spending) and monetary policy (e.g. changes in interest rates) interact to produce various market outcomes.

Before we delve into the framework, a bit of background history on the Mundell-Fleming model.

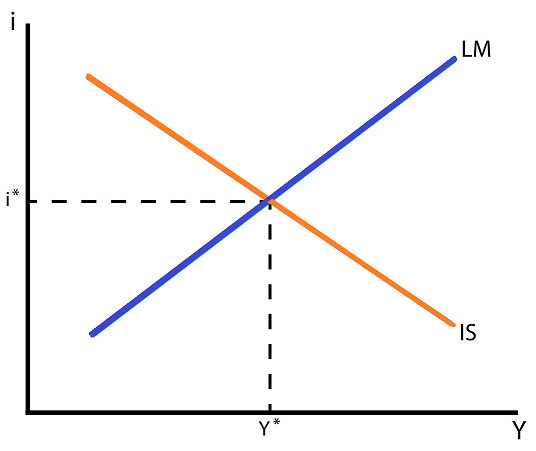
Mundell-Fleming is an extension of IS-LM, which itself is an equilibrium model used by economists to look at the relationship between interest rates (the real interest rate, “i” on the vertical axis of the chart below) and economic growth (real gross domestic product, “Y” on the horizontal axis).

IS-LM Curve – Interest Rates and Economic Growth (Chart 1)
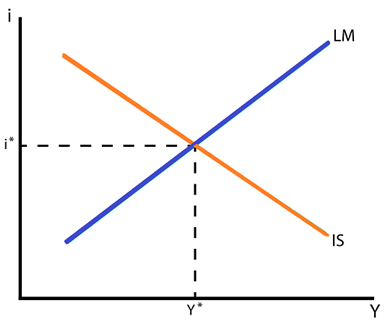
Chart showing IS-LM Curve

Without going too far down the academic rabbit hole, there are two takeaways of the IS-LM model that carryover into understanding the Mundell-Fleming model.

First, that the downward sloping IS curve demonstrates that as the level of interest rates fall, the level of economic activity rises. This is intuitive: the more readily credit is available, the more economic activity will flourish.

Second, the upward sloping LM curve demonstrates that as economic activity rises, the level of interest rates rise too. This is also intuitive: stronger economic activity provokes inflation and higher bond yields in response.

THE IS-LM MODEL IS INAPPROPRIATE FOR MODERN ECONOMIES

Why is the IS-LM model insufficient for traders? The IS-LM model is a foundational concept that ultimately leads to the classic AS-AD supply-demand model. But the IS-LM model is applicable for self-sufficient and/or closed economies; such a framework is not appropriate for a globalized world where open economies co-dependent on one another are the norm. We need to move beyond for a more complete framework.

THE MUNDELL-FLEMING MODEL WORKS BETTER FOR OPEN ECONOMIES

In the early-1960s, economists Robert Mundell and J. Marcus Fleming each produced improvements on the incomplete IS-LM model. Developed independently from one another but eventually synthesized into one unified idea, the IS-LM-BP model incorporates capital flow into the equation.

There are two different capital flow constraints within the IS-LM-BP, or Mundell-Fleming model. Countries either seehigh or lowcapital mobility. Depending upon which it is, different policy mixes lead to divergent reactions in the markets.

As a rule of thumb, developed countries and their currencies (e.g. the US, UK, Eurozone, Japan, etc.) have high capital mobility. On the other hand, emerging markets and their currencies (e.g. Brazil, China, South Africa, Turkey, etc.) have low capital mobility.

For the sake of this discussion, we will look at the Mundell-Fleming model through the lens of high capital mobility economies only, and as a result, attempt to set forth a framework to understand how different fiscal and monetary policy mixes impact the major currencies like the US Dollar, Euro, British Pound and Japanese Yen.

In a follow-up report, we will show the implications of the Mundell-Fleming model through the lens of low capital mobility economies and the resulting impact of policy changes for emerging market currencies.

DIFFERENT POLICY MIXES LEAD TO DIVERGENT REACTIONS IN MARKETS

For high capital mobility economies, there are effectively four different sets of policy shifts that can provoke a reaction in FX markets. They are:

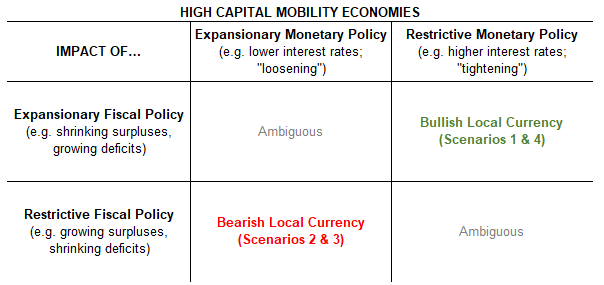
  • Scenario 1: Fiscal policy is already expansionary + monetary policy becomes more restrictive (“tightening”) = Bullish for the local currency
  • Scenario 2: Fiscal policy is already restrictive + monetary policy becomes more expansionary (“loosening”) = Bearish for the local currency
  • Scenario 3: Monetary policy already expansionary (“loosening”) + fiscal policy becomes more restrictive = Bearish for the local currency
  • Scenario 4: Monetary policy is already restrictive (“tightening”) + fiscal policy becomes more expansionary = Bullish for the local currency

It is important to note that for an economy like the United States and a currency like the US Dollar, whenever fiscal policy and monetary policy start trending in the same direction, there is often an ambiguous impact on the currency.

In other words, when viewed through the framework of the Mundell-Fleming model, when both fiscal and monetary policy are expansionary, or when both fiscal and monetary policy are restrictive, that currency is unlikely to see a significant directional move in the nearfuture.

Instead, armed with this insight, traders expecting a period of trendless oscillation in a given currency may be encouraged to set aside momentum- and trend-based strategies to adopt an approach optimized for range-bound conditions.

Mundell-Fleming Model Framework for High Capital Mobility Economies (Table 1)
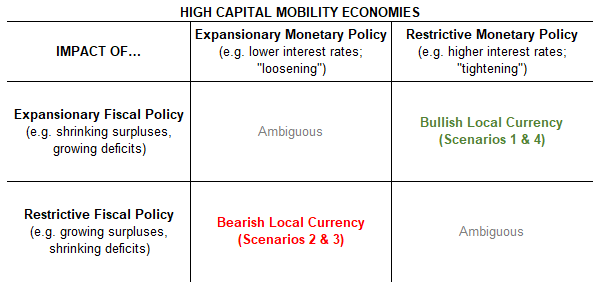
Chart showing Capital Mobility in Economies

Here are four examples in in the past decade from various high capital mobility economies from around the world that illustrate how using the Mundell-Fleming model as a framework for understanding politics and central banks would have given a trader an analytical edge.

Scenario 1 – FISCAL POLICY LOOSE; MONETARY POLICY BECOMES TIGHTER

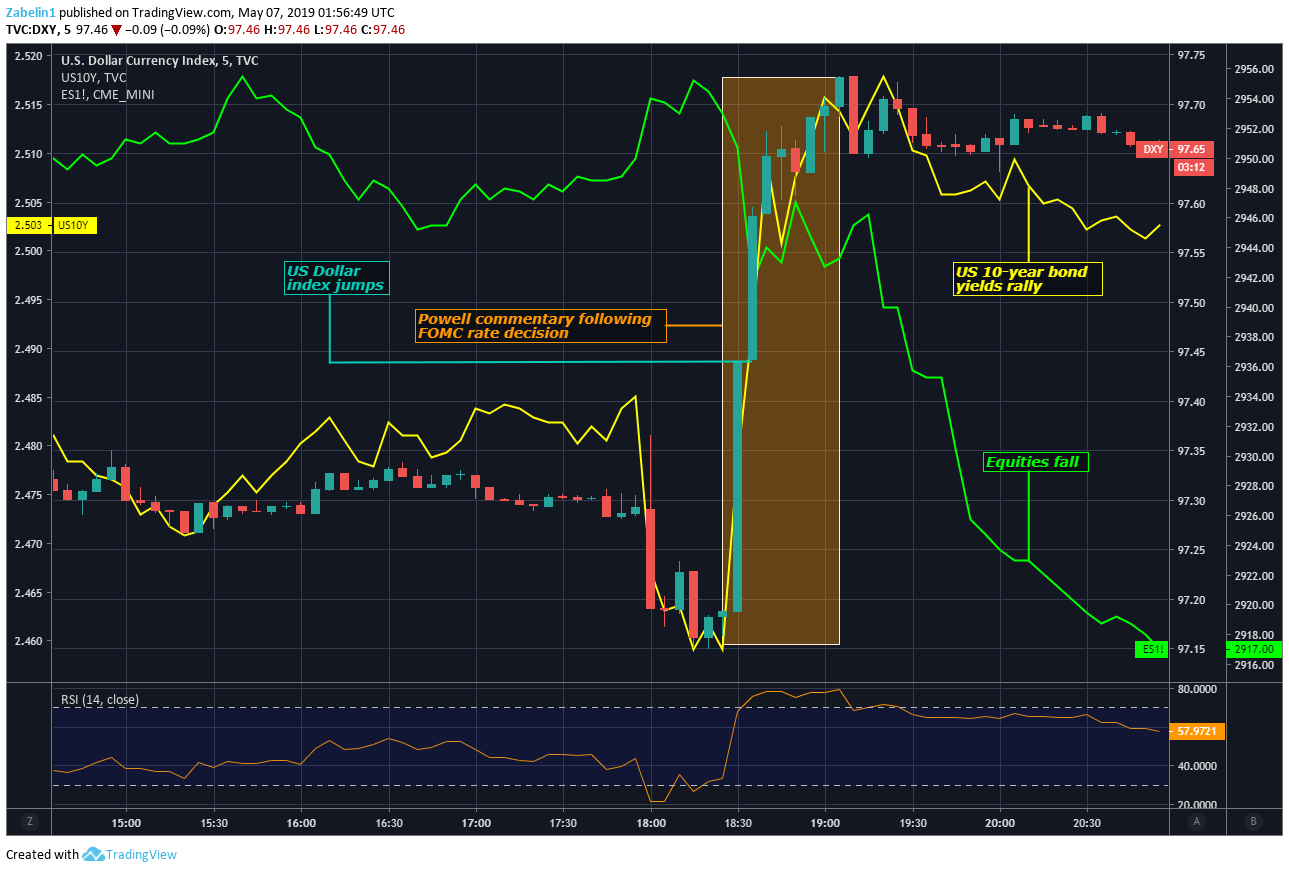
On May 2, 2019 – following the FOMC decision to hold rates at the 2.25-2.50 range – Fed Chairman Jerome Powell said that the relatively soft inflationary pressure in the economy was “transitory”. The implication behind this was that while price growth was below what central bank officials were hoping for, it would soon accelerate.

The implicit message was then a reduced probability of a cut in the future, given that the fundamental outlook was judged to be solid and the overall trajectory of US economic activity seen to be on a healthy path. The neutral tone struck by the Fed was comparatively less dovish than what markets had anticipated. This might then explain why overnight index swaps for a Fed rate cut by the end of the year fell from 67.2 percent down to 50.9 percent after Powell’s comments.

Meanwhile, the Congressional Budget Office (CBO) is forecasted an increase in the deficit over the next three years, overlapping the central bank’s tightening cycle. This also came against the backdrop of speculation about a bipartisan fiscal stimulus plan. In late April, key policymakers announced plans for a US$2 trillion infrastructure program.

The combination of expansionary fiscal policy and monetary tightening made the case for a bullish outlook for the US Dollar. The fiscal package was expected create jobs and boost inflation, thereby nudging the Fed to raise rates. As it happened, the Greenback added 6.2 percent against an average of its major currency counterparts over the subsequent four months.

Scenario 1: DXY, 10-Year Bond Yields Rise, S&P500 Futures Fall (Chart 2)
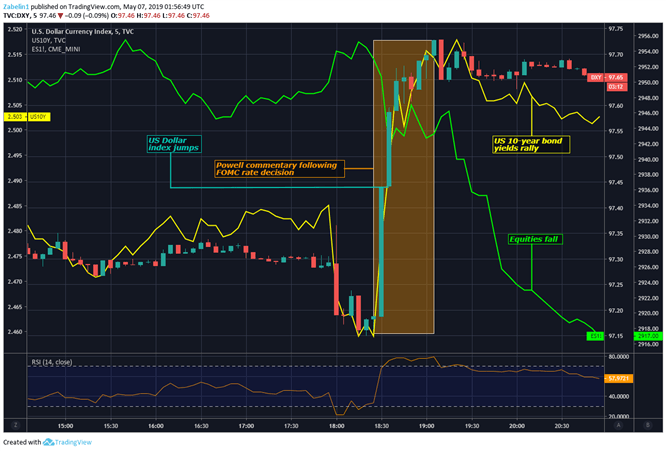
Chart showing DXY, S&P 500 Futures

Scenario 2 – FISCAL POLICY TIGHT; MONETARY POLICY BECOMES LOOSER

Theglobal financial crisis in 2008 and the Great Recession that followed rippled out worldwide and destabilized Mediterranean economies. This stoked worries about a region-wide sovereign debt crisis as bond yields in Italy, Spain and Greece climbed to alarming levels.

Investors began to lose confidence in the ability of these governments to service their debt and demanded a higher yield for incurring what appeared to be a higher risk of default. The Euro was in pain amid the chaos and suffered as doubtsemerged about its very existence in the event that the crisis would force the unprecedented departure of a member state from the Eurozone.

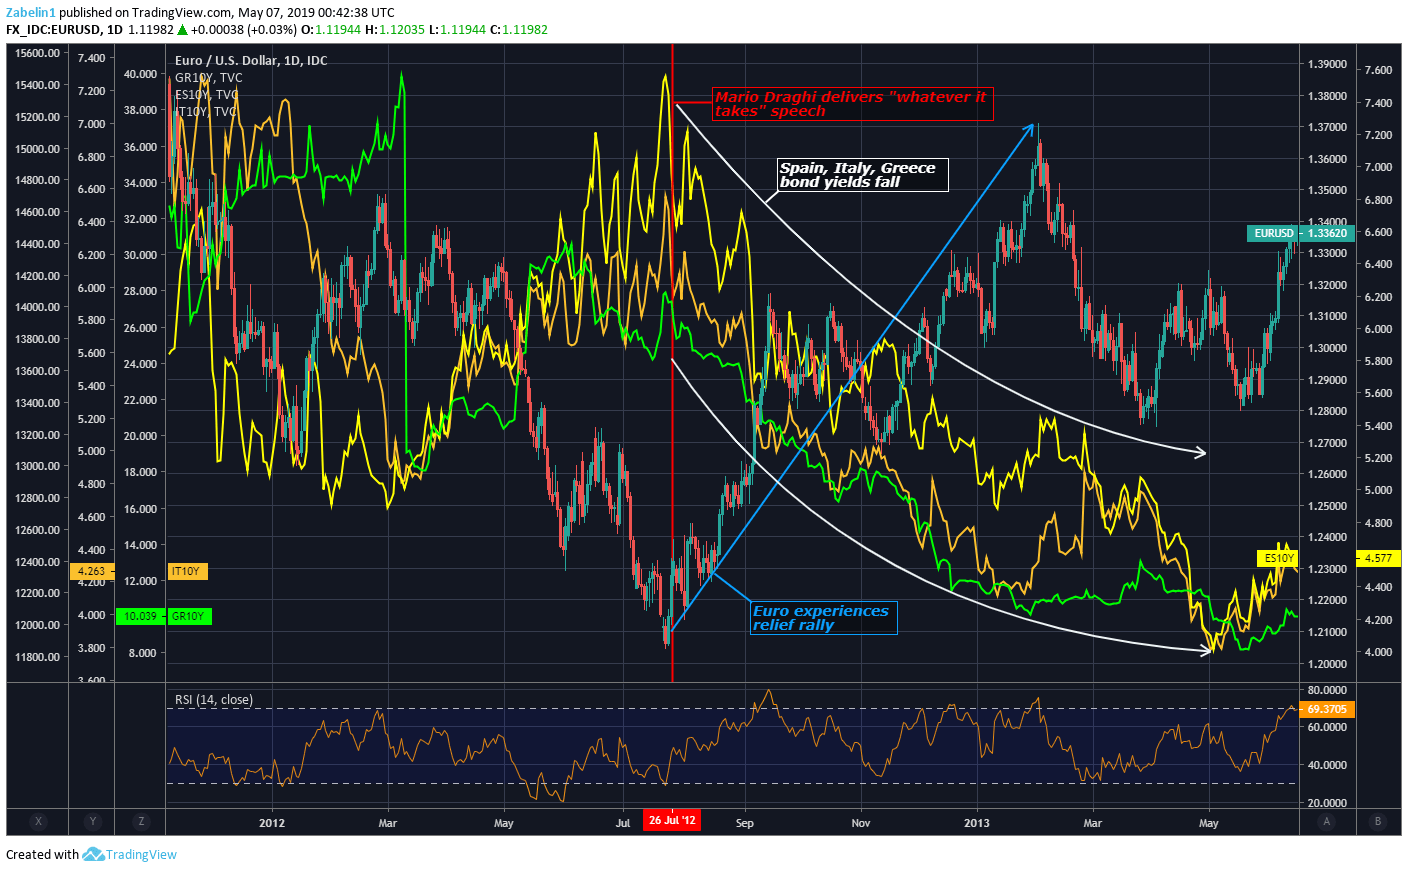
In what is considered to be one of the most famous moments in financial history, European Central Bank (ECB) President Mario Draghi delivered a speech in London on July 26, 2012 which many would come to see as the pivotal moment that saved the single currency. He said that the ECB is “ready to do whatever it takes to preserve the Euro. And believe me,” he added,“it will be enough.” This speech calmed European bond markets and helped bring yields back down.

The ECB alsocreated a bond-buying program called OMT (for “Outright Monetary Transactions”). It was aimed at reducing stress in sovereign debt markets, offering relief to distressed Eurozone governments. While OMT was never used, its mere availability helped becalm jittery investors.At the same time, many of the troubled Euro area states adopted austerity measures to stabilize government finances.

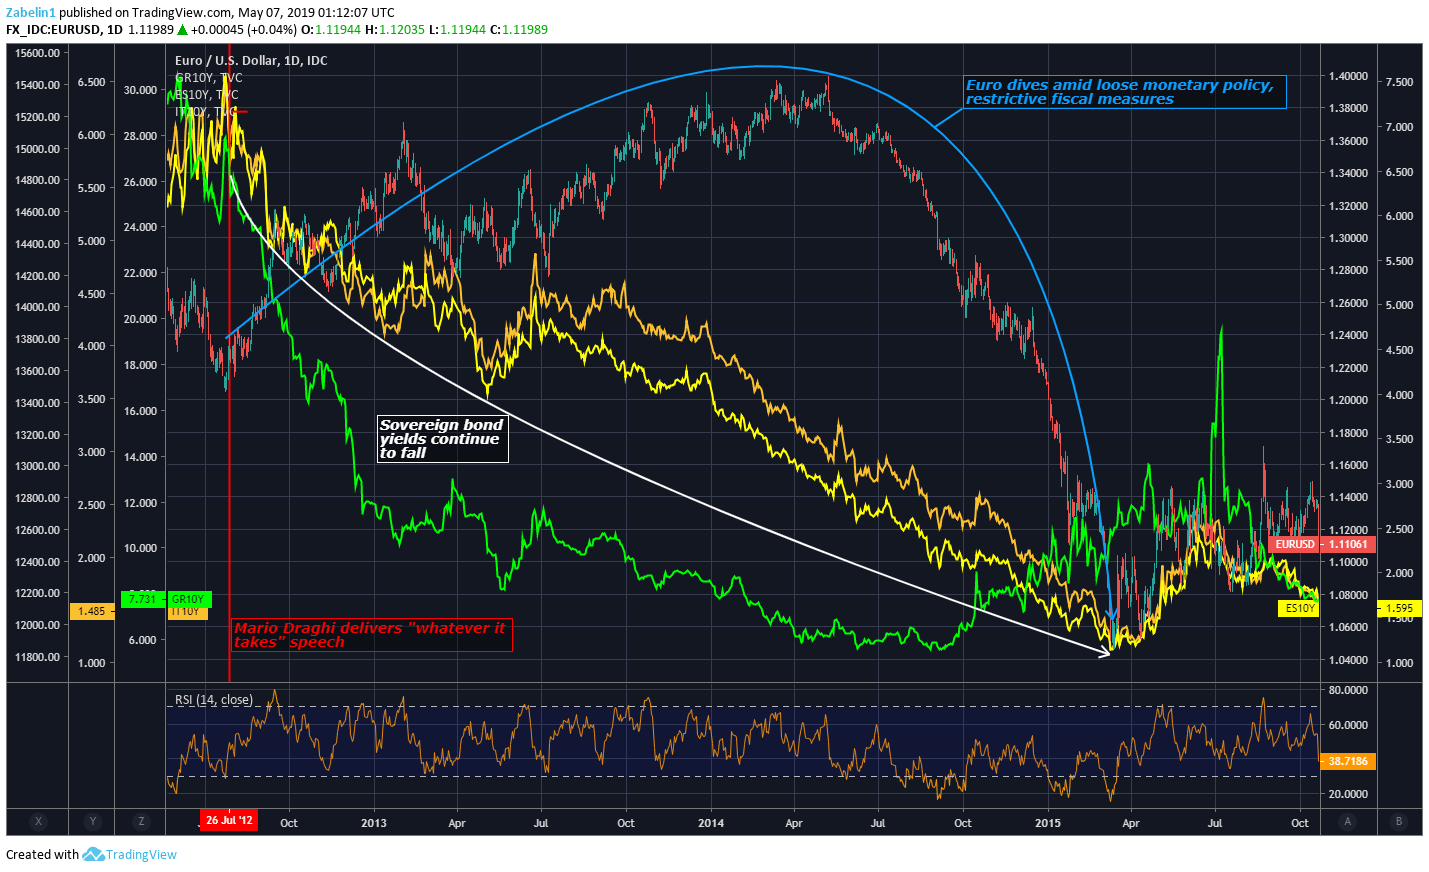
While the Euro initially rose as worries about its collapse receded, the European currency would depreciate substantially against the US Dollar over the course of the following three years. By March 2015, it had lost over 13 percent of its value. When examining the monetary and fiscal set up, it becomes quite clear why.

Scenario 2: Euro Sighs Relief – Sovereign Bond Yields Fall as Insolvency Fears are Quelled (Chart 3)
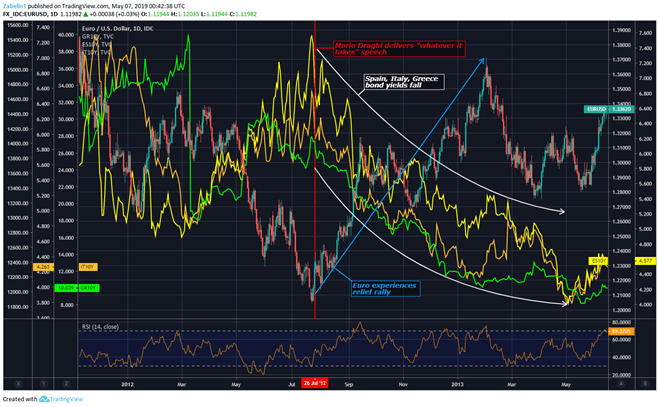
Chart showing EUR/USD

Austerity measures in many Eurozone countries limited their governments’ ability to provide fiscal stimulus that might have helped create jobs and boost inflation. At the same time, the central bank was easing policy as a way to alleviate the crisis. Consequently, this combination pressured the Euro lower against most of its major counterparts.

Scenario 2: Euro, Sovereign Bond Yields Fall (Chart 4)
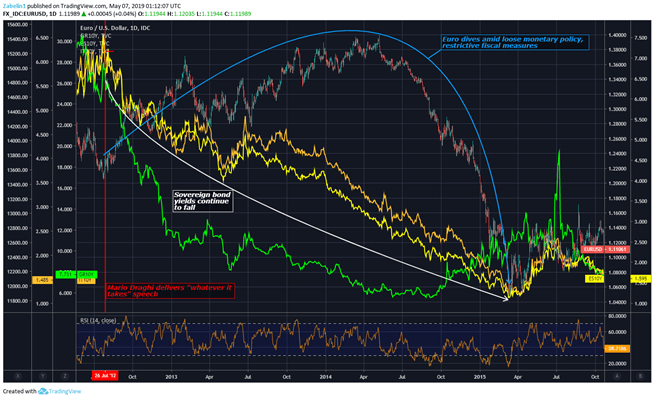
Chart showing EUR/USD

Scenario 3 – MONETARY POLICY LOOSE; FISCAL POLICY BECOMES TIGHTER

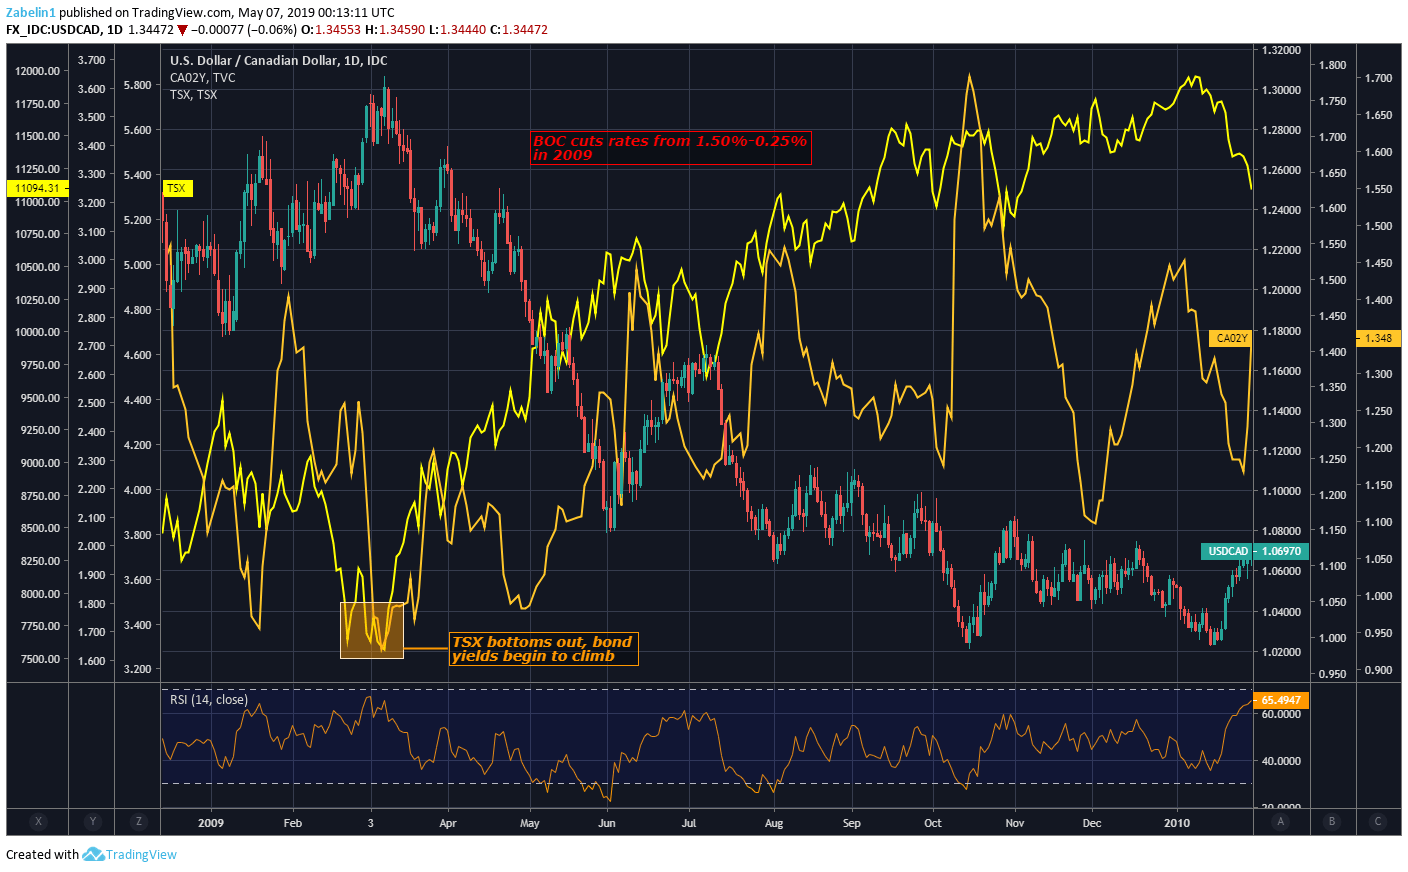
At the early stages of the Great Recession, the Bank of Canada (BOC) cut its benchmark interest rate from 1.50 to 0.25 percent as a way to ease credit conditions, restore confidence and revive economic growth. Counter-intuitively, the yield on 10-year Canadian government bonds began to rise. This rally came right around the same time as Canada’s benchmark TSX stock index established a bottom.

Scenario 3: USD/CAD, TSX, Canadian 2-Year Bond Yields (Chart 5)
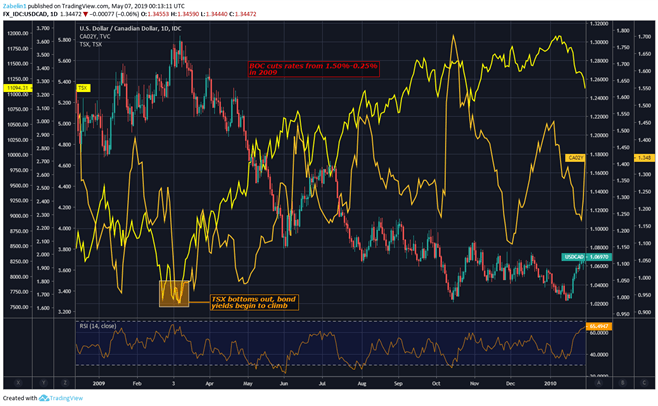
Chart showing USD/CAD, TSX

The subsequent restoration of confidence and recovery in share prices was reflected investors’ shifting preference for riskier, higher-returning investments (like stocks)from comparatively safer alternative (like bonds). This reallocation of capital sent yields higher despite the central bank’s monetary easing. The BOC then began to raise rates anew and brought them up to 1.00 percent, where they remained for the subsequent five years.

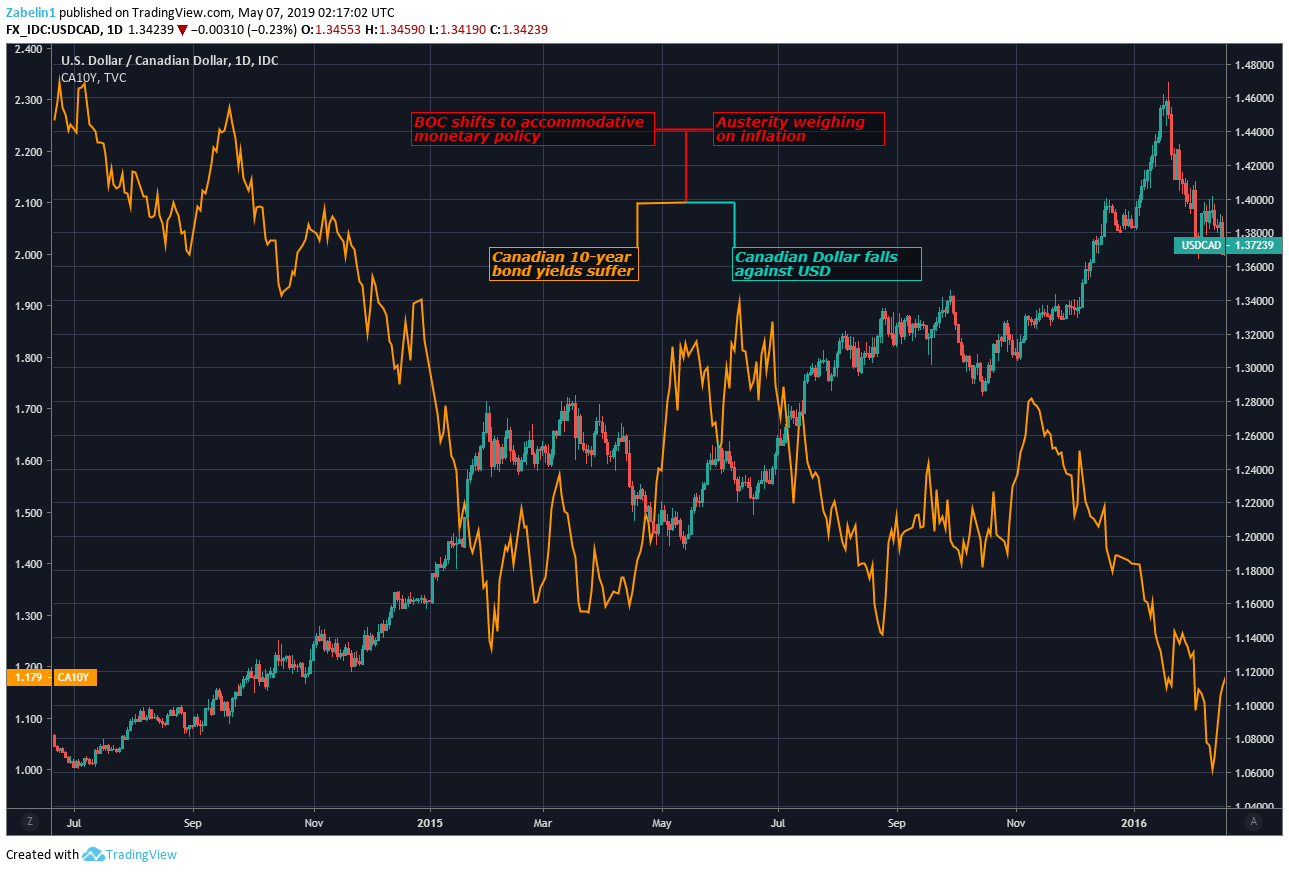
During this time, Prime Minister Stephen Harper implemented austerity measures to stabilize the government’s finances amid the global financial crisis. The central bank then reversed course and cut rates back to 0.50 percent by July 2015. Both CAD and local bond yields suffered as monetary policy was loosened while the capacity for fiscal policy support was constrained. As it happens, cutting back government spending at this difficult time ended up costing Mr Harper his job. Justin Trudeau replaced him as Prime Minister following a victory in the 2015 general election.

Scenario 3: USD/CAD, Canada 2-Year Bond Yields (Chart 6)
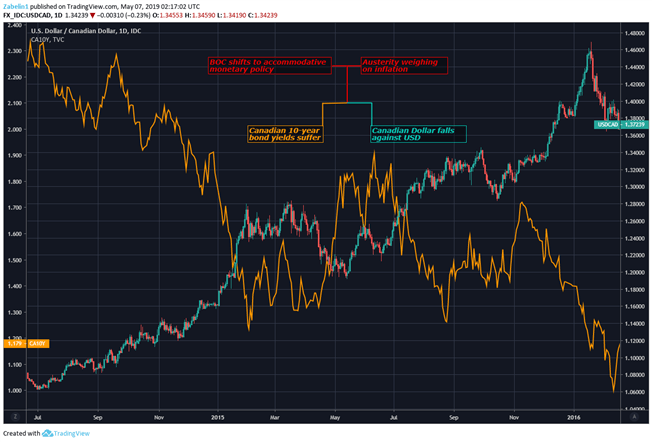
Chart showing USD/CAD

Scenario 4 – MONETARY POLICY TIGHT; FISCAL POLICY BECOMES LOOSER

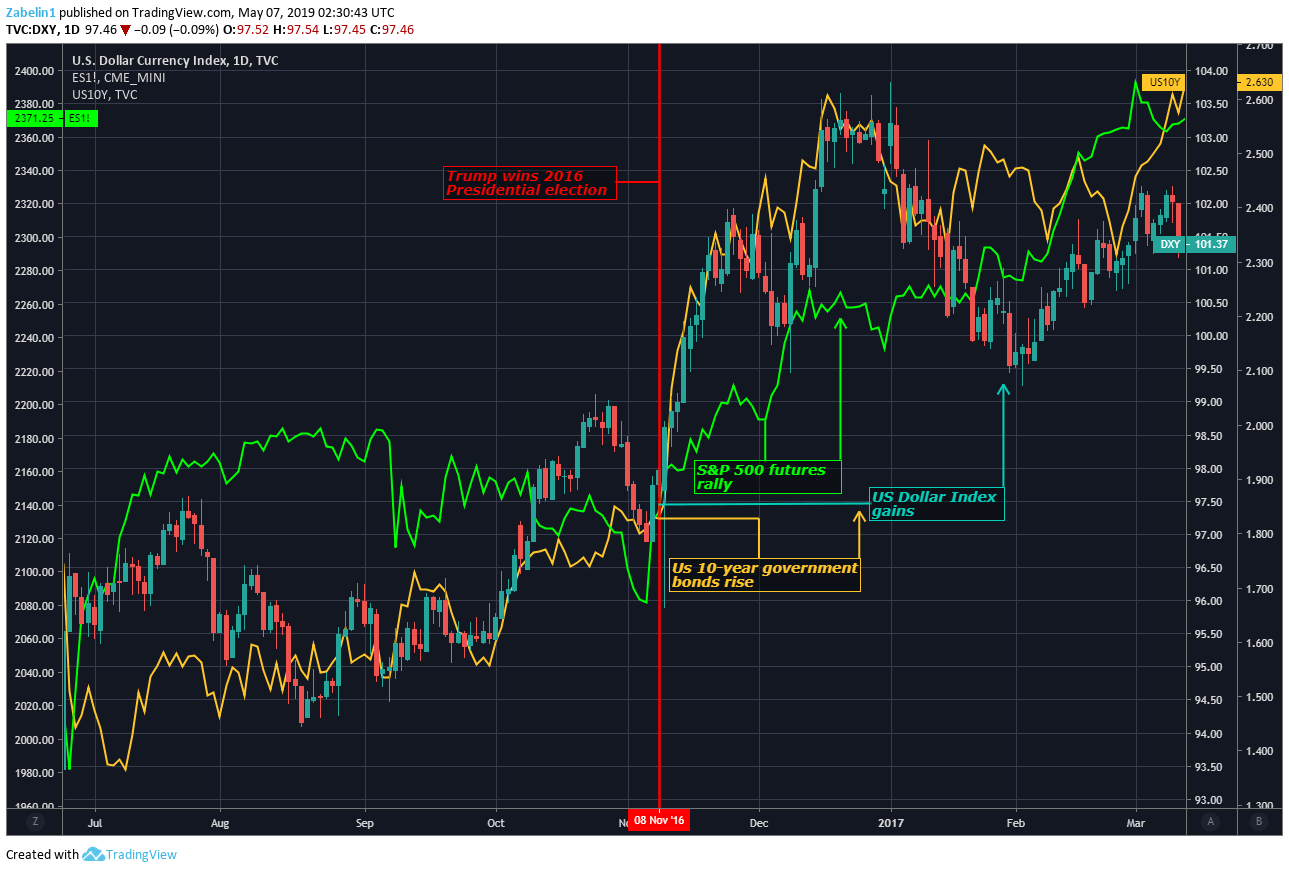
After Donald Trump was proclaimed the victor in the 2016 USpresidential election, the political landscape and economic backdrop favored a bullish outlook for the US Dollar. With the the Oval Office and both houses of Congress thus controlled by the Republican Party, the markets appeared to conclude that scope for political volatility had was substantially reduced.

This made the market-friendly fiscal measures proposed by candidate Trump during the electionappear more likely to be implemented. These included tax cuts, deregulation and infrastructure building. Investors appeared to overlook threats to launch trade wars against top trading partners such as China and the Eurozone, at least for the time. On the monetary side, central bank officials raised rates at the tail end of 2016 and were looking to hike again by at least 75 basis points through 2017.

With scope for fiscal expansion and monetary tightening in sight, the US Dollar rallied alongside local bond yields and equities. This came as corporate earnings expectations strengthened alongside the outlook for broader economic performance, which likewise stoked best on firmer inflation and thereby on a hawkish response from the central bank.

Scenario 4) US Dollar Index (DXY), S&P 500 Futures, 10-Year Bond Yields (Chart 7)
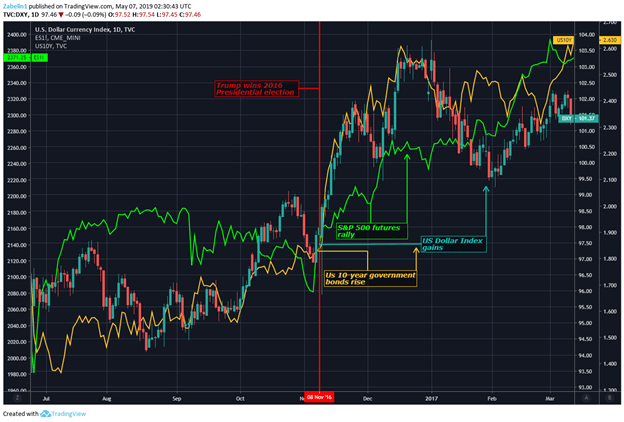
Chart showing S&P 500 Futures, US Dolla

LIMITATIONS OF THE MUNDELL-FLEMING MODEL

For many years, the IS-LM-BP or Mundell-Fleming model was a way to measure the impact of changes in policy for small open economies. In turn, many economists suggest that economies with significant enough scale may not adhere to the “rules” that “normal” economies have to contend with, and as a result, the IS-LM model was deemed preferable.
But in the past decade, new research has showed that the framework presented in IS-LM-BP in fact captures the state of the contemporary globalized economy better than the IS-LM model alone. Needless to say, opinions on the subject abound across the spectrum of economists.

Ultimately, there is no ‘Holy Grail’ analytical framework that will yield the proper insight every single time, regardless of the political context or the status of the monetary system. There may be times that events produce market reactions that can’t be readily understood or explained.

And yet, not having a framework for how to interpret how politics and central banks are moving FX markets would be irresponsible. Using the Mundell-Fleming model as a guide may help traders filter out the noise of the day-to-day news cycle, helping them better understand and practically react to information shaping FX market price trends.