The (USDJPY) rose in its last intraday trading, preparing to attack the solid resistance at 156.95, taking advantage of the dynamic support that is represented by its trading above EMA50, amid the dominance of the main bullish trend on the short-term basis, with its trading alongside minor trend line that reinforces this trend, besides the emergence of positive signals from the relative strength indicators, which intensifies the chances of the rise on the near-term basis.
Silver price is gathering gains
Silver price witnessed fluctuated trading on its last intraday levels, to gather the gains of its previous rises, attempting to offload some of its clear overbought conditions on the relative strength indicators, especially with the emergence of the negative signals, to gather its positive strength that might help it to resume its gains on near-term basis, amid the continuation of the positive support due to its trading above EMA50, which reinforces the strength and dominance of the main bullish trend on the short-term basis, with its trading alongside supportive trend line for this trend.
GBPUSD price is getting positive support
GBPUSD rose in its last intraday trading, due to its leaning on EMA50’s support, gaining bullish momentum that helped it achieve these gains, preparing to reach the stubborn resistance at 1.3525, amid the dominance of the main bullish trend on the short-term basis and its trading alongside supportive trend line, with the emergence of positive overlapping signals on the relative strength indicators, after reaching oversold levels exaggeratedly compared to the price move, indicating a beginning of forming positive divergence.
EURUSD price is showing new positive signals
The (EURUSD) price is rising in its last intraday trading, due to the dominance of the main bullish trend on the short-term basis, and there is negative dynamic pressure that is represented by its trading above EMA50, which reduces the chances of full recovery on the near-term basis, supported by positive overlapping signals from the relative strength indicators, after reaching oversold levels, exaggeratedly compared by the price move, indicating the beginning of forming positive divergence, which might open the way for temporary rise.
Crude oil price is slipping lower
Crude oil continued its sharp decline in its recent intraday trading, affected by the continuation of the negative pressure due to its trading below EMA50, indicating the weak momentum and imposes clear restrictions on any bullish rebound attempts currently.
This negative performance is accompanied by the negative signals from the relative strength indicators, despite reaching oversold levels, indicating the continuation of the selling pressures dominance amid the dominance of the main bearish trend on the short-term basis, anticipating any technical signals that may threaten any upcoming attempts to settle.
Gold price is declining to reach our expected target
Gold declined in its recent intraday trading, affected by the stability of the main resistance at $4,500, which represents expected target in our previous analysis, to enter correction range to attempt to gain bullish momentum.
The price is moving under the dominance of the main bullish trend on the short-term basis, with the trading alongside supported trend line for this track, besides the trading above EMA50, providing key dynamic support, however the beginning of negative overlapping signals appearance on the relative strength indicators suggest forming negative divergence that might push for bearish corrective rebounds on the intraday basis.
Solana Price Forecast: SOL climbs above $137 as spot ETF demand accelerates
- Solana trades above $137 on Tuesday after rallying more than 7% in the previous week.
- US-listed spot ETFs recorded $16.24 million in inflows on Monday, marking the largest single-day inflow since mid-December.
- On-chain indicators suggest further upside potential, as stablecoin market capitalization rises, alongside increased whale activity and buy-side dominance.
- Solana (SOL) price extends gains above $137 at the time of writing on Tuesday, up more than 7% in the previous week. Institutional demand for SOL continues to strengthen, as spot exchange-traded funds (ETFs) recorded positive flows of more than $16 million on Monday, marking the largest single-day inflow since mid-December. Meanwhile, supportive on-chain metrics indicate a bullish outlook, hinting at further gains for SOL.
Institutional demand continues to strengthen
Institutional demand for Solana has continued to grow since its launch on October 28. SoSoValue data shows that spot Solana ETFs recorded $16.24 million in inflows on Monday, the highest single-day inflow since mid-December. Moreover, the total net assets surpassed $1 billion so far this week, suggesting rising institutional demand. If inflows continue and intensify, SOL could see a price rally.
Solana’s on-chain data shows bullish bias
CryptoQuant’s summary data points to a bullish outlook, as Solana’s spot and futures markets show large whale orders, cooling conditions and buy-side dominance. All these factors signal improving sentiment among traders, hinting at a potential continuation of the bullish move in the upcoming days.
DefiLlama data shows that SOL’s stablecoin total supply has been recovering since early January and currently stands at $15.32 billion. Such stablecoin activity and value increase on the SOL project indicate a bullish outlook, as they boost network usage and can attract more users to the ecosystem.
Solana Price Forecast: SOL bulls aiming for the $150 mark
Solana price broke above the upper trendline of a falling wedge pattern (drawn by connecting multiple highs and lows since early October) on December 26. It rose over 12% through Monday, closing above the 50-day Exponential Moving Average (EMA) at $163.45. As of Tuesday, SOL is trading above $137.
If SOL continues its upward trend, it could extend the rally toward the next resistance level at $150.61, its 100-day EMA.
The Relative Strength Index (RSI) on the daily chart reads 63, above the neutral level of 50, indicating bullish momentum gaining traction. In addition, the Moving Average Convergence Divergence (MACD) indicator shows a bullish crossover and rising green histogram bars above the neutral level, further supporting the bullish outlook.
Think ahead: 2026 in ten charts – Part one
2025 was chaotic. 2026 might be even more so, if this weekend’s drama is anything to go by. James Smith has the pick of the top charts to watch as we start the new year.
Will tariffs fall in 2026?
Sometime soon, the Supreme Court will rule on President Trump’s use of emergency powers to impose country‑level tariffs – and betting markets put the odds of him losing at 70–80%. Comments from the White House suggest it’s bracing itself for that too.
If the Court strikes down the policy, “reciprocal” tariffs disappear, pulling the average tariff rate from roughly 16–17% (on paper) to below 10%, triggering a messy scramble for refund claims. What the President does next is crucial. The Venezuela intervention – risky with his Republican base – hints he may double down on policies central to his ideology. But if emergency powers are off the table, his tariff options become messier.
A temporary fix would be a blanket 15% tariff on all imports, though it only lasts 150 days. More durable sector‑specific tariffs require lengthy investigations and, as Carsten noted in our 2026 outlook, would be damaging. Either way, the President will want to keep tariff revenue flowing if he hopes to sell Congress on his “tariff rebate checks”.
Yet with approval ratings sliding ahead of the midterms – and with some food‑related levies already slashed – broader tariff cuts can’t be ruled out if political pressure builds, regardless of what the Court decides. I certainly wouldn’t bet against it…
How Trump’s tariffs have changed since ‘Liberation Day’Will the Fed bow to political pressure and slash rates?
It’s the battle of the Kevins – Trump’s pick for the next Fed Chair, due imminently. And interestingly, according to betting site PredictIt, former Fed governor Kevin Warsh has just narrowly overtaken Hassett (Director of the National Economic Council) as favourite.
Whoever is picked, remember the Chair is only one vote among twelve. Past Trump appointees – Bowman and Waller – haven’t backed calls for drastic rate cuts, despite being in the running for Chair. And quietly, all twelve regional Fed presidents — who vote on a rotating basis — were reappointed last month without drama, despite fears a more political Fed might try to reappoint only the doves. Deeper rate cuts are not an automatic consequence of a new Fed Chair, but their appointment could herald a more activist central bank, James Knightley reckons.
Still, I’m minded to say the Supreme Court case, starting 21 January, on whether the President can remove Governor Lisa Cook, will be more interesting. A ruling against Cook could theoretically open the door to broader firings and perhaps a far more political Fed. Otherwise, the Fed lineup won’t change again until 2028, when Chair Powell’s term ends, if he doesn’t voluntarily leave before.
Kevin Hassett favourite to become Fed Chair in betting markets
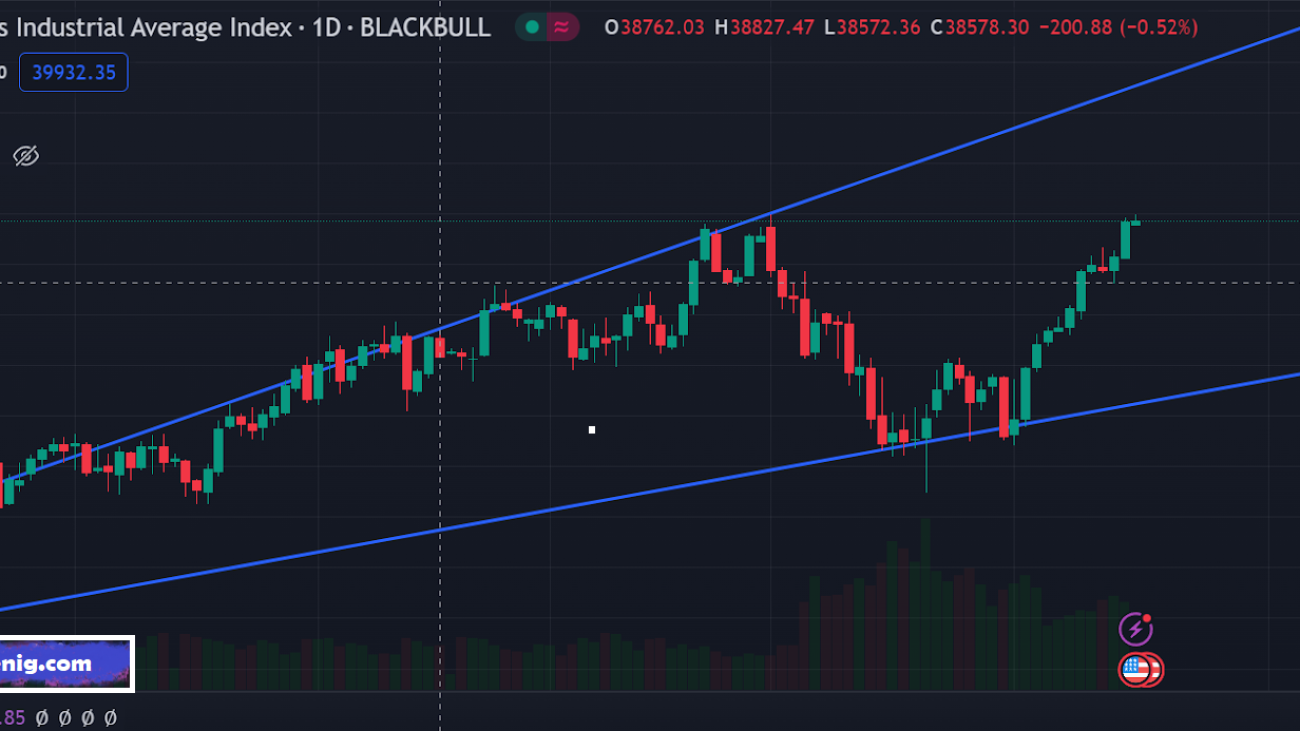
Dow price surrounded with positive pressures
Dow Inc. (DOW) stock price recorded further gains in its latest intraday trading, amid the dominance of a corrective upward trend and price action moving along a short-term supportive minor trend line. This comes alongside continued dynamic support from trading above its SMA50, while positive signals continue to emerge from the RSI after the price managed to unwind part of its overbought conditions.
Therefore we expect the stock price to rise in upcoming trading, as long as it remains stable above the $23.30 support level, to target the key resistance at $26.00.
Today’s price forecast: Bullish
Who controls Venezuela’s oil now, and what does Maduro’s arrest mean for energy markets?
The US move against Venezuelan president Nicolás Maduro has refocused attention on one of the world’s most politically sensitive oil industries, forcing investors to reassess who controls the country’s petroleum resources and whether they can be meaningfully revived after decades of decline.
For now, the answer appears relatively straightforward. Andy Lipow, president of Lipow Oil Associates, said: “Petróleos de Venezuela (PDVSA), the state-owned oil company, controls the vast majority of oil production and reserves.”
US energy major Chevron operates in the country through its own output and via a joint venture with PDVSA, while Russian and Chinese firms are also involved through partnerships. However, “majority control still rests with PDVSA,” according to Lipow. Chevron shares rose more than 6% in pre-market trading by 8:00 a.m. Eastern Time on Monday.
Venezuela nationalized its oil industry in the 1970s, leading to the creation of PDVSA. Oil output peaked at around 3.5 million barrels per day in 1997, but has since fallen to an estimated 950,000 barrels per day, of which about 550,000 barrels per day are exported, according to data from Lipow Oil Associates.
If a government more aligned with the United States and more supportive of investment were to take power, Chevron would be “best positioned” to expand its role, said Saul Kavonic, head of energy research at MST Financial. He added that European firms such as Repsol and Eni could also benefit, given their existing presence in Venezuela.
What does this mean for global oil markets?
Industry experts warned that any regime change could disrupt the trading chain that keeps Venezuelan oil flowing.
“Given the lack of clarity over who is in charge in Venezuela right now, we could see exports grind to a halt because buyers don’t know who to pay,” Lipow said. He added that the latest round of US sanctions targeting the so-called shadow fleet of oil tankers had already hit exports hard, forcing Venezuela to cut production.
The term “shadow fleet” refers to tankers operating outside traditional shipping, insurance, and regulatory systems to transport oil from sanctioned countries. These vessels are commonly used to move crude from countries such as Venezuela, Russia, and Iran, which face US restrictions on energy exports.
Lipow expects Chevron to continue exporting roughly 150,000 barrels per day, limiting any immediate impact on supply. However, he said broader uncertainty could add a short-term risk premium of around $3 per barrel.
This potential increase comes at a time when many analysts believe the market is adequately supplied, at least for now. Bob McNally of Rapidan Energy Group said the oil market is currently heading toward a surplus, describing the immediate impact as “almost negligible.”
Venezuela’s longer-term importance lies in the type of crude it produces. The country’s heavy, high-sulfur oil is difficult to extract, but highly sought after by complex refineries, particularly in the United States. McNally said: “US refineries love to gulp down this thick crude from Venezuela and Canada.”
He added: “The real question is whether the oil industry can return to Venezuela and reverse two decades of decline, neglect, and damage, and actually raise production again.”
If opposition leader María Corina Machado were installed as president quickly, sanctions could be eased and oil exports might initially rise as inventories are drawn down to generate revenue, according to Lipow. However, he noted that any short-term increase could weigh on prices.
Global benchmark Brent crude futures for March delivery rose 0.5% to $61.03 per barrel, while US West Texas Intermediate futures for February delivery climbed 0.6% to $57.64 per barrel.
Still, any vision of a sustained recovery faces severe physical constraints. “Venezuela’s oil industry is in such a degraded state that even with a change in government, it is unlikely we would see any meaningful increase in production for years,” Lipow said, noting that rehabilitating existing infrastructure would require substantial investment.
Similarly, Helima Croft of RBC warned that the road to recovery would be long, pointing to “decades of decline under the Chávez and Maduro regimes.” She said oil executives estimate that at least $10 billion per year would be needed to repair the sector, with a “stable security environment” being an essential prerequisite.
She added: “All bets are off in a chaotic power transition scenario, like those seen in Libya or Iraq.”