CANADIAN_2_L

Canadian dollar rebounds from two-month trough

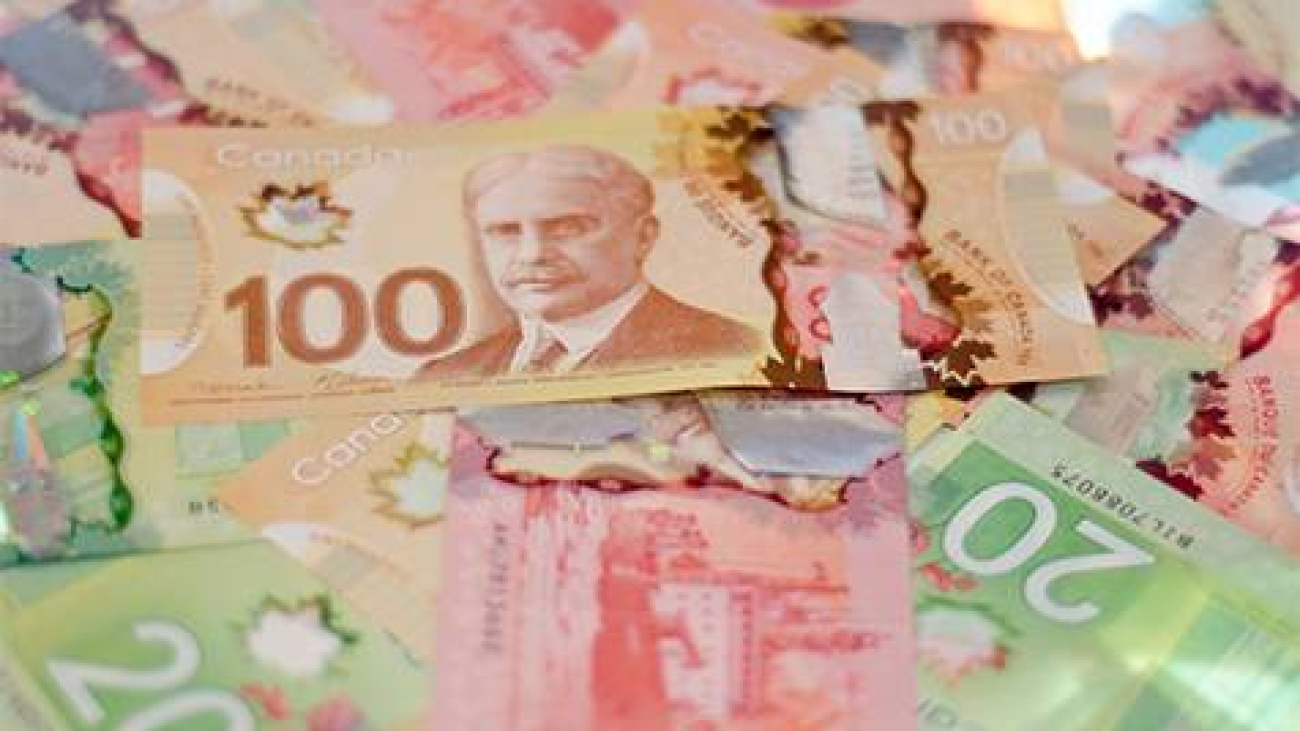
The Canadian dollar rose slightly against its US counterpart on Monday, as recent pessimism over the outlook for the Middle East war eased, allowing it to recover part of its losses after hitting a two-month low earlier in the session.

The Canadian currency, known as the “loonie,” was trading up 0.1% at 1.3715 per US dollar, or 72.91 US cents, after touching an intraday low of 1.3754, the weakest level since January 23.

Erik Bregar, Director of FX and Precious Metals Risk Management at Silver Gold Bull, said: “Markets have seen significant swings in broader risk sentiment. The Canadian dollar is behaving somewhat more steadily… and is not showing the same level of volatility we see in metals, equities, or bonds.”

The US dollar, considered a safe-haven asset, weakened against a basket of major currencies, while equities rose after US President Donald Trump announced he would delay strikes on Iranian energy infrastructure following talks described as “productive” between the two sides.

Oil prices — one of Canada’s key exports — also declined by 10.3% to $88.13 per barrel, easing some concerns that rising inflation could lead to tighter global monetary policy.

Money markets are currently pricing at least two interest rate hikes by the Bank of Canada this year, after expectations had previously leaned toward keeping policy unchanged before the outbreak of the conflict.

Bregar said: “The short end of the yield curve is overreacting. I don’t think any central bank will respond hastily to price increases lasting only one or two months.”

Data from the US Commodity Futures Trading Commission (CFTC) showed that speculators reduced their bullish bets on the Canadian dollar, with net non-commercial long positions falling to 886 contracts as of March 17, compared with 36,159 contracts in the previous week.

Canadian government bond yields declined across the curve, with the two-year yield falling by 14 basis points to 2.927%, after having reached its highest level since November 2024 at 3.212%.


jpy

The USDJPY price shows cautious gains

The USDJPY pair rose during recent intraday trading, attempting to recover part of its previous losses. At the same time, it is trying to ease its clearly oversold condition on the relative strength indicators, especially with the beginning of a positive crossover.


Earlier, the pair was affected by breaking out of an ascending price channel that contained its short-term trading, while it continues to face negative dynamic pressure as it trades below EMA50. This limits the chances of a full recovery in the near term.


silver3

Silver prices show new negative signals

Silver prices declined in recent intraday trading, as the main bearish trend continues to dominate, with price movements following a minor downward trendline that supports this path in the short term.


The price is also facing increasing negative pressure due to trading below EMA50, which reduces the chances of a full recovery in the near term. This comes alongside the emergence of a negative crossover of the relative strength indicators, after reaching overbought levels compared to price movement, indicating a potential formation of a negative divergence that strengthens bearish pressure.

gbp

GBPUSD price sees temporary correction, paving the way for potential rise

The GBPUSD pair declined during recent intraday trading, influenced by a rebound from a short-term main downward trendline. The pair is supported by dynamic support as it trades above EMA50, along with positive signals from the relative strength indicators, despite reaching heavily overbought levels. This supports the likelihood of the pair resuming its gains in the near term. Therefore, this decline can be seen as a profit-taking move aimed at building positive momentum that may help support a recovery.


eur

EURUSD price accelerates profit-taking

The EURUSD price declined in its recent intraday trading, in a corrective move aimed at taking profits from the strong gains recorded in yesterday’s session. This comes as an attempt to build positive momentum that could support a resumption of the upward trend in the coming period.


The pair is also trying to relieve some of the overbought conditions on the relative strength indicators, especially with the beginning of a negative crossover appearing on it. Despite this decline, the price is still benefiting from dynamic support as it trades above EMA50, which reinforces the stability of a short-term bullish corrective wave.


oil

Crude oil prices attempt to recover some losses

Crude oil prices rose during recent intraday trading, attempting to recover part of the losses incurred in yesterday’s session. This move also comes as the price tries to relieve oversold conditions on the relative strength indicators, especially with the beginning of a positive crossover appearing.


Despite this rebound, the price still faces clear negative pressure after breaking a key short-term upward trendline, while continuing to trade below EMA50. This increases bearish pressure and limits the chances of a sustained recovery in the coming period.

images

Gold price declines under key resistance pressure

Gold prices declined in recent intraday trading, affected by the solid resistance level at $4,500, while the short-term corrective downtrend continues to dominate.


The price is also facing ongoing negative pressure as it trades below EMA50, reinforcing the bearish trend. In the background, a negative divergence is starting to form on the relative strength indicators after reaching overbought levels compared to price movement, along with the appearance of a negative crossover, increasing the likelihood of continued decline in the near term.

yen

GBPUSD price begins to offload its oversold conditions

The GBPUSD pair es experiencing fluctuating trading on its last intraday levels, in attempt to recover some of its previous losses, attempting to offload some of its clear oversold levels on the relative strength indicators, especially with the emergence of positive overlapping signals from them, after its trading alongside main bearish trend line on short-term basis that it failed to breach it previously, and there is negative and dynamic pressure that is represented by its trading below EMA50, increasing the likelihoods of the negative pressures continuation on near term basis.

Oil_Down_L_1

Oil prices tumble over 13% as Trump delays hit on Iranian power plants

Oil prices fell more than 13% on Monday after US President Donald Trump announced that he would order the military to delay any strikes targeting electricity plants and energy infrastructure in Iran.

Brent crude futures dropped by about $17, or 15%, to hit an intraday low of $96 per barrel, while US West Texas Intermediate crude declined by about $13, or around 13.5%, to a low of $85.28.

Trump had warned that Iranian power plants would be destroyed if Tehran did not fully reopen the Strait of Hormuz to all shipping traffic within 48 hours, setting a deadline that expired on Monday evening.

His remarks triggered threats of retaliation from Iran’s Revolutionary Guard, which said it would target power stations in Israel and those supplying US bases in the Gulf region if Trump carried out his threat to “destroy” Iran’s energy network.

The war has caused significant damage to key energy facilities in the Gulf and has led to a near halt in shipping through the Strait of Hormuz, which accounts for about 20% of global oil and liquefied natural gas flows.

Analysts estimated that oil production losses in the Middle East range between 7 million and 10 million barrels per day as a result of these disruptions.

Untitled

T-Mobile price tries to gather positive momentum

T-Mobile US (TMUS) stock price declined in its latest intraday trading, amid continued attempts by the stock to gain positive momentum that could help it recover and rise again, while a short-term corrective bullish wave remains dominant, supported by dynamic pressure from trading above its 50-day SMA. In addition, a positive divergence is beginning to form on the RSI after reaching extremely oversold levels compared to the price movement, with early positive signals starting to emerge.


Therefore we expect the stock price to rise during its upcoming trading sessions, as long as it remains stable above the support level at $209.40, targeting the key resistance level at $224.75 in preparation for a potential test.


Today’s price forecast: Bullish