fvg67

The Reason Many Traders miss this important details about FVGs

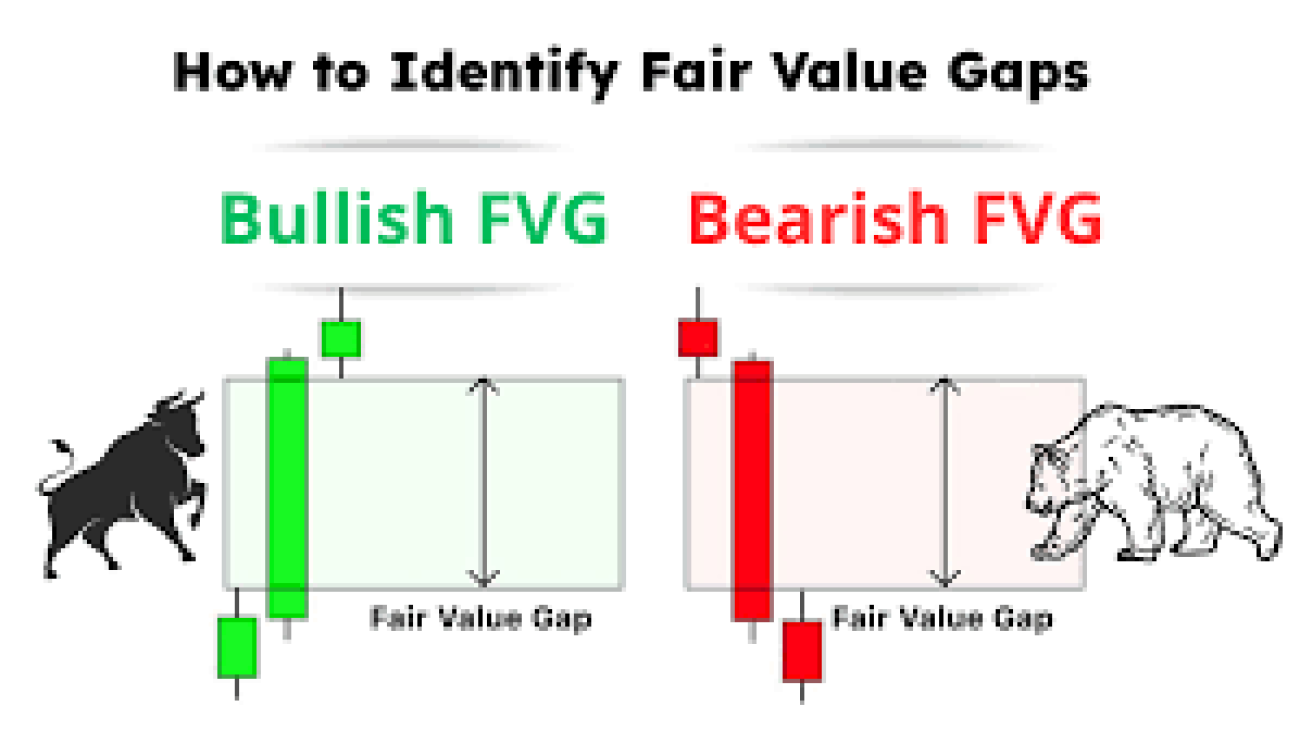
many traders see Fair Value Gaps (FVGs) on their charts but miss the deeper context that makes them high-probability setups.

Here are the important details most traders overlook:

 Not All FVGs Are Equal

Many traders treat every gap the same.

Key detail:
The quality of an FVG depends on:

  • Impulse strength (strong displacement = stronger FVG)

  • Volume / momentum

  • Break of structure (BOS) before the gap forms

 A weak, slow move that leaves a gap is far less reliable than a sharp institutional displacement.

Location Matters More Than the Gap Itself

An FVG in the middle of nowhere is low probability.

High-probability locations:

  • Premium/Discount zones

  • After liquidity sweeps

  • At key support/resistance

  • Inside higher-timeframe POIs (Order Blocks, Breaker Blocks)

 Think of FVG as a confirmation tool, not a standalone entry signal.

 Consequent Encroachment (CE) Is Often Ignored

Many traders enter at the edge of the gap.

But institutions often react at the 50% level of the FVG — called Consequent Encroachment.

Why it matters:

  • It’s the equilibrium price of the imbalance

  • Offers tighter risk entries

  • Higher RR setups

Mitigation vs. Continuation FVGs

Traders assume every FVG will cause a reversal.

Two types exist:

 Mitigation FVG

  • Price returns to fill inefficiency

  • Often leads to reversal

Continuation FVG

  • Forms during strong trend

  • Price respects it and continues

Misidentifying this is why traders get stopped out.

 Timeframe Alignment Is Critical

A 5-minute FVG against a 4-hour trend is weak.

High-probability trades occur when:

  • Lower-TF FVG aligns with Higher-TF bias

  • Example: Bullish H1 FVG + Bullish Daily structure

 Liquidity Sweep Before FVG = Institutional Intent

One of the most powerful confirmations:

  1. Liquidity gets swept (highs/lows taken)

  2. Strong displacement occurs

  3. FVG forms

This sequence shows:

  • Stop hunts completed

  • Smart money entering

  • True directional move beginning

Unfilled vs. Partially Filled FVGs

Not all gaps get fully filled.

Watch for:

  • Partial mitigation → Price reacts before full fill

  • Stacked FVGs → Multiple gaps create strong zones

Stacked imbalances often act like institutional supply/demand zones.

News & Session Timing

FVGs formed during:

  • London Open

  • New York Open

  • High-impact news

…tend to be more reliable due to institutional volume.

Asian-session gaps are often weaker.

Quick Checklist for High-Probability FVG Trades

Before entering, ask:

  • Was there a liquidity sweep?

  • Did displacement break structure?

  • Is it in premium/discount?

  • Does it align with HTF bias?

  • Is CE respected?

  • What session formed it?

If most answers = YES → Higher probability setup.
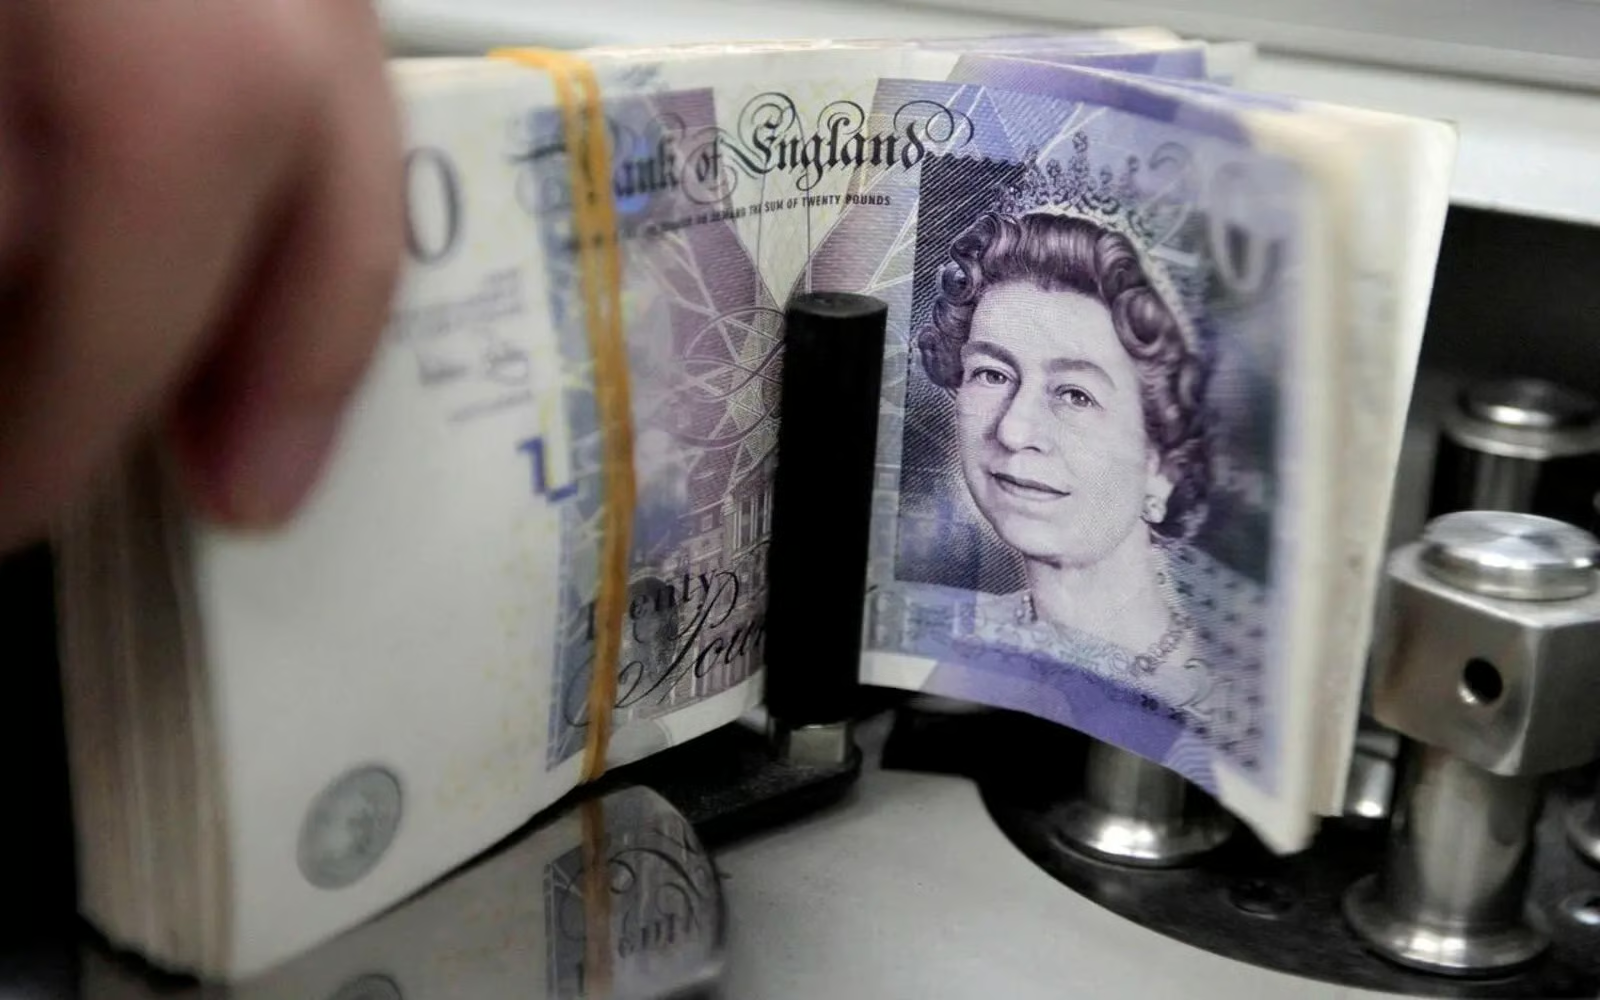
Sterling skids to four-week trough on UK rates

The British pound declined in European trading on Thursday against a basket of global currencies, extending its losses for a fourth consecutive session against the US dollar and hitting a four-week low. The move comes as investors continue to favor the US currency after the Federal Reserve meeting minutes showed that policymakers are not rushing toward interest rate cuts.

UK consumer price data showed continued easing in inflationary pressures on policymakers at the Bank of England, which increased expectations for a UK interest rate cut in March.

Price Overview

• British pound exchange rate today: The pound fell 0.1% against the dollar to $1.3480, the lowest level since January 22, from an opening level of $1.3494, recording a session high of $1.3502.

• The pound lost 0.55% against the dollar on Wednesday, marking its third consecutive daily loss, pressured by UK inflation data.

US Dollar

The dollar index rose 0.1% on Thursday, extending gains for a fourth straight session and reaching a two-week high at 97.78 points, reflecting continued strength of the US currency against a basket of global currencies.

Minutes from the latest Federal Reserve meeting, held on January 27–28, showed divisions among policymakers regarding the appropriate path for US interest rates. The minutes indicated that the incoming Fed chair, expected to take office in May, may face challenges in pushing through any rate cuts.

The minutes also showed that some members expect productivity gains to help ease inflationary pressures, while “most participants” warned that the path toward lower inflation may be slow and uneven. Some members even hinted at the possibility of raising interest rates again if inflation remains above target.

Following the minutes, and according to the CME FedWatch tool, market pricing for keeping US interest rates unchanged at the March meeting rose from 90% to 95%, while expectations for a 25-basis-point rate cut dropped from 10% to 5%.

UK Interest Rates

• Data released on Wednesday in the UK showed headline consumer inflation rising 3.0% in January, in line with market expectations, marking the lowest reading in the past ten months, down from 3.4% in December. Core inflation also eased to 3.1% from 3.2%.

• These figures indicate continued easing of inflationary pressures on policymakers at the Bank of England.

• Following the data, pricing for a 25-basis-point rate cut by the Bank of England in March increased from 85% to 90%.

usdjpy

The USDJPY extends its gains

The (USDJPY) kept rising in its last intraday trading, after surpassing the negative pressure of EMA50, dominated by minor strong bullish wave on short-term basis, on the other hand, we notice the emergence of negative overlapping signals from relative strength indicators, which might reduce the strong gains on near-term basis.

silver 3

Silver Price is showing clear negative signals

Silver prices (SILVER) declined in their last intraday trading, after testing minor bearish trend line on short-term basis, accompanied by reaching EMA50’s resistance, forming double technical barrier that turned the selling pressures back, this decline indicates the importance of technical levels, especially with the absence of momentum to breach and hold above it.


The negative overview is reinforced with the emergence of weakness signals from relative strength indicators, after recording negative divergence after reaching exaggerated overbought levels compared to the price, indicating the likelihood of the decline continuation on near-term basis, unless it surpassed these technical resistance levels and confirmed a positive price reversal

gbp

GBPUSD price breaks our expected target

GBPUSD kept declining in its last intraday trading, to break 1.3510 support in its last intraday trading, this support represents an expected target in our previous analysis, amid the continuation of the negative pressure due to its trading below EMA50, reinforcing the stability and dominance of the bearish corrective trend on short-term basis, with its trading alongside supportive trend line for this path, besides the emergence of negative signals from relative strength indicators, despite reaching oversold levels.

images

EURUSD price settles after reaching our expected target

The (EURUSD) price settles near its lowest intraday trading, after a series of consecutive losses that led it to approach the expected target that we mentioned in our previous reports, to begin cautious attempts to offload its oversold conditions on relative strength indicators, especially with the emergence of positive overlapping signals that indicates the likelihoods of limited technical rebound on short-term basis.


Despite these corrective attempts, the price remains under clear negative pressure due to its stability below EMA50, reinforcing the continuation of the dominant bearish corrective trend on short-term basis, especially with its trading alongside supportive trend line for this path.


images

Crude oil prices reach our expected target

Crude oil prices settle near their highest intraday levels, keeping strong gains after its stability at the previously expected target at $65.35 key resistance, the price is attempting to take a breather to gain the required bullish momentum to breach this key resistance and holding above, opening the way for a new bullish wave.


The price is attempting to offload some of the overbought conditions on relative strength indicators, especially with the emergence of negative overlapping signals that might indicate temporary slow momentum, but the continuation of the main bullish trend dominance on short-term basis, besides the dynamic support that is represented by the trading above EMA50 reinforced the chances of resuming the bullish trend and extending its gains.

gold

Gold prices show clear negative signals

Gold prices declined in their recent trading on the intraday basis, after reaching EMA50’s resistance, to suffer renewed selling pressures that limited the recovery attempts, accompanied by forming negative divergence on relative strength indicators, after reaching severe overbought levels compared to the price move, with the emergence of negative signals from there.


Amid the continuation of the bearish corrective trend dominance on short-term basis, the technical outlook prefers more pressure unless surpassing the EMA50 and holding above it, trading below this key level supports the bearish scenario and keeps the possibilities of targeting lower levels in the upcoming period.

mmmm

How To Trade A Breaker Block

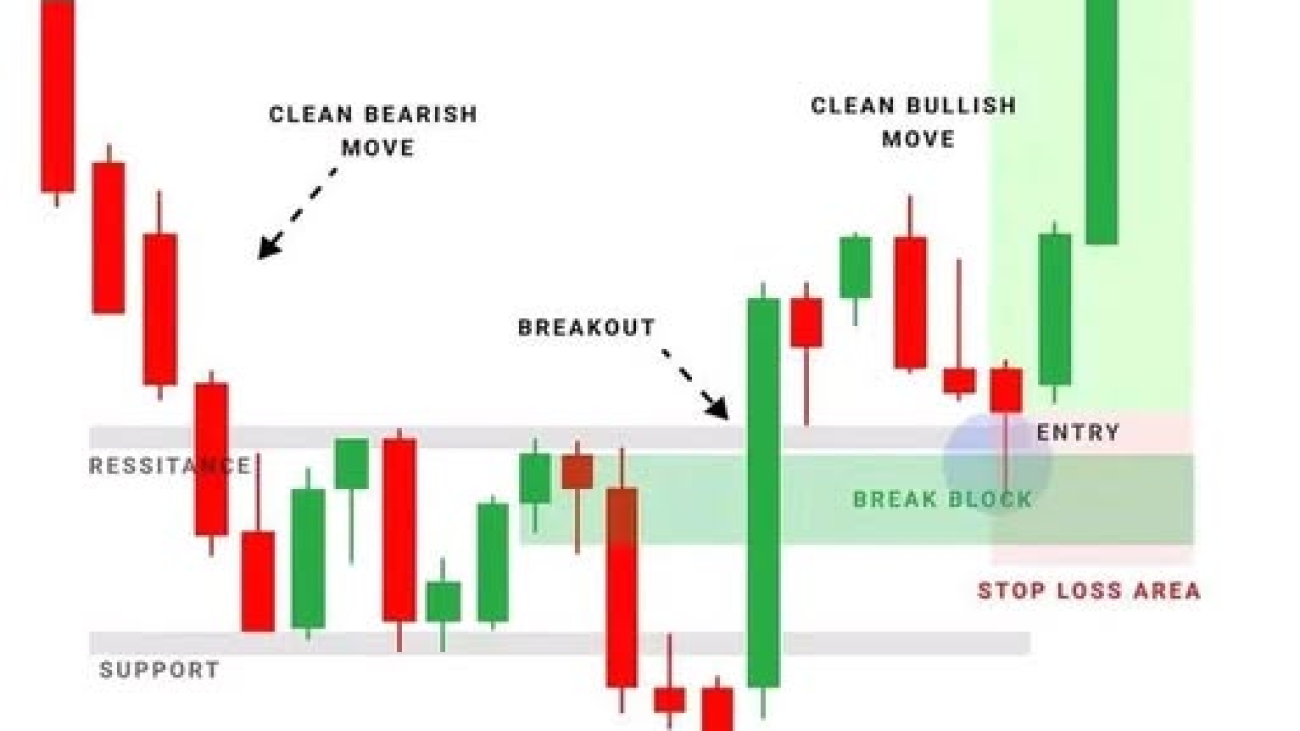
Trading a Breaker Block is an advanced Smart Money Concept (SMC) strategy. It forms when an Order Block fails and price breaks through it — then uses that same zone as support or resistance.

Think of it as a role-reversal institutional zone.

What Is a Breaker Block?

A Breaker Block is:

A former Order Block that gets violated (broken) and then becomes a new reaction zone.

  • Bullish OB broken → becomes Bearish Breaker

  • Bearish OB broken → becomes Bullish Breaker

It shows where smart money trapped traders and flipped direction.

 How To Identify a Breaker Block

 Find a Valid Order Block First

Look for:

  • Last bullish candle before a strong bearish move (Bearish OB)

  • Last bearish candle before a strong bullish move (Bullish OB)

  • Must cause displacement / BOS

Watch for Failure of That OB

A breaker only forms when the OB fails.

Signs of failure:

  • Price closes beyond the OB

  • Liquidity sweep happens first

  • Structure shifts against the OB direction

This traps traders who entered at the OB.

Confirm Break of Structure (BOS)

Structure must break in the new direction.

Example:

  • Bearish OB fails

  • Price breaks prior high Bullish BOS confirms Bullish Breaker

No BOS = no valid breaker.

Mark the Breaker Zone

Mark:

  • The body of the failed OB candle

  • Or full wick-to-body range (advanced traders refine)

This becomes your reaction zone for entry.

 How To Trade a Breaker Block

 Bullish Breaker Trade (Buy Setup)

Step-by-step:

  1. Bearish Order Block forms

  2. Price breaks above it (failure)

  3. Bullish BOS occurs

  4. Price retraces back to the failed OB

  5. Enter buy at breaker zone

Targets:

  • Equal highs

  • Liquidity pools

  • Premium zones

Stop loss:

  • Below breaker low

 Bearish Breaker Trade (Sell Setup)

  1. Bullish Order Block forms

  2. Price breaks below it

  3. Bearish BOS occurs

  4. Price retraces to the failed OB

  5. Enter sell at breaker zone

Targets:

  • Equal lows

  • Sell-side liquidity

Stop loss:

  • Above breaker high

 Entry Confirmation Techniques

Refine entries using:

  • Lower timeframe BOS

  • Fair Value Gap (FVG) inside breaker

  • Liquidity sweep before entry

  • Rejection candles

Aggressive entry → at zone touch
Conservative entry → after LTF structure shift

 Breaker Block vs Order Block

Feature Order Block Breaker Block
Status Valid Failed OB
Direction Original trend Opposite trend
Entry style Reversal Continuation / flip
Reliability High Very high with BOS

 Common Mistakes

❌ Trading breaker without BOS
❌ Marking random candles as OB
❌ Ignoring liquidity sweep
❌ Entering without displacement

 Pro Trading Tips

  • Best breakers form after liquidity sweeps

  • Strongest on HTF (H1–Daily)

  • Combine with Premium/Discount zones

  • London & NY sessions give cleaner reactions

mun

Gold tries to recover before Fed’s minutes

Gold prices rose in European trading on Wednesday for the first time in three sessions, as part of a rebound attempt from a two-week low, supported by buying activity at corrective levels. Those recovery attempts are being capped by the rise of the US dollar in the foreign exchange market.

With the probability of a US interest rate cut in March receding, global money markets are awaiting later today the release of the minutes of the Federal Reserve’s latest meeting, which are expected to contain strong clues about the path of US monetary policy this year.

Price Overview

• Gold prices today: Gold rose by 1.3% to $4,942.30, from an opening level of $4,878.63, and recorded a session low at $4,854.25.

• At Tuesday’s settlement, gold prices fell by about 2.3%, marking the second consecutive daily loss, and hit a two-week low at $4,841.43 per ounce, due to slower safe-haven demand amid positive political developments, in addition to upward pressure from the stronger US dollar.

US Dollar

The dollar index rose by 0.2% on Wednesday, extending gains for the third straight session, and trading near its highest level in about two weeks, reflecting continued strength in the US currency against a basket of major and minor currencies.

As is known, a stronger US dollar makes dollar-denominated gold bullion less attractive to buyers holding other currencies.

This advance comes as investors focus on buying the dollar as one of the best available opportunities in the FX market, especially with rising expectations that US interest rates will remain unchanged through the first half of this year.

US Interest Rates

• Chicago Federal Reserve President Austan Goolsbee said on Friday that interest rates may decline, but noted that inflation in the services sector remains elevated.

• Goolsbee said on Tuesday that the Federal Reserve could approve “several” additional rate cuts this year if inflation resumes its decline toward the central bank’s 2% target.

• According to the CME FedWatch tool, pricing for keeping US interest rates unchanged at the March meeting is steady at 90%, while the probability of a 25 basis point rate cut is priced at 10%.

• To reprice those probabilities, investors are awaiting later today the release of the minutes of the Federal Reserve’s latest monetary policy meeting.

Gold Performance Outlook

Senior analyst at Reliance Securities, Jigar Trivedi, said that overall gold prices are expected to range between $4,700 and $5,100 throughout the year.

SPDR Fund

Holdings of the SPDR Gold Trust, the largest gold-backed ETF in the world, fell on Tuesday by about 1.43 metric tons, bringing the total down to 1,075.61 metric tons, the lowest level since January 15.