Untitled

According to the daily chart, the bullish outlook of EUR/USD remains intact, characterized by the price holding above the key 100-day Exponential Moving Average (EMA). The upward momentum is supported by the 14-day Relative Strength Index (RSI), which stands above the midline near 57.25, suggesting the path of least resistance is to the upside. The immediate resistance level emerges at 1.1445, the upper boundary of the Bollinger Band. Further north, the next hurdle is located at 1.1574, the high of April 21, followed by the 1.1600 psychological mark. The low of May 28 at 1.1283 acts as an initial support level for a major pair. The next downside target to watch is 1.1110, the lower limit of the Bollinger Band. A breach of this level could see a drop to the key contention level at 1.1000, representing the round figure and the 100-day EMA.

Gold price (XAU/USD) builds on its intraday positive move and advances to over a one-week high, around the $3,359 area during the first half of the European session on Monday. Concerns about the worsening US fiscal situation, along with the growing acceptance that the Federal Reserve (Fed) will lower borrowing costs again in 2025, drag the US Dollar (USD) back closer to the monthly low. This, in turn, is seen as a key factor acting as a tailwind for the non-yielding yellow metal.

Meanwhile, investors remain on edge amid persistent trade-related uncertainties and rising geopolitical tensions. This is evident from a generally weaker tone around the equity markets and contributes to driving flows toward the safe-haven Gold price. Apart from this, the momentum could further be attributed to some technical buying above the $3,325-3,326 barrier, which seems to have set the stage for further gains. Traders now look to the US ISM Manufacturing PMI for a fresh impetus.

Gold price seems poised to appreciate further and aim towards reclaiming the $3,400 round-figure mark
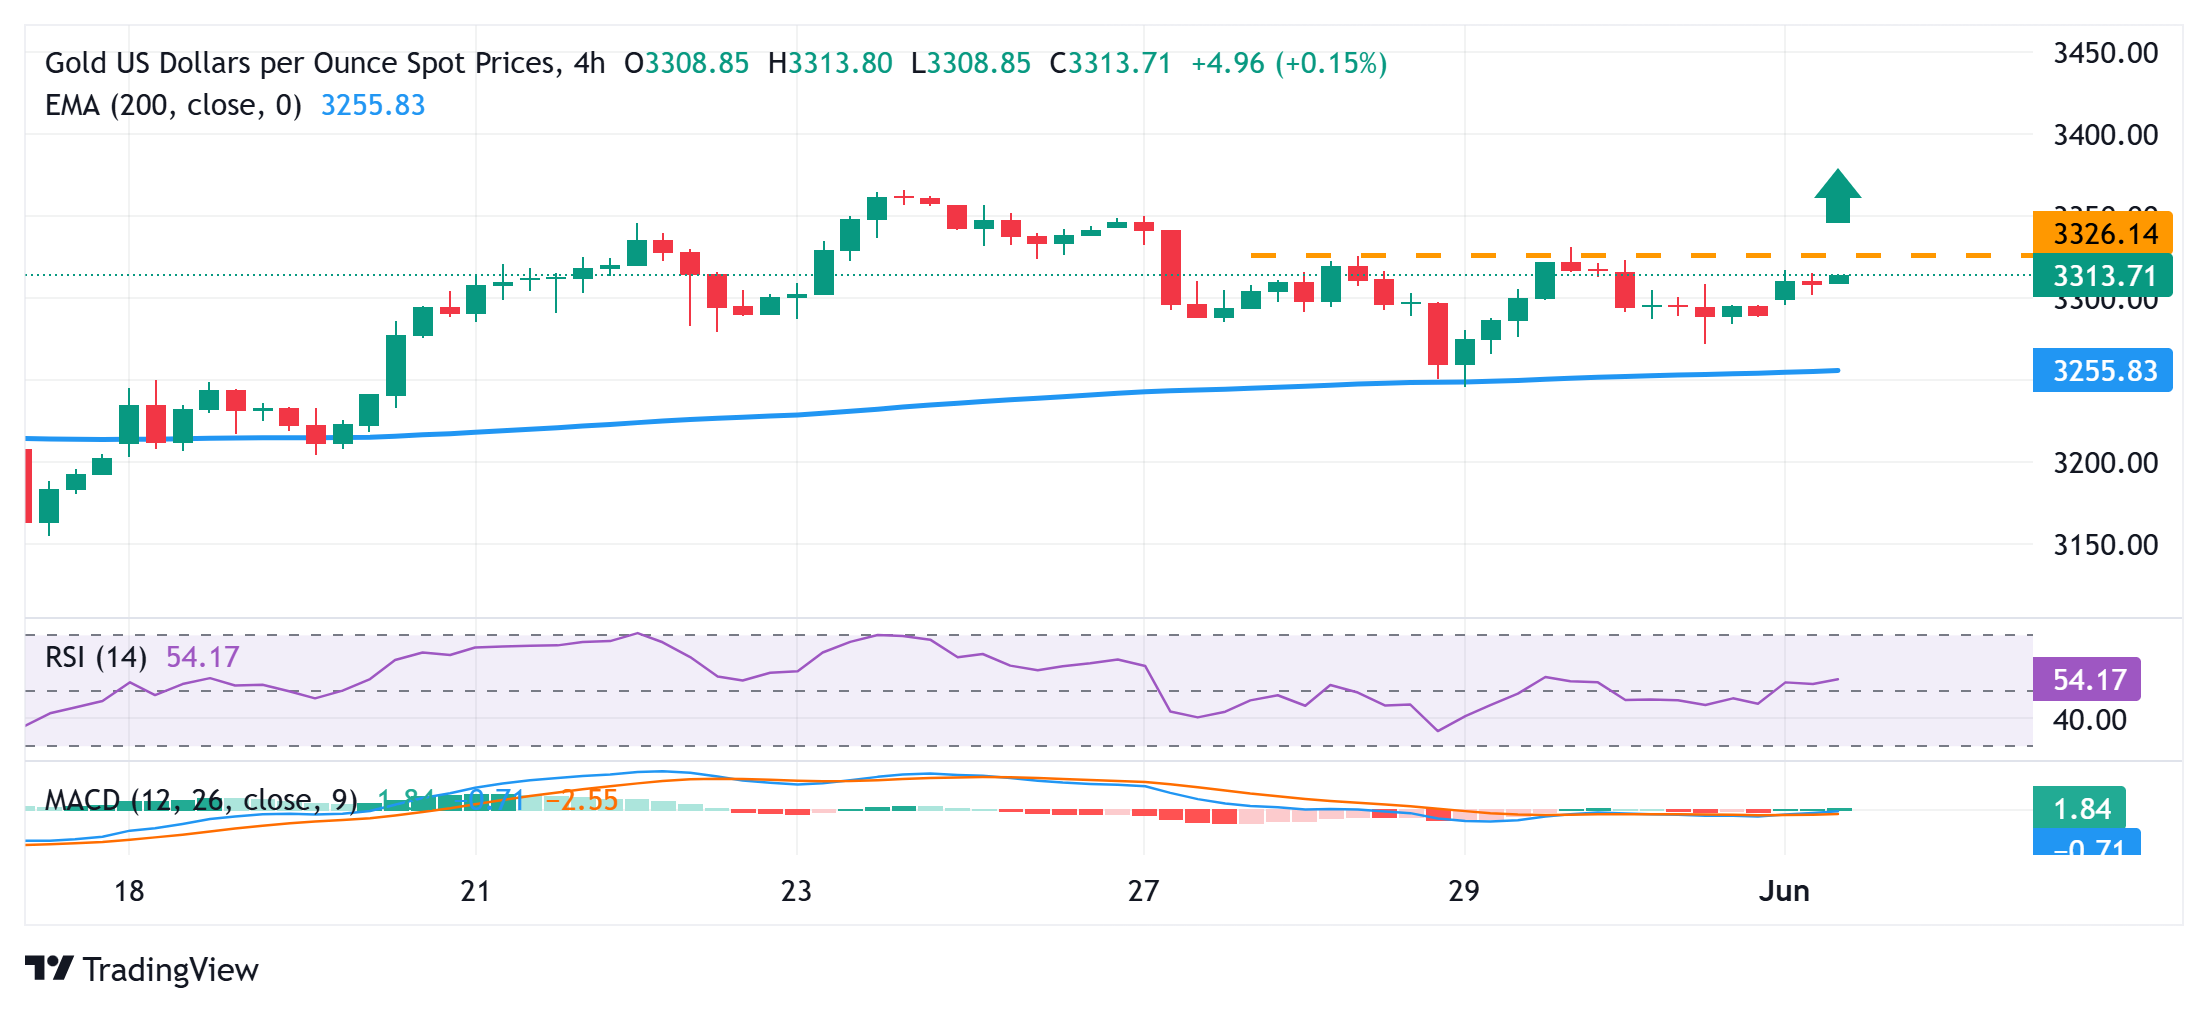
From a technical perspective, a sustained strength beyond the $3,326-3,328 supply zone could be seen as a fresh trigger for the XAU/USD bulls against the backdrop of last week’s bounce from the 200-period Exponential Moving Average (EMA) pivotal support on the 4-hour chart, The subsequent move up beyond the $3,345-3,350 intermediate resistance might now allow the Gold price to reclaim the $3,400 mark. The momentum could extend further towards the next relevant barrier near the $3,432-3,434 region.

On the flip side, weakness below the $3,300 round figure could find some support near the $3,280-3,278 zone. Any further slide could be seen as a buying opportunity and remain limited near the $3,258-3,257 region. The latter represents the 200-period EMA on the 4-hour chart, which if broken decisively could make the Gold price vulnerable to accelerate the fall further towards the $3,200 mark.

mmm

EUR/USD climbs above 1.1400 on renewed USD weakness

EUR/USD starts the month of June on a bullish note and trades above 1.1400. The broad-based US Dollar weakness on re-escalating US-China trade tensions allows the pair to push higher as market focus shifts to the May ISM Manufacturing PMI data for May.

According to the daily chart, the bullish outlook of EUR/USD remains intact, characterized by the price holding above the key 100-day Exponential Moving Average (EMA). The upward momentum is supported by the 14-day Relative Strength Index (RSI), which stands above the midline near 57.25, suggesting the path of least resistance is to the upside.

The immediate resistance level emerges at 1.1445, the upper boundary of the Bollinger Band. Further north, the next hurdle is located at 1.1574, the high of April 21, followed by the 1.1600 psychological mark.

The low of May 28 at 1.1283 acts as an initial support level for a major pair. The next downside target to watch is 1.1110, the lower limit of the Bollinger Band. A breach of this level could see a drop to the key contention level at 1.1000, representing the round figure and the 100-day EMA.

Untitled

DXY: Trump tariffs challenged – OCBC

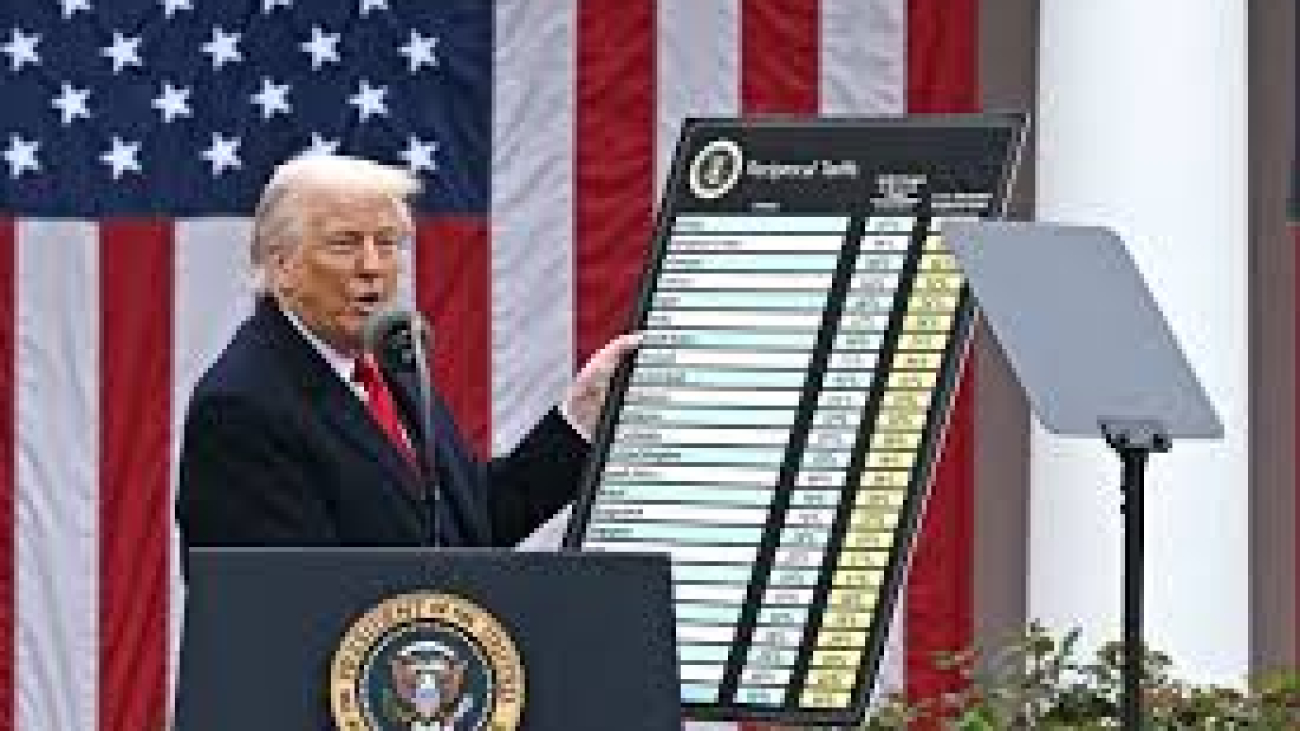
US Dollar’s (USD’s) rebound found momentum from a US court ruling, saying that Trump’s unilateral imposition of ‘Liberation Day tariffs’ under the International Emergency Economic Powers Act (IEEPA) is invalid. DXY was last at 99.93 levels, OCBC’s FX analysts Frances Cheung and Christopher Wong note.

2-way trades still likely in the near term

“The ruling also blocks the enforcement of fentanyl-related tariffs on China, Mexico, and Canada that were announced earlier this year. In response, the Trump administration had filed a notice that it was appealing the ruling, and ultimately the US Supreme Court may have the final say. The court ruling helps to restore some credibility to the system which has been undermined by the unpredictability of Trump’s tariffs. ”

“The check and balance system is at least intact for now, providing a knee-jerk rebound for the USD while US futures jumped over 1%. Adding to FX market volatility was BoK Governor Rhee’s comments that Asian nations had currency talks with the US. This headline saw some knee-jerk reaction, slowing USD’s advance against Asian FX. Nevertheless, Rhee’s comments alongside, uncertainty over the legitimacy of Trump’s tariffs may continue to see more 2-way price action in the USD ahead of core PCE data (Friday).”

“Daily momentum is not showing a clear bias while RSI rose. 2-way trades still likely in the near term. Resistance at 100.80/101 levels (50 DMA, 23.6% fibo retracement of 2025 peak to trough). Support at 99.2 and 97.90 (2025 low).”

Untitled

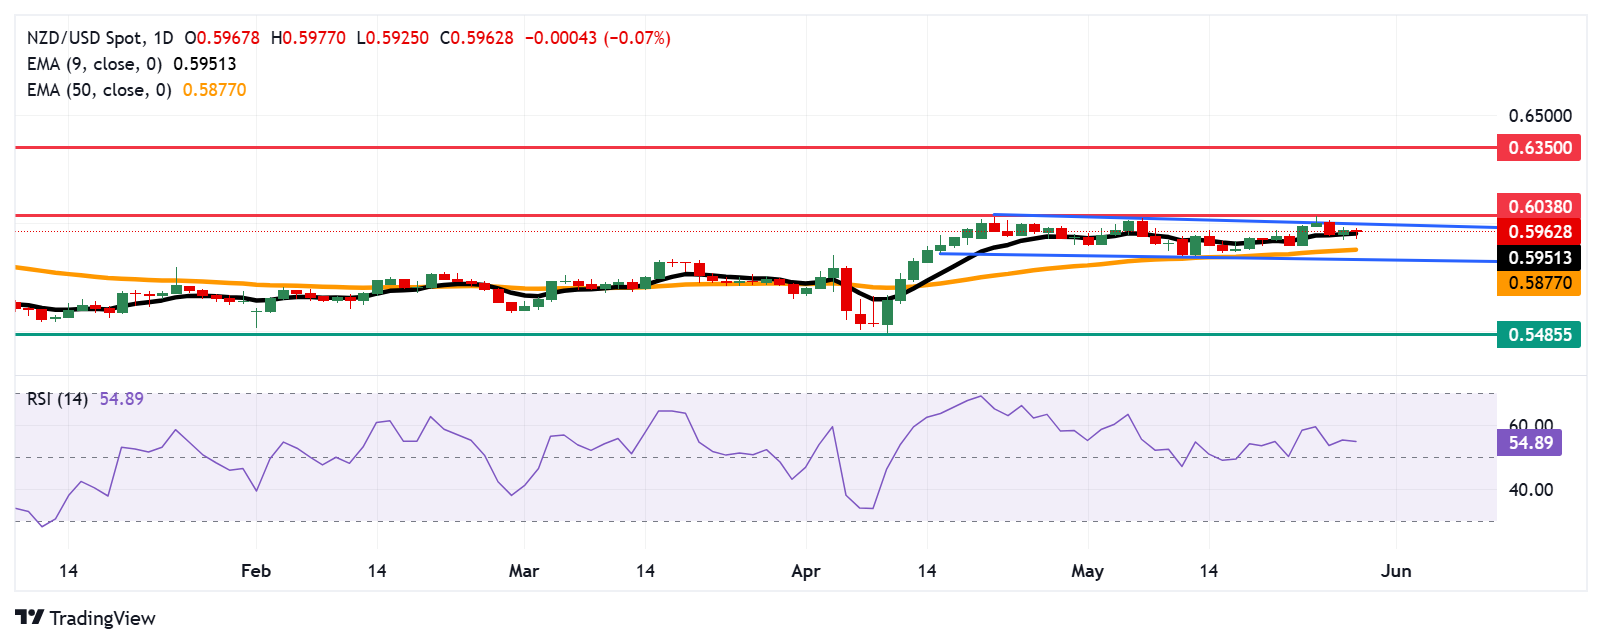
NZD/USD Price Forecast: Finds support at 0.5950 near nine-day EMA

NZD/USD is trading around 0.5960 during the European hours on Thursday. The pair has trimmed its daily losses as a market bias remains neutral. As indicating by the technical analysis of the daily chart, the pair is consolidating within a rectangular pattern and hovering around a nine-day Exponential Moving Average (EMA).

However, the bullish bias is likely to emerge as the 14-day Relative Strength Index (RSI) is maintaining its position slightly above the 50 mark. This suggests that NZD/USD pair continues to attract buying interest.

On the upside, the NZD/USD pair may target the upper boundary of the consolidation range near 0.6000, followed by the next target at the six-month high of 0.6038, last reached in November 2024. A successful breach above this key resistance zone could support the bullish bias to develop and open the doors for the pair to explore the region around the seven-month high of 0.6350, marked in October 2024.

The NZD/USD pair could find the initial support at the nine-day EMA of 0.5951, followed by the 50-day EMA at 0.5877. A break below these levels could weaken the short- and medium-term price momentum and prompt the pair to break below the rectangle’s lower boundary around 0.5830. Further decline beneath this crucial support zone could cause the emergence of the bearish bias and pave the way for a deeper decline toward 0.5485, a level not seen since March 2020.

NZD/USD: Daily Chart

Untitled

EUR: A leg to the downside – ING

EUR/USD is understandably lower on the US tariff news in that it slightly re-appraises US growth prospects and the risk premium attached to the US Dollar (USD), ING’s FX analyst Chris Turner notes.

EUR/USD may start to reconnect with the interest rate differential

“Is the rules-based order winning out after all? A slight narrowing in the US risk premium on this news could see EUR/USD start to reconnect a little with the interest rate differential story. Here, the two-year EUR:USD swap differential is quite wide at 180bp – levels which last year prompted EUR/USD to trade down at 1.06.”

“We think global asset managers did have a shock in April and are seriously looking at their dollar hedge ratios. But the newsflow is mildly supportive for the dollar and there is a scenario where EUR/USD can make it back to the 1.1050 area – consistent with our baseline views for this year that EUR/USD traces out a 1.10-1.15 range.”

Untitled

EUR/USD must first close below 1.1200 to continue falling

Further weakness is not ruled out; it is unclear whether Euro (EUR) can break and hold below 1.1200 against US Dollar (USD). In the longer run, to continue to decline, EUR must first close below 1.1200, UOB Group’s FX analysts Quek Ser Leang and Peter Chia note.

Further weakness is not ruled out

24-HOUR VIEW: “EUR dropped to 1.1321 two days ago. In the early Asian session yesterday, when EUR was at 1.1335, we highlighted that ‘despite declining, EUR has not gained much momentum.’ We expected EUR to ‘consolidate between 1.1305 and 1.1375.’ However, instead of consolidating, EUR edged down to close at 1.1292 (-0.32%). In the early Asian session today, EUR plunged (the low so far appears to be 1.1209). Further weakness is not ruled, but the sharp drop seems excessive, and it is unclear whether EUR can break and hold below 1.1200. For now, the major support at 1.1140 is unlikely to come under threat. On the upside, resistance levels are at 1.1275 and 1.1300.”

1-3 WEEKS VIEW: “We revised our EUR view from positive to neutral yesterday (28 May, spot at 1.1335), indicating that ‘upward momentum has mostly dissipated.’ We also indicated that EUR ‘is likely to trade in a 1.1255/1.1420 range for now.’ Although our revision was timely, we did not expect EUR to drop below 1.1255 early today. To continue to decline, EUR must first close below 1.1200. The risk of EUR closing below 1.1200 will remain intact provided that the ‘strong resistance’ level, currently at 1.1355 is not breached. Looking ahead, below 1.1200, there is a significant support level at 1.1140 (the current level of the 55-day EMA indicated in the 1-3 months view below).”

Untitled

Gold price stalls intraday recovery amid positive risk tone; remains below $3,300 ahead of US data

Gold price (XAU/USD) struggles to capitalize on its intraday recovery from over a one-week low and remains below the $3,300 mark through the first half of the European session on Thursday, still in the red for the fourth straight day. The global risk sentiment gets a strong boost in reaction to a federal court ruling against US President Donald Trump’s ‘liberation day’ trade tariffs. This continues to act as a headwind for the safe-haven bullion on the back of Wednesday’s hawkish FOMC Minutes.

Investors, however, are still pricing in the possibility that the Federal Reserve (Fed) will cut interest rates further in 2025. Apart from this, worries about the worsening US fiscal condition prompt some intraday US Dollar (USD) selling, which, in turn, should act as a tailwind for the non-yielding Gold price. Apart from this, persistent geopolitical risks might further hold back the XAU/USD bears from placing aggressive bets and warrant some caution before positioning for deeper losses ahead of US data.

Gold price remains vulnerable while below the $3,300 mark, 200-period SMA pivotal support on H4

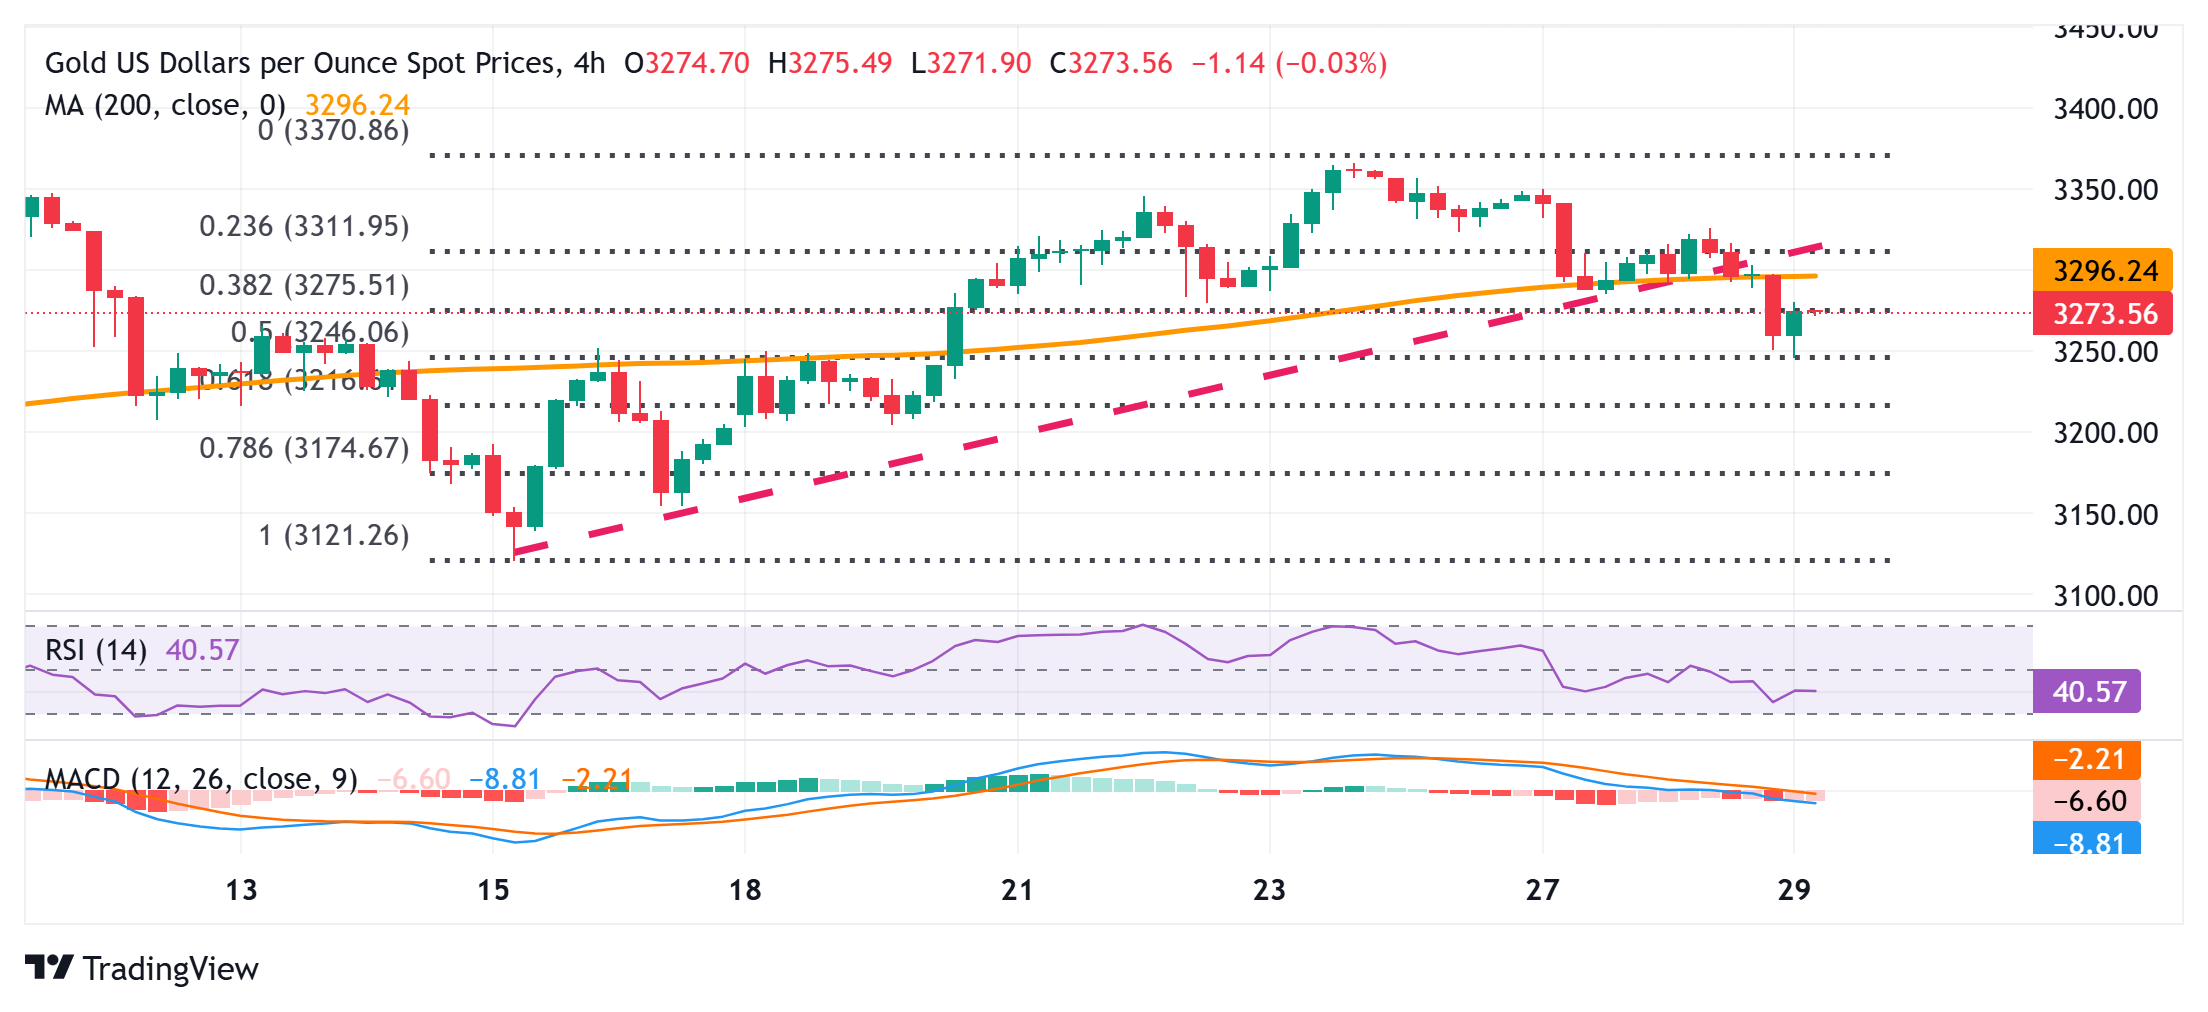
From a technical perspective, the intraday downfall stalls near the 50% retracement level of the recent goodish recovery from the monthly swing low. However, Wednesday’s breakdown below a short-term ascending trend line and the 200-period Simple Moving Average (SMA) on the 4-hour chart favor bearish traders. Adding to this, negative oscillators on the said timeframe suggest that the path of least resistance for the Gold price is to the downside.

Hence, any subsequent recovery is more likely to confront a stiff barrier and remain capped ahead of the $3,300 mark, or the 200-period SMA on the 4-hour chart. However, some follow-through buying, leading to a further move beyond the 23.6% Fibonacci retracement level, might trigger a short-covering rally and lift the Gold rice to the $3,324-3,325 hurdle en route to the next relevant resistance near the $3,345-3,350 supply zone.

On the flip side, bearish traders might now wait for sustained weakness below the Asian session low, around the $3,246-3,245 region (50% retracement level), before placing fresh bets. The subsequent fall might then drag the Gold price to the 61.8% Fibo. retracement level, around the $3,215 region. The downward trajectory could extend towards the $3,200 round figure before the XAU/USD eventually drops to the $3,180 support.

Untitled

EUR/USD: Interim downside pressure – OCBC

Euro (EUR) continued to drift lower amid broad US Dollar (USD) rebound. Pair was last at 1.1250 levels, OCBC’s FX analysts Frances Cheung and Christopher Wong note.

Alternative reserve currencies including the EUR may benefit

“Daily momentum is not showing a clear bias now while RSI fell. On price action, rising wedge pattern is playing out — typically associated with a bearish reversal. Support at 1.1235 (23.6% fibo retracement of 2025 low to high) and 1.1180 (50 DMA). Resistance at 1.1420/30 levels.”

“A potential deal between EU-US may lead to EUR backing off from its recent highs in the near term. But more importantly, if the ‘sell USD’ trade remains alive amid diversification flows, alternative reserve currencies including the EUR may benefit.”

Untitled

EUR/USD holds losses near 1.1250 on firmer US Dollar

EUR/USD consolidates losses near 1.1250 in early Europe on Thursday. The pair bears the brunt of the renewed US Dollar demand, spurred by a US court’s ruling to block Trump’s reciprocal tariffs and cautious Fed Minutes. The focus now remains on the mid-tier US data and Fedspeak for further impetus.

The Relative Strength Index (RSI) indicator on the 4-hour chart stays slightly above 40 after recovering from near-30, suggesting that the bearish bias remains intact.

EUR/USD faces a pivot level at 1.1270, where the 100-period Simple Moving Average (SMA) and the Fibonacci 38.2% retracement of the latest uptrend align. In case the pair fails to stabilize above this level, technical sellers could remain interested. In this scenario, 1.1180 (Fibonacci 50% retracement) could be seen as the next support level before 1.1080 (Fibonacci 61.8% retracement).

On the upside, 1.1315 (200-period SMA) could be seen as the next resistance level ahead of 1.1380 (Fibonacci 23.6% retracement) and 1.1430 (static level).

EUR/USD came under renewed selling pressure and dropped to its weakest level in over a week near 1.1200 in the Asian session on Thursday. Although the pair erased a large portion of its daily losses, it could have a difficult time extending its rebound in the second half of the day.

The US Dollar (USD) gathered strength in the late American session on Wednesday and continued to outperform its rivals early Thursday on easing fears over United States (US) President Donald Trump’s trade policy causing an economic downturn.

The Court of International Trade announced late Wednesday that President Trump’s reciprocal tariffs will be blocked from going into effect, explaining that Trump overstepped his authority by imposing across-the-board duties on imports from the US’ trading partners, per Reuters. The USD Index, which tracks the USD’s valuation against a basket of six major currencies, shot higher with the immediate reaction to this development. Meanwhile, US stock index futures gathered bullish momentum and were last seen rising between 1.4% and 2.1%.

The US Bureau of Economic Analysis will release its second estimate of the annualized Gross Domestic Product (GDP) growth for the first quarter later in the day. A positive revision to the initial estimate, which showed a contraction of 0.3%, could help the USD hold its ground and cause EUR/USD to turn south. Additionally, weekly Initial Jobless Claims will be featured in the US economic calendar.

In case Wall Street’s main indexes rally after the opening bell on improving sentiment around the US economic outlook, investors are likely to refrain from betting on an extended rebound in EUR/USD.

China-US trade talks: The art of the deal – Standard Chartered

China-US trade talks: The art of the deal – Standard Chartered

Our baseline scenario is that US tariffs on China will likely stay around current levels after the 90-day truce. The tit-for-tat tariff war in April and subsequent truce indicate more caution on both sides. Even in case of aggressive tariff re-escalation, exemptions will likely be considered to mitigate business impact, Standard Chartered’s economists note.

What can we expect at the end of the 90-day truce?

“The trade trajectory following the end of the US-China 90-day tariff truce remains uncertain. Our baseline assumption is that the truce will likely be extended further and that average tariff levels may remain around current rates (see Figure 1). This approach would allow the continued flow of bilateral trade between the two nations and buy more time for negotiations on more complex and contentious issues.”

“We believe the worst of tariff headlines is behind us, and our baseline assumes limited room for further tariff hikes from current levels in 2025. The tit-for-tat trade war in April and subsequent sharp reduction in bilateral tariffs in May indicate more caution on future tariff action from both the US and China. In addition, there are plenty of unresolved issues on the table, including existing bilateral tariffs, non-tariff barriers, and the exchange rate. Furthermore, the US may be prioritising negotiations with other trade partners, with the 90-day tariff pause on other countries ending one month earlier than with China. Taking all of these factors into consideration, 90 days are likely not enough for the two countries to conclude a comprehensive deal; we, therefore, expect the tariff truce to be extended to allow for continued negotiations.”

“With our baseline assumption on tariffs, we maintain our 2025 GDP growth forecast at 4.8%. China’s existing stimulus package is likely to largely offset the tariff impact. However, if the US hikes tariffs much higher than our baseline assumption, imposes other significant non-tariff measures against China, or if China’s housing market and consumption recovery falls short of expectations, additional fiscal support will likely be rolled out to prevent GDP growth from undershooting the growth target significantly.”