Japanese Yen retreats slightly after BoJ Governor Ueda’s comments; bullish bias remains

Japanese Yen retreats slightly after BoJ Governor Ueda’s comments; bullish bias remains

The Japanese Yen (JPY) trims a part of strong intraday gains following the Bank of Japan (BoJ) Governor Kazuo Ueda’s opening remarks during the post-meeting press conference, lifting the USD/JPY pair back closer to mid-155.00s in the last hour. Any meaningful JPY pullback, however, seems elusive in the wake of the BoJ’s hawkish rate hike earlier this Friday. Moreover, hopes that spring wage negotiations will result in strong hikes again this year, and allow the BoJ to tighten its policy further, should continue to underpin the JPY.

In contrast, the markets have been pricing in the possibility that the Federal Reserve (Fed) will lower borrowing costs and the bets were lifted by US President Donald Trump’s call for lower interest rates. This, in turn, triggers a fresh leg down in the US Treasury bond yields, which, along with the BoJ’s hawkish outlook, support prospects for the narrowing of the US-Japan yield differential and should support the lower-yielding JPY. Apart from this, some follow-through US Dollar (USD) selling should cap the upside for the USD/JPY pair.

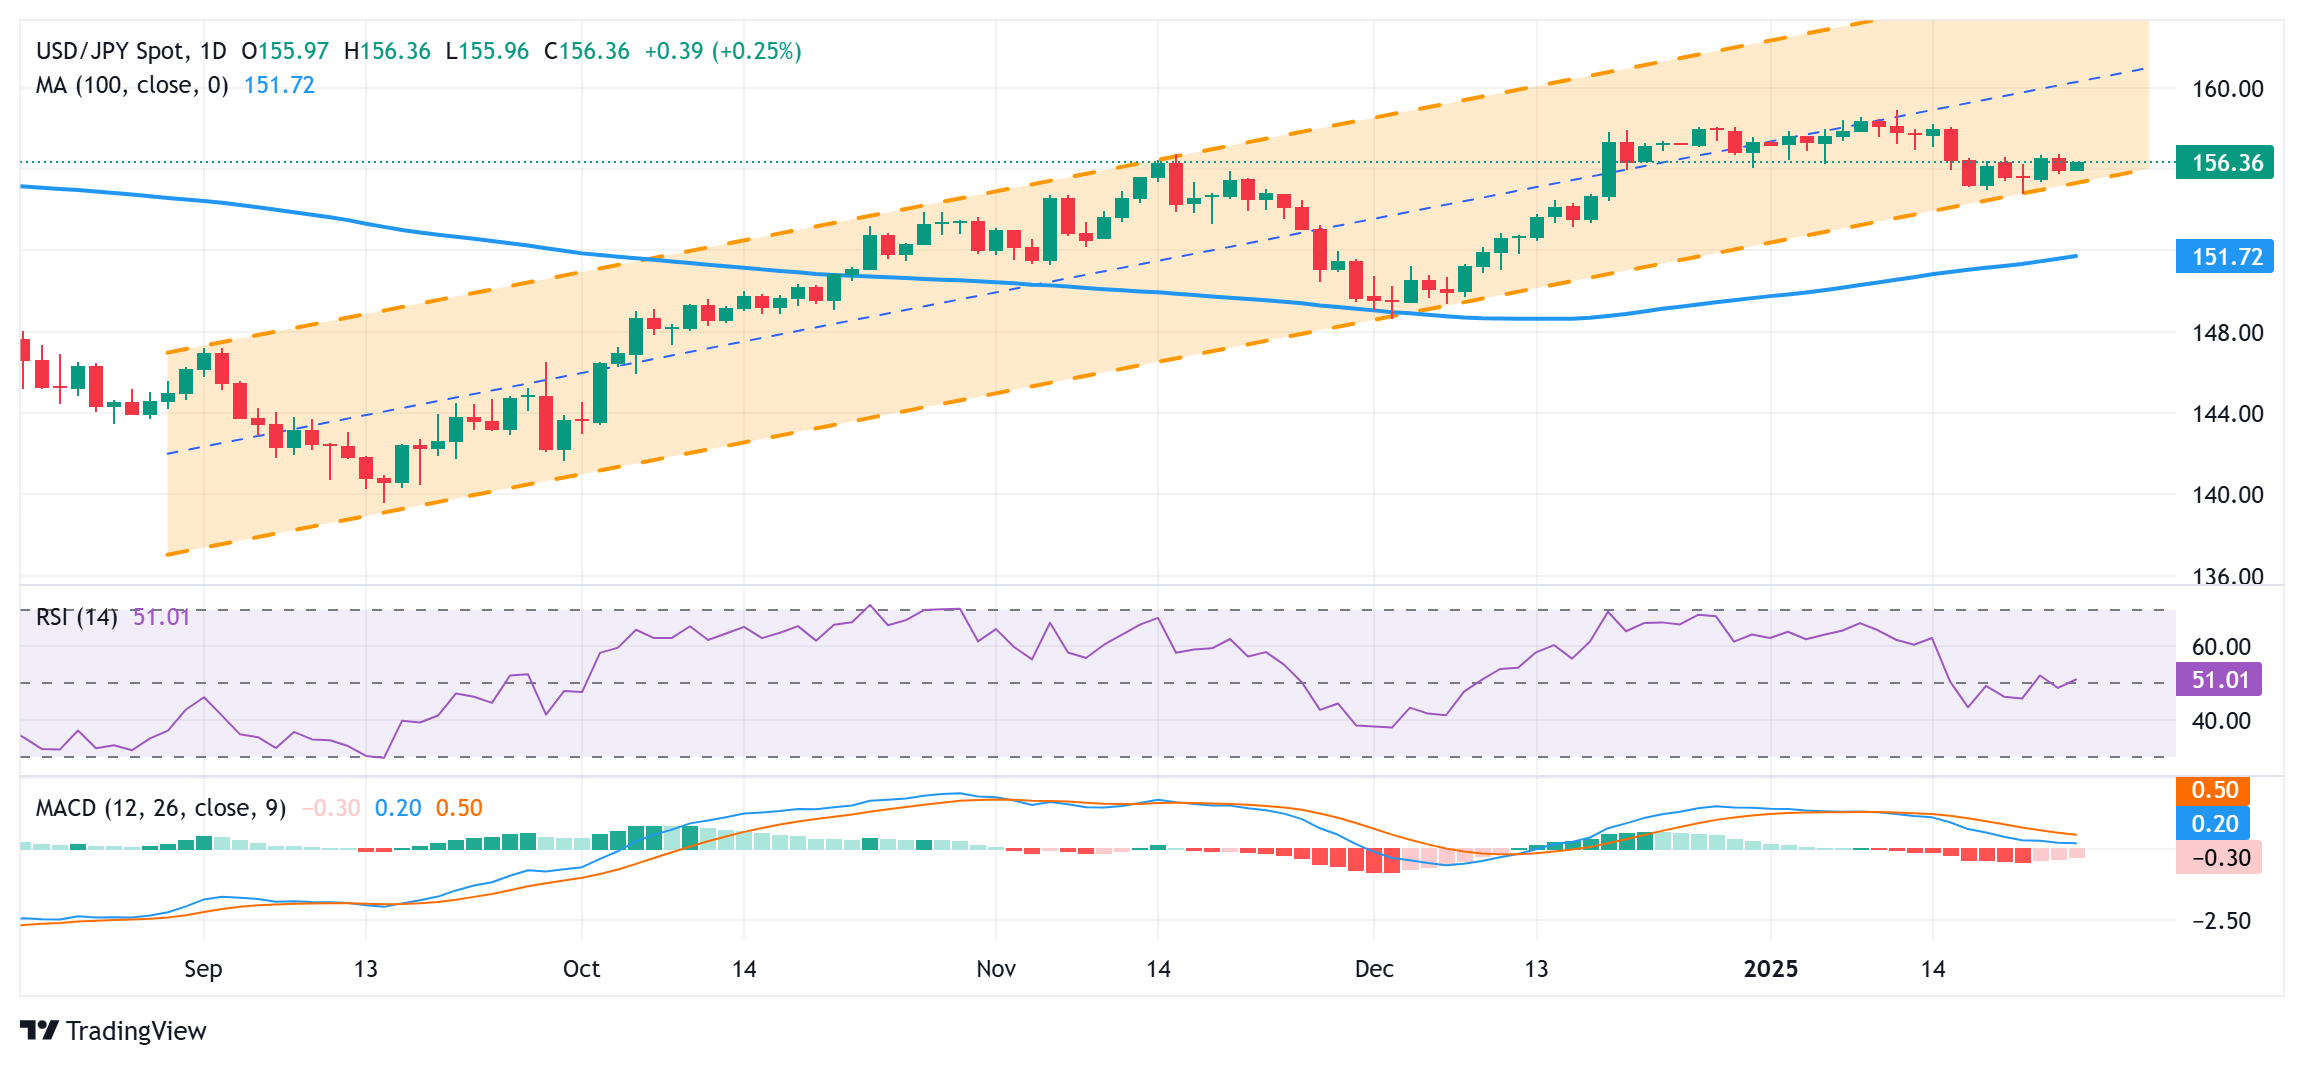
USD/JPY could accelerate the fall one the 155.00 mark is broken decisively
fxsoriginal

From a technical perspective, the USD/JPY pair, so far, has managed to defend support marked by the lower end of a multi-month-old ascending channel, currently pegged near the 155.35 area. This is closely followed by the 155.00 psychological mark and the 154.80-154.75 region, or over a one-month low touched on Tuesday. Some follow-through selling below the latter will be seen as a fresh trigger for bearish traders and drag spot prices to the 154.00 round figure en route to the mid-153.00s and the 153.00 mark.

On the flip side, the overnight swing high, around the 156.75 area, could offer some resistance ahead of the 157.00 round figure. A sustained strength beyond the latter should pave the way for a further move up towards the 157.55 area en route to the 158.00 mark. The momentum could extend further towards the 158.35-158.40 region, above which the USD/JPY pair could retest the multi-month peak, around the 159.00 neighborhood touched on January 10.
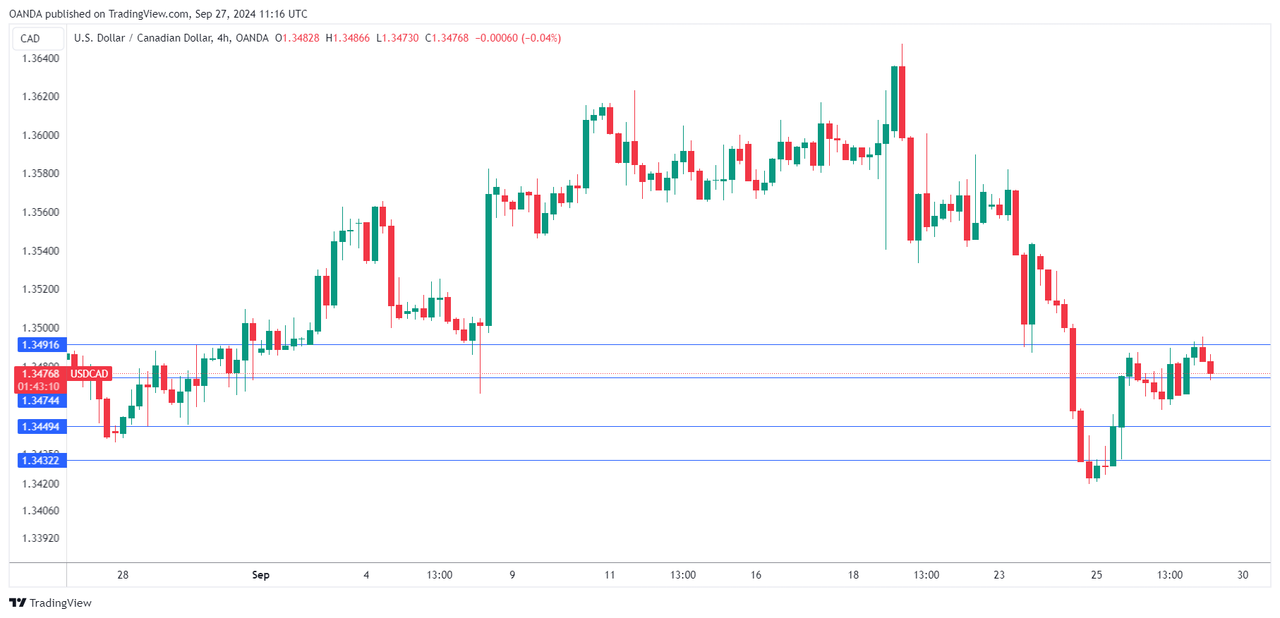

USD/CAD moves below 1.4350 as Trump asks Fed to cut interest rates

USD/CAD moves below 1.4350 as Trump asks Fed to cut interest rates

USD/CAD extends its losses for the second consecutive day, trading around 1.4330 during the early European hours on Friday. This downside of the USD/CAD pair is attributed to the weaker US Dollar amid risk-on sentiment following recent remarks from US President Donald Trump late Thursday.

Trump said he wants the US Federal Reserve (Fed) to cut interest rates immediately. “With oil prices going down, I’ll demand that interest rates drop immediately, and likewise they should be dropping all over the world,” said Trump at the World Economic Forum in Davos, Switzerland.

The US Dollar Index (DXY), which measures the US Dollar’s performance against six major currencies, continues to decline as US Treasury yields lose ground following Trump’s comments. The DXY has fallen below 107.00, with the 2-year and 10-year US Treasury yields standing at 4.26% and 4.63%, respectively, at the time of writing.

Traders will likely monitor the release of the preliminary US S&P Global Purchasing Managers Index (PMI) and the Michigan Consumer Sentiment Index for January.

The commodity-linked Canadian Dollar (CAD) receives upward support from improved crude Oil prices. West Texas Intermediate (WTI) Oil price halts its six-day losing streak, trading around $74.50 per barrel at the time of writing.

However, crude Oil prices are headed for a weekly decline after US President Donald Trump issued a sweeping plan to boost US production and demanded OPEC (Organization of the Petroleum Exporting Countries) lower crude prices.

EUR/USD tests 1.0450 on the road to recovery, PMIs eyed

EUR/USD tests 1.0450 on the road to recovery, PMIs eyed

EUR/USD holds higher ground near 1.0450 in the early European session on Friday, bolstered by renewed US Dollar weakness. The preliminary reading of the HCOB Purchasing Managers Index for January from the Eurozone and Germany now remains in focus.

The Relative Strength Index (RSI) indicator on the 4-hour chart rises toward 70, suggesting that EUR/USD has more room on the upside before turning technically overbought in the near term.

On the upside, 1.0500-1.0510 (round level, Fibonacci 78.6% retracement of the latest uptrend) aligns as next resistance before 1.0540 (static level) and 1.0600 (beginning point of the downtrend).

In case EUR/USD retreats below 1.0440 (Fibonacci 61.8% retracement, 50-day SMA) and starts using this level as resistance, buyers could be discouraged. In this scenario, 1.0400-1.0390 (Fibonacci 50% retracement, 200-period SMA) and 1.0350 (Fibonacci 38.2% retracement) could be seen as next support levels.

Following Thursday’s indecisive action, EUR/USD gathered bullish momentum and touched its highest level since December 18 at 1.0470 in the early European session on Friday. Although the pair retreated to the 1.0450 area, the technical outlook suggests that the bullish bias remains intact.

In the early trading hours of the Asian session on Friday, US President Donald Trump said in an interview that he would rather not have to use tariffs on China. This comment allowed market mood to improve and made it difficult for the US Dollar (USD) to find demand.

While speaking at the World Economic Forum late Thursday, however, Trump said that he will do something about the trade deficit with the EU, adding that EU tariffs were making it very difficult for them to bring products into Europe. In case Trump hints at ramping up tariffs on European imports, the Euro could struggle to preserve its strength.

On Friday, preliminary January HCOB Manufacturing and Services PMI report for Germany and the Eurozone will be watched closely by market participants. The market reaction to these data is likely to be straightforward, with better-than-expected prints supporting the Euro and vice versa.

In the second half of the day, S&P Global PMI data will be featured in the US economic calendar. In case the Composite PMI unexpectedly drops below 50 and points to a contraction in the private sector’s economic activity, the USD could come under renewed selling pressure heading into the weekend.

Australian Dollar depreciates as US Dollar remains stable due to hawkish Fed

Australian Dollar depreciates as US Dollar remains stable due to hawkish Fed

The Australian Dollar (AUD) struggles against the US Dollar (USD) on Thursday. However, market concerns eased following news that the China-specific tariffs proposed under US President Donald Trump’s revised plan are significantly smaller than initially expected. This development helped calm investors’ nerves, especially given the strong trade ties between China and Australia, which make Australian markets sensitive to changes in China’s economic landscape.

President Trump announced plans to implement a 10% tariff on Chinese imports starting February 1, citing concerns over fentanyl shipments from China to Mexico and Canada, according to Reuters. In response, Chinese Vice Premier Ding Xuexiang warned on Tuesday about the potential trade war fallout, stating that “there are no winners” in such conflicts. His remarks come as China braces for possible tariffs under the Trump administration, as reported by CNBC.

Chinese authorities on Thursday introduced several measures to stabilize its stock markets, including allowing pension funds to increase investments in domestic equities. A pilot scheme enabling insurers to purchase equities will be launched in the first half of 2025, with an initial scale of at least 100 billion Yuan. Meanwhile, the People’s Bank of China (PBoC) said that they “will expand the scope and increase the scale of liquidity tools to fund share purchases at the proper time.”

The S&P/ASX 200 Index fell below 8,400 on Thursday, driven primarily by a decline in mining stocks as weaker commodity prices weighed on the sector. This decline in the Australian equity market occurred despite strong gains on Wall Street. Investors remain cautious as they assess the implications of President Trump’s policy changes.

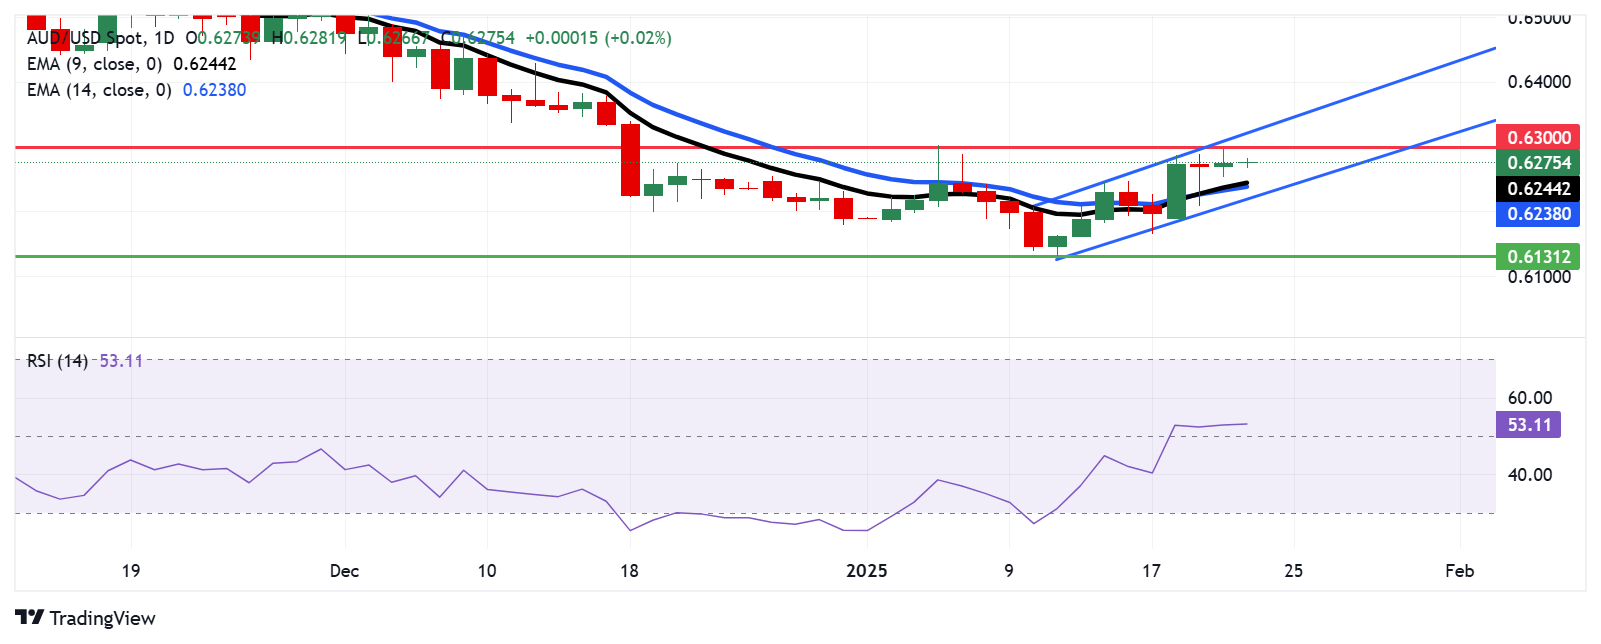
Technical Analysis: Australian Dollar remains below 0.6300 and ascending channel’s upper boundary

The AUD/USD pair trades near 0.6270 on Thursday, with a daily chart analysis indicating movement within an ascending channel pattern, suggesting a potential bullish bias. Additionally, the 14-day Relative Strength Index (RSI) is slightly above 50, reinforcing positive market sentiment.

On the upside, the AUD/USD pair could test the psychological resistance level at 0.6300, with the next target near the upper boundary of the ascending channel around 0.6320.

The initial support appears at the nine-day Exponential Moving Average (EMA) at 0.6244, followed by the 14-day EMA at 0.6238. Stronger support is seen at the ascending channel’s lower boundary around 0.6220, with further support at the psychological level of 0.6200.

AUD/USD: Daily Chart

China’s Commerce Ministry: Willing to work with US to promote stable development of trade ties

China’s Commerce Ministry: Willing to work with US to promote stable development of trade ties

China’s Commerce Ministry said in a statement on Thursday that they are “willing to work with the US to promote stable and healthy development of economic and trade ties.”

“Tariff measures are not good for China, US, and the rest of the world,” the Ministry said.

These comments came as they responded to US President Donald Trump’s 10% tariff threat on Chinese imports.

Market reaction

AUD/USD remains depressed at around 0.6270 following these comments, down 0.08% on the day.

gold-bar-and-dollar-bills-42586628_XtraLarge

Gold price sticks to negative bias, remains close to multi-month peak set on Wednesday

Gold price (XAU/USD) remains depressed through the first half of the European session on Thursday and for now, seems to have snapped a three-day winning streak to its highest level since early November touched the previous day. The US Dollar (USD) gains some positive traction for the second straight day and recovers further from the monthly low. This, along with a stable performance around the equity markets, turn out to be key factors undermining the safe-haven precious metal.

That said, bets that the Federal Reserve (Fed) will cut rates twice this year keep a lid on the US Treasury bond yields, which, in turn, should cap the USD and offer some support to the non-yielding Gold price. Furthermore, uncertainty over US President Donald Trump’s trade policies, which could trigger trade wars and elevate market volatility, should help limit losses for the XAU/USD. This warrants caution before confirming that the one-month-old uptrend has run out of steam.

Gold price retains negative bias amid modest USD strength; downside remains cushioned

  • The US Dollar holds steady above its lowest level since late December touched on Wednesday amid a modest rebound in the US Treasury bond yields and prompts some selling around the Gold price on Thursday.
  • The lack of details about US President Donald Trump’s tariff plans and easing geopolitical tensions remain supportive of the risk-on mood, which is seen as another factor undermining the safe-haven precious metal.
  • Trump’s proposed policies are broadly regarded as inflationary, which, in turn, might compel the Federal Reserve to stick to its hawkish stance and keep interest rates higher for longer to rein in rising price pressures.
  • Investors, however, are still pricing in the possibility that the US central bank will lower borrowing costs at least two times by the end of this year. This might cap the upside for the US bond yields and the Greenback.
  • Trump’s speech at the World Economic Forum will be looked upon for more concrete announcements on tariffs. Apart from this, the release of the US Weekly Jobless Claims should provide some impetus to the XAU/USD.
  • The Bank of Japan is scheduled to announce its decision at the end of a two-day policy meeting on Friday and is expected to raise interest rates from 0.25% to 0.50%, or the highest since the 2008 global financial crisis.
  • Rate decisions from the Fed and European Central Bank are scheduled for Wednesday and Thursday next week, respectively, which could infuse volatility and provide some impetus to the non-yielding yellow metal.

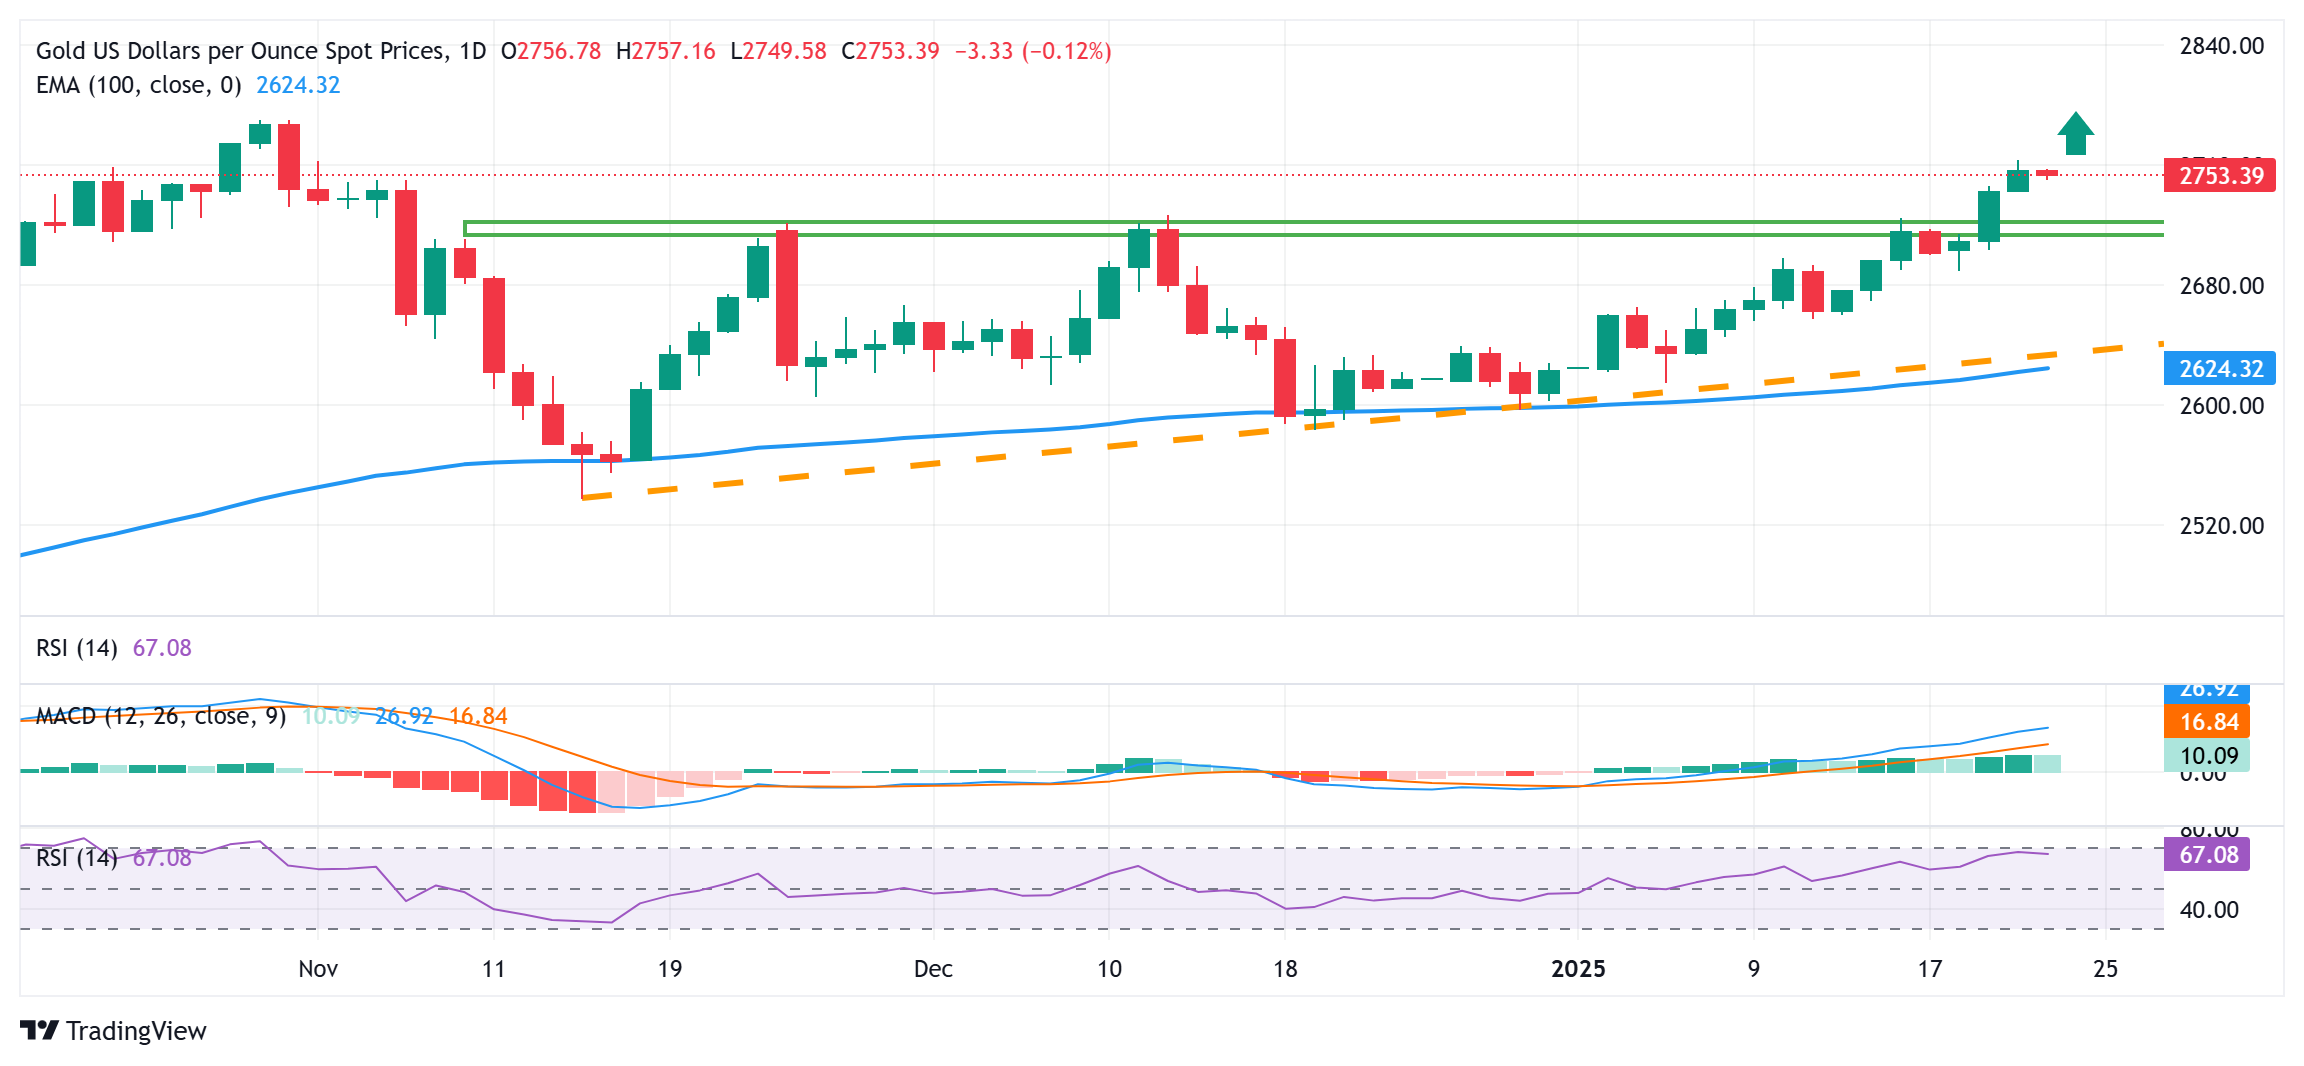
Gold price bulls have the upper hand while above the $2,720-2,25 resistance breakpoint

fxsoriginal

From a technical perspective, any subsequent slide is more likely to find decent support near the $2,625-2,620 strong horizontal resistance breakpoint, now turned support. Some follow-through selling could drag the Gold price to the $2,700 mark, which if broken decisively should pave the way for deeper losses. The XAU/USD might then fall towards the $2,665-2,662 area en route to the 2,627-2,622 confluence. The latter comprises the 100-day Exponential Moving Average (EMA) and a short-term ascending trend line, which, in turn, should act as a key pivotal point for short-term traders.

On the flip side, the overnight swing high, around the $2,763-2,764 area, now seems to offer some resistance, above which the Gold price could aim to challenge the all-time peak, around the $2,790 region touched in October. This is closely followed by the $2,800 mark, which if conquered will be seen as a fresh trigger for bullish trades and set the stage for an extension of the recent well-established uptrend witnessed over the past month or so.

china-768x576

EUR/USD: To trade in range between 1.0380 and 1.0440

Euro (EUR) is likely to trade in range between 1.0380 and 1.0440. In the longer run, current price action is part of a recovery phase that could extend to 1.0480, UOB Group’s FX analysts Quek Ser Leang and Lee Sue Ann note.

Current price action is part of a recovery phase

24-HOUR VIEW: “Following Tuesday’s price movements, we noted yesterday that ‘there has been no further increase in momentum.’ We were of the view that EUR ‘is likely to trade in a range, probably between 1.0345 and 1.0440.’ However, EUR rose to 1.0457, pulling back swiftly to close at 1.0407 (-0.21%). The price action did not result in any increase in either downward or update momentum. Today, we continue to expect EUR to trade in a range, most likely between 1.0380 and 1.0440.”

1-3 WEEKS VIEW: “We turned positive in EUR two days ago (21 Jan, spot at 1.0415), indicating that ‘the current price action is part of a recovery phase that could extend to 1.0480.’ Yesterday, EUR rose briefly to a three-week high of 1.0457 before pulling back. While there has been no further increase in momentum, we will maintain our view as long as 1.0340 (‘strong support’ level was at 1.0320 yesterday) is intact.”

NZD/USD drops to near 0.5650 as US Dollar appreciates ahead of Initial Jobless Claims

NZD/USD drops to near 0.5650 as US Dollar appreciates ahead of Initial Jobless Claims

NZD/USD continues to remain subdued for the third consecutive session, trading around 0.5660 during the European hours on Thursday. The pair’s downside is attributed to the stronger US Dollar (USD) amid hawkish sentiment surrounding the US Federal Reserve’s (Fed) policy stance.

According to the CME FedWatch tool, traders are confident that the Fed will keep its key borrowing rates in the range of 4.25%-4.50% in the upcoming three policy meetings. Moreover, US President Donald Trump’s policies could drive inflationary pressures, potentially limiting the Fed to just one more rate cut in 2025.

eur6

EUR/USD hovers near 1.0400 as focus shifts to US data

EUR/USD trades listlessly near 1.0400 in the European session on Thursday. The pair stays defensive as US President Trump has threatened to impose tariffs on the Eurozone. Further, ECB rate cut expectations also weigh on the major alongside fresh US Dollar demand ahead of US data.

The Relative Strength Index (RSI) indicator retreated below 60 on Thursday, pointing to a loss of bullish momentum. Nevertheless, while EUR/USD holds above 1.0390, where the 200-period Simple Moving Average (SMA) meets the Fibonacci 50% retracement of the latest downtrend, technical sellers could refrain from betting on an extended slide.

On the upside, 1.0440 (Fibonacci 61.8% retracement, 50-day SMA) aligns as strong resistance before 1.0500 (round level, Fibonacci 78.6% retracement). In case 1.0390 level fails, 1.0350 (Fibonacci 38.2% retracement) and 1.0320 (100-period SMA) could be seen as next support levels

EUR/USD climbed to its highest level in over a month above 1.0450 in the early American session on Wednesday but struggled to preserve its bullish momentum. After closing the day marginally lower, the pair trades in a tight channel near 1.0400 in the European morning on Thursday.

In the absence of high-tier data releases, the upbeat market sentiment helped EUR/USD hold its ground midweek. Rising US Treasury bond yields, however, supported the US Dollar and capped the pair’s upside.

Later in the day, the US Department of Labor will release the weekly Initial Jobless Claims data. Markets expect the number of first-time applications for unemployment benefits to rise to 220,000 from 217,000 in the previous week. A reading below 210,000 could help the USD stay resilient against its rivals and cause EUR/USD to stretch lower. On the flip side, a print of 230,000 or higher could trigger a USD selloff and boost the pair in the second half of the day.

During the American trading hours, the European Commission will publish the preliminary Eurozone Consumer Confidence data for January, which is forecast to edge higher to -14.2 from -14.5 in December.

trading-plan_body_Actionplantradingplan-Copy

GBP/USD: Resistance at 1.2410 is probably out of reach today

Pound Sterling (GBP) is expected to continue to advance; the significant resistance at 1.2410 is probably out of reach today. In the longer run, GBP view is positive, anticipating a move to 1.2410, UOB Group’s FX analysts Quek Ser Leang and Lee Sue Ann note.

GBP view is positive

24-HOUR VIEW: “Our view for GBP to ‘trade with a downward bias’ yesterday was incorrect. GBP surged, blowing past several resistance levels with ease (high has been 1.2344). Although we expect GBP to continue to advance today, the significant resistance at 1.2410 is probably out of reach today. Note that there is another resistance level at 1.2380. On the downside, any pullback is likely to remain above 1.2240.”

1-3 WEEKS VIEW: “Yesterday (20 Jan, spot at 1.2170), we highlighted, “there has been a tentative buildup in momentum, but GBP must break clearly below 1.2100/1.2130 support zone before further weakness can be expected.” The tentative buildup in momentum fizzled out quickly, as GBP surged above our ‘strong resistance’ level at 1.2305. From here, we are revising our view for GBP to positive, anticipating a move to 1.2410. We will maintain our view as long as the ‘strong support’ level, currently at 1.2210, is not breached. The ‘strong support’ level is set to move higher in the coming days.”

Share: Share on WhatsApp