More Pain Ahead for Crude Oil? Is the Rebound Over in Natural Gas?

More Pain Ahead for Crude Oil? Is the Rebound Over in Natural Gas?

Natural gas: Is the rebound over?

The chances are growing that the five-month-long recovery is over. Natural gas’ fall in mid-August below 2.57 was a warning sign that the rebound is running out of steam – a risk pointed out in the previous update. See “How Much More to Go in Crude Oil? Is There More Upside in Natural Gas?”, published August 11.

This follows a failure to cross above the crucial hurdle at 3.00-3.05 (including the March high and the 30-week moving average). As the previous update highlighted, the two steps forward one step back nature of price action characterizes the recovery as corrective, rather than the start of a new uptrend. Natural gas is testing a vital horizontal floor at about 2.45-2.50. Any break below the support would confirm that the upward pressure had dissipated, potentially opening the door toward the May low of around 2.00.

Natural Gas Weekly Chart

image1.png

Zooming out, the failure of natural gas to witness a meaningful upward momentum in recent months is a sign that the broader downtrend is intact. The possibility of natural gas bottoming was first highlighted in early 2023 – see “Natural Gas Price Action Setup: Is the Slide Overdone?”, published February 21, and subsequently “Natural Gas Week Ahead: Base Building May Have Started”, published May 22, and “Natural Gas Price Rebound Could Extend; What’s Next For Crude Oil?”, published May 18.

Natural Gas Daily Chart

image2.png

However, the inability in recent weeks to rise toward the 200-day moving average is another sign of underlying weakness. Given the deep losses since last year, natural gas may need to undergo a prolonged period of base building before a sustainable uptrend emerges.

Crude Oil: More pain ahead?

The rise toward the April high of 83.50, a cross above the Ichimoku cloud on the daily charts, and the clearance above the 89-day moving average are signs that crude oil is beginning to flex muscles after months of subdued price action.

Crude Oil Daily Chart

image3.png

Most recently, crude oil has succumbed to vital resistance at 83.50 – a risk highlighted in theprevious update. Nevertheless, the nascent bullish trend since the end of June doesn’t appear to be over just yet. Crude oil would need to fall below the lower edge of the Ichimoku cloud on the daily chart for the short-term bullish bias to fade. Until then, the path of least resistance remains sideways to up.

Crude Oil Weekly Chart

image4.png

In recent months, crude oil has found strong support on the 200-week moving average. See “Crude Oil Extends Slide in Asia: Is This Capitulation?”, published May 4. Any break above 83.50 could pave the way toward the October high of 93.00, near the upper edge of the Ichimoku cloud on the weekly charts at about 95.00. The 93.00-95.00 region needs to be cleared to put crude oil back on the appreciation path.

NASDAQ 100, Dow Jones, S&P 500 News: Market Eyes Fed After Positive Week Start

NASDAQ 100, Dow Jones, S&P 500 News: Market Eyes Fed After Positive Week Start

US Stock Futures Point Higher as August Draws to a Close

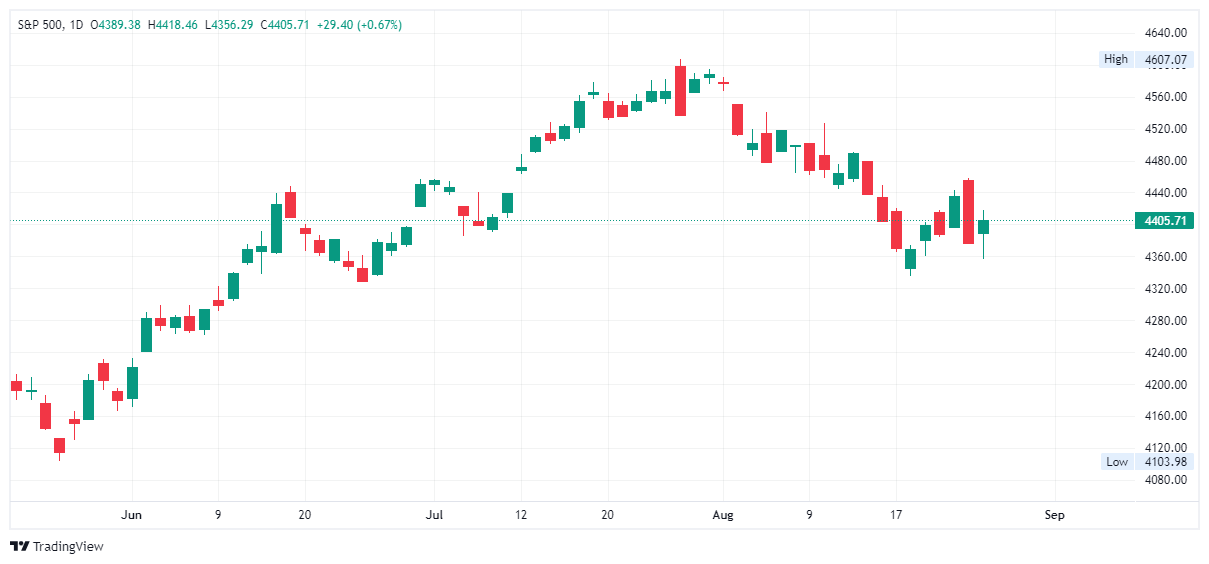
Stock futures in the United States have started on a modestly optimistic note for the final trading week of August. Dow Jones Industrial Average futures rose by roughly 0.25%, alongside gains in S&P 500 and Nasdaq-100 futures, which increased by 0.21% and 0.31%, respectively. This uptick follows Jerome Powell’s latest remarks which set the stage for the Federal Reserve’s future monetary policy.


S&P 500, Nasdaq Composite, Dow Jones


Powell’s Cautious Optimism Drives Market Sentiment

Federal Reserve Chair Jerome Powell’s speech at the annual central bank conference in Jackson Hole, Wyoming, had Wall Street glued. He acknowledged signs of economic growth and robust consumer spending but emphasized a careful approach to further interest rate hikes. The stance maintains that the Fed would keep policy “restrictive” until inflation trends back to target levels. Market participants have priced in a 20% probability of another rate hike in the Fed’s upcoming September meeting.

Trading Derivatives carries a high level of risk to your capital and you should only trade with money you can afford to lose. Trading Derivatives may not be suitable for all investors, so please ensure that you fully understand the risks involved, and seek independent advice if necessary. A Product Disclosure Statement (PDS) can be obtained either from this website or on request from our offices and should be considered before entering into a transaction with us. Raw Spread accounts offer spreads from 0.0 pips with a commission charge of USD $3.50 per 100k traded. Standard account offer spreads from 1 pips with no additional commission charges. Spreads on CFD indices start at 0.4 points. The information on this site is not directed at residents in any country or jurisdiction where such distribution or use would be contrary to local law or regulation.

Indices Wrap-up: A Mixed Bag

Despite Powell’s positive remarks, U.S. stock indices are poised to end August in the red. The Dow and S&P 500 have declined by 3.4% and 4%, respectively, since the beginning of the month, and the tech-centric Nasdaq has dropped by approximately 5.3%. On a brighter note, shares of 3M jumped nearly 6% in premarket trading on news of a $5.5 billion settlement related to military earplug lawsuits.

3M Settles; Xpeng Acquires Didi Unit

3M shares surged 5.1% in premarket trading following reports that the company has potentially settled to pay over $5.5 billion to address claims of supplying faulty combat earplugs to the U.S. military.

Shares of Chinese EV manufacturer Xpeng, listed in the U.S., climbed 4.7% after announcing plans to acquire Didi’s electric car development unit in a deal valued at approximately $744 million.

Economic Data in Focus for the Week Ahead

Investors will keep their eyes peeled for more economic data this week, specifically the August Dallas Fed index, leading up to Friday’s crucial monthly jobs report. These economic indicators could provide a deeper look into consumer health, macroeconomic conditions, and the state of the U.S. labor market.

Short-Term Forecast: Mildly Bullish but Cautious

The market seems to be taking a cautiously optimistic stance for the week ahead, largely influenced by Powell’s remarks. While there’s a mild bullish sentiment, a lot hinges on forthcoming economic data and the Federal Reserve’s next moves. Investor caution is advisable amid such volatile conditions.

Natural Gas Prices Forecast: Gulf Weather, Australian Strikes Stir Futures Today

Natural Gas Prices Forecast: Gulf Weather, Australian Strikes Stir Futures Today

Natural Gas Futures Respond to Weather

Natural gas futures spiked significantly as speculators considered potential impacts of a hurricane in the Gulf of Mexico on key production plants. Despite the storm’s eastward trajectory, it is the western Gulf that houses these crucial facilities. While the U.S. National Hurricane Center warns of potential intensification of Tropical Storm Idalia towards Florida, power outages in the state could have bearish consequences for natural gas prices, given Florida’s reliance on gas for electricity.

Industrial Action Down Under

Further influencing global natural gas dynamics, Chevron’s workers in Australia are on the brink of authorizing unions to call strikes at major liquefied natural gas (LNG) facilities. This follows recent votes at Chevron’s Gorgon and Wheatstone facilities, which, combined with Woodside Energy Group’s projects, account for a significant chunk of global LNG supply. The Offshore Alliance union coalition has emphasized its commitment to pushing for improved pay and work conditions, threatening major disruptions to Chevron’s LNG exports.

Trading Derivatives carries a high level of risk to your capital and you should only trade with money you can afford to lose. Trading Derivatives may not be suitable for all investors, so please ensure that you fully understand the risks involved, and seek independent advice if necessary. A Product Disclosure Statement (PDS) can be obtained either from this website or on request from our offices and should be considered before entering into a transaction with us. Raw Spread accounts offer spreads from 0.0 pips with a commission charge of USD $3.50 per 100k traded. Standard account offer spreads from 1 pips with no additional commission charges. Spreads on CFD indices start at 0.4 points. The information on this site is not directed at residents in any country or jurisdiction where such distribution or use would be contrary to local law or regulation.

Chevron’s Mitigation and Broader Context

Chevron, in response, has signaled its intent to implement measures ensuring the continuity of supplies, emphasizing a commitment to reaching solutions beneficial to both workers and the company. This dispute echoes past conflicts, such as Woodside’s recent altercation at its North West Shelf LNG facility, which was eventually resolved without disruptive action.

US Natural Gas Dynamics

Meanwhile, U.S. natural gas futures witnessed a marginal increase last week, buoyed by continued hot weather forecasts driving high electricity demands. Notably, Texas experienced surging power prices, prompting calls for consumer energy conservation. Data from Refinitiv indicates a slight decline in U.S. gas output, while projecting increased demand in the near term, especially for LNG exports.

Short-Term Forecast

Given the interplay of meteorological factors and looming industrial actions, natural gas projections remain unpredictable in the short term. It’s imperative for traders to stay abreast with the unfolding scenario in the Gulf of Mexico and the labor discussions in Australia.

For those speculating on the hurricane’s influence on natural gas prices, a key point to note is that Florida’s coastline doesn’t house natural gas infrastructure, given its tourist-centric nature. Natural gas facilities are predominantly located in Louisiana and Texas. As a result, a hurricane hitting Florida doesn’t necessarily herald a spike in prices.

In fact, traders should avoid knee-jerk reactions to sensational headlines. Only a westward diversion of the hurricane could pose a genuine threat to gas valuations. Moreover, a hurricane-induced power shutdown in Florida might depress prices, given the state’s reliance on natural gas for electricity generation. In essence, no electricity translates to diminished natural gas consumption.

Technical Analysis

4-Hour Natural GasThe current 4-hour price of 2.619 for Natural Gas is a minor uptick from the previous 4-hour close of 2.613. However, it is trading below both the 200-4H moving average of 2.644 and the 50-4H moving average of 2.570, suggesting a bearish undercurrent. The 14-4H RSI stands at 58.06, indicating stronger momentum but not yet in overbought territory.

The commodity’s current price sits within the main support area of 2.542 to 2.487 and below the main resistance area of 2.636 to 2.674. Given its position relative to the moving averages and the RSI, the market sentiment leans cautiously bearish. However, traders should be prepared for a dose of heightened volatility due to weather concerns.

The Crypto Market Holds Positions but Still Looks Down

The Crypto Market Holds Positions but Still Looks Down

Cryptocurrency Market Holds Ground Despite Mid-Week Volatility

Despite a mid-week spike in volatility, the cryptocurrency market remained virtually unchanged from the previous week’s capitalisation level, hovering around $1.050 trillion (-1% in 7 days). Bitcoin‘s decline was a negligible 0.7%, while altcoins suffered losses of around 2%.

Bitcoin weekly chartThe technical picture for Bitcoin remains bearish on weekly timeframes, said Alex Kuptsikevich, the FxPro analyst, as the price is below its 200-week average and outside of its ascending channel. The most likely short-term outlook is for a decline to the $23.9-24.6K region, with the lower boundary being the 50-week average and the upper one being the pivot area from last August.

Trading Derivatives carries a high level of risk to your capital and you should only trade with money you can afford to lose. Trading Derivatives may not be suitable for all investors, so please ensure that you fully understand the risks involved, and seek independent advice if necessary. A Product Disclosure Statement (PDS) can be obtained either from this website or on request from our offices and should be considered before entering into a transaction with us. Raw Spread accounts offer spreads from 0.0 pips with a commission charge of USD $3.50 per 100k traded. Standard account offer spreads from 1 pips with no additional commission charges. Spreads on CFD indices start at 0.4 points. The information on this site is not directed at residents in any country or jurisdiction where such distribution or use would be contrary to local law or regulation.

According to Santiment, large investors continue to accumulate positions. The number of wallets with balances between 10 and 10,000 BTC totalled 156,600, and these accounts have accumulated $308.6 million since the 17th of August.

Crypto News

Bitcoin and other cryptocurrencies could fall in the short term, although the decline will be limited, JPMorgan warned. The bank said the liquidation of long positions is nearing completion rather than being in its early stages.

Tether has updated its report on the state of reserves providing liquidity to the USDT. The data shows assets exceed $86.1 billion, and liabilities exceed $82.8 billion.

Mastercard and Visa refuse to issue cryptocurrency payment cards for Binance amid the exchange’s regulatory troubles. In March, the CFTC filed a civil lawsuit against Binance. In June, the SEC filed 13 charges against the exchange.

Oil Prices Forecast: Navigating China’s Economic Woes, Fed’s Hawkish Tone

Oil Prices Forecast: Navigating China’s Economic Woes, Fed’s Hawkish Tone

Oil’s Mixed Sentiment

Oil prices started the week with slight volatility, showing an initial dip before recovering modestly. The market’s apprehension stems from two primary sources: China’s slowing economic growth and the possible repercussions of additional U.S. interest rate hikes, which could lead to reduced fuel demand.

China’s Economic Concerns

Oil experienced a brief surge during early Asian trading hours after China announced its decision to cut stamp duty on stock trading in an attempt to support its ailing markets. However, this move was perceived by many as insufficient to counteract the prevalent pessimism surrounding China’s economic health. Compounding the anxiety is the upcoming release of China’s manufacturing PMI data. Predictions suggest a continuation of its contraction trend for the fifth consecutive month, painting a grim picture for the world’s second-largest economy.

Trading Derivatives carries a high level of risk to your capital and you should only trade with money you can afford to lose. Trading Derivatives may not be suitable for all investors, so please ensure that you fully understand the risks involved, and seek independent advice if necessary. A Product Disclosure Statement (PDS) can be obtained either from this website or on request from our offices and should be considered before entering into a transaction with us. Raw Spread accounts offer spreads from 0.0 pips with a commission charge of USD $3.50 per 100k traded. Standard account offer spreads from 1 pips with no additional commission charges. Spreads on CFD indices start at 0.4 points. The information on this site is not directed at residents in any country or jurisdiction where such distribution or use would be contrary to local law or regulation.

U.S. Economic Signals and Production Cuts

On the U.S. front, the Federal Reserve’s potential to increase interest rates further, as hinted by Fed Chair Jerome Powell, remains a significant concern for investors. However, there was a silver lining in analyst Tina Teng’s observation that a “soft-landing” scenario for the U.S. economy could offer a cushion to energy markets. Meanwhile, a reduction in active oil rigs for the ninth consecutive month, as reported by Baker Hughes, points to decreased domestic oil production.

Tropical Storm Impact on Prices

Tropical Storm Idalia, currently developing in the Caribbean, is set to intensify into a hurricane. While projections show it avoiding major oil and gas hubs in the Gulf, the potential power outages in its path could offer transient support for oil prices.

Short-Term Forecast

The overall outlook for oil remains cautious. While tightening supplies and OPEC+’s supply cuts have traditionally bolstered prices, the potential easing of sanctions on Iran and Venezuela might reverse some of this momentum. In the short-term, a bearish tilt is anticipated, with the market closely watching China’s economic indicators and U.S. rate decisions.

Technical Analysis

4-Hour Crude Oil

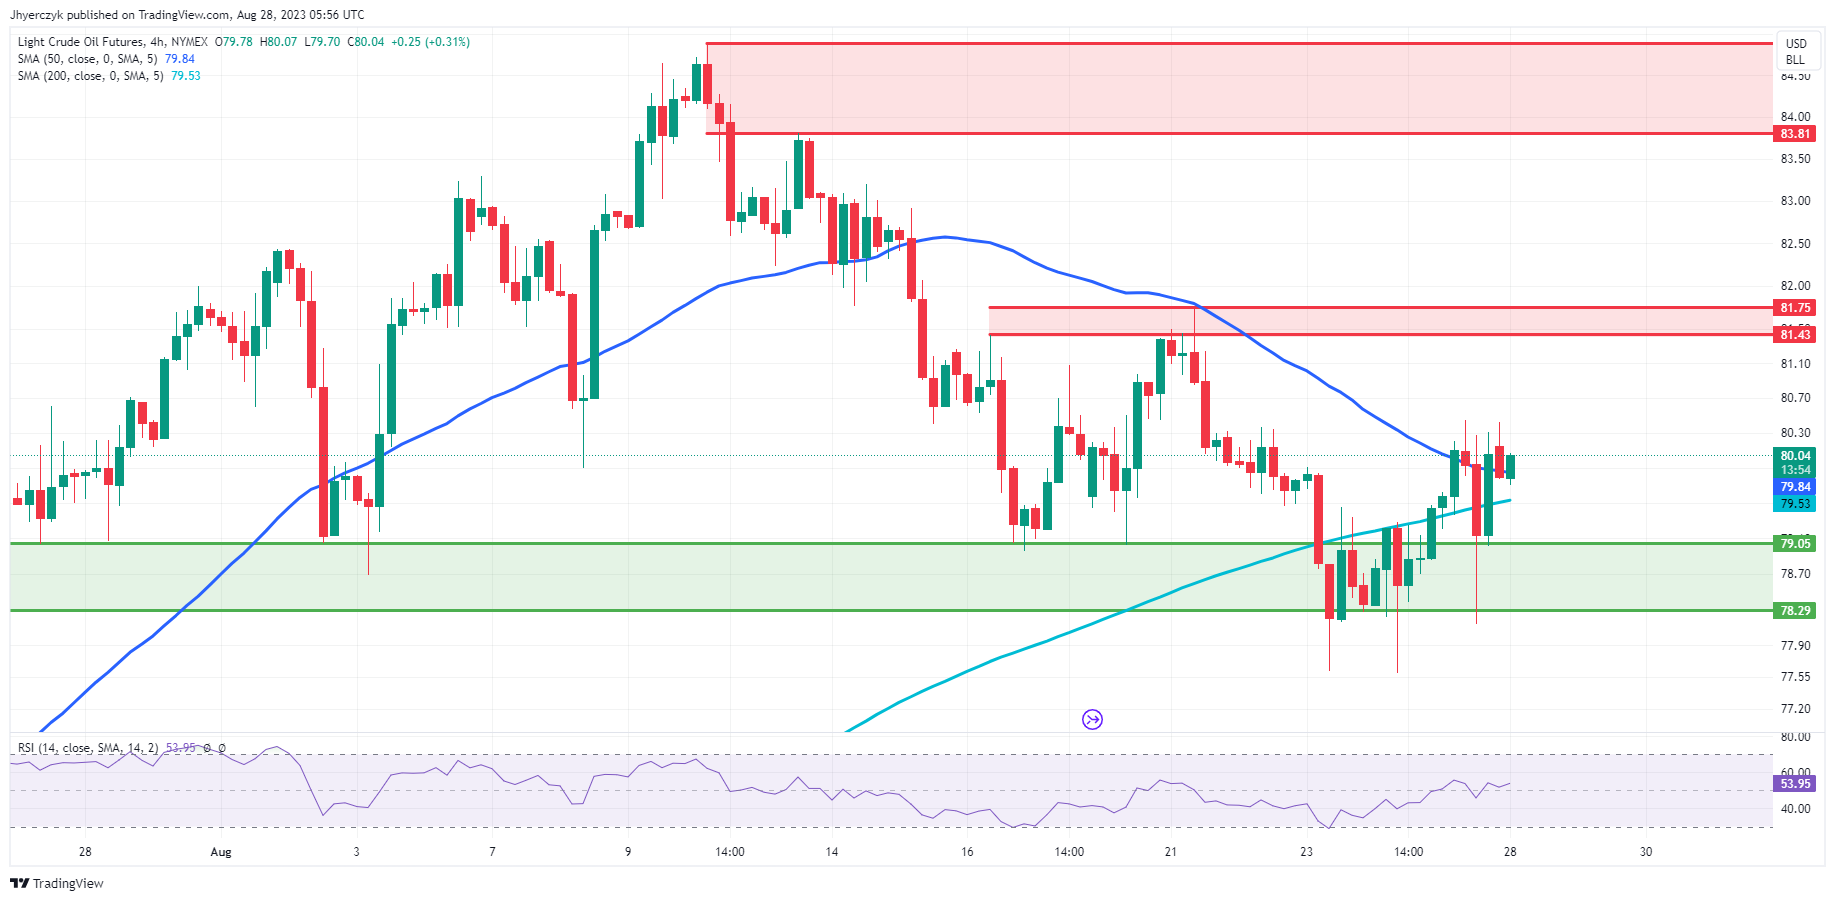
Crude Oil’s current 4-hour price of $80.04 shows a slight upward movement from the previous 4-hour price of $79.79. While the commodity is trading above the 200-4H moving average of $72.15, indicating a longer-term bullish momentum, it’s only straddling the 50-4H moving average of $79.84, which suggests recent bearish tendencies. The 14-4H RSI at 53.78 implies a modestly stronger momentum, leaning slightly bullish.

With the price nestled between the main support area (ranging from $79.05 to $78.29) and the main resistance area (spanning $81.43 to $81.75), the market sentiment for Crude Oil appears cautiously bullish in the short term.

AUD to USD Forecast: Aussie Dollar Tests RBA Pause Theory with July Retail Sales Numbers

AUD to USD Forecast: Aussie Dollar Tests RBA Pause Theory with July Retail Sales Numbers

Friday Overview

The AUD/USD fell by 0.24% on Friday. Following a 0.98% slump on Thursday, the Aussie Dollar ended the week flat at $0.64015. The Aussie dollar rose to an early Friday afternoon high of $0.64413 before sliding to a session low of $0.63643. Fed Chair Powell sent the Australian Dollar into the red before late support reduced the deficit.

Australian Retail Sales to Test the RBA Pause Theory

Bets on a September RBA rate hike have fallen in recent weeks. The Australian annual inflation rate softened from 7.0% to 6.0%, with Australian employment figures supporting a wait-and-see approach next month.

Trading Derivatives carries a high level of risk to your capital and you should only trade with money you can afford to lose. Trading Derivatives may not be suitable for all investors, so please ensure that you fully understand the risks involved, and seek independent advice if necessary. A Product Disclosure Statement (PDS) can be obtained either from this website or on request from our offices and should be considered before entering into a transaction with us. Raw Spread accounts offer spreads from 0.0 pips with a commission charge of USD $3.50 per 100k traded. Standard account offer spreads from 1 pips with no additional commission charges. Spreads on CFD indices start at 0.4 points. The information on this site is not directed at residents in any country or jurisdiction where such distribution or use would be contrary to local law or regulation.

However, wage growth and retail sales figures could force investors to rethink the pause theory. With wage growth elevated, a pickup in consumer spending could refuel bets on an RBA rate hike. Consumer spending drives demand-driven inflationary pressures. Another interest rate hike would impact disposable incomes and ease consumer demand-driven inflationary pressures.

Economists forecast retail sales to increase by 0.3% in July versus a 0.8% slump in June. A reversal of the June decline would support a more hawkish RBA policy outlook.

Fed Policy Bets and China Leave the Aussie Dollar under Pressure

Monetary policy divergence sits firmly in favor of the dollar this morning. The hawkish Fed Chair Powell speech leaves Fed rate hikes on the table. This week, US economic indicators will likely cement the Fed interest rate decision for September.

However, FOMC members must stick to the Fed Chair Powell script to drive bets on a September move.

This afternoon, Dallas Fed Manufacturing Index numbers are unlikely to impact sentiment toward Fed monetary policy.

The US manufacturing sector contributes less than 30% to the US economy. We expect investors and the Fed to brush aside the numbers, with wage growth, labor market conditions, and consumer demand-driven inflation the focal points.

However, investors should monitor the news wires for FOMC member commentary that would move the dial.

AUD/USD Price Action

Daily Chart

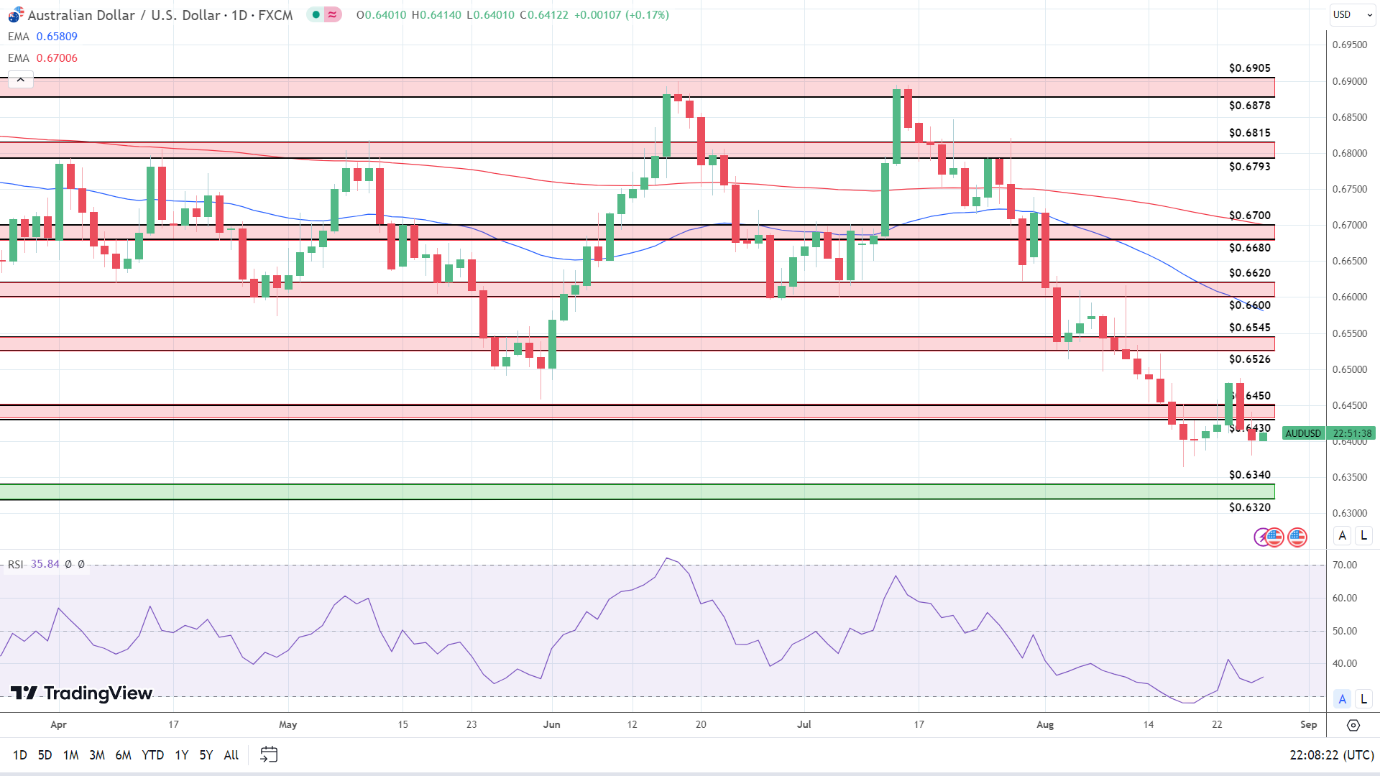
The Daily Chart showed the AUD/USD below the $0.6430 – $0.6450 resistance band. Significantly, the Aussie dollar remained below the 50-day and 200-day EMAs, sending bearish near and longer-term price signals.

The 14-Daily RSI at 35.84 reflects a bearish sentiment. The RSI and EMAs signal a fall to sub-$0.64 to bring the $0.6340 – $0.6320 support band into play. However, a move through the lower level of the $0.6430 – $0.6450 resistance band would give the bulls a look at $0.6450.

AUD to USD Daily Chart sends bearish price signals.
AUDUSD 280823 Daily Chart

4-Hourly Chart

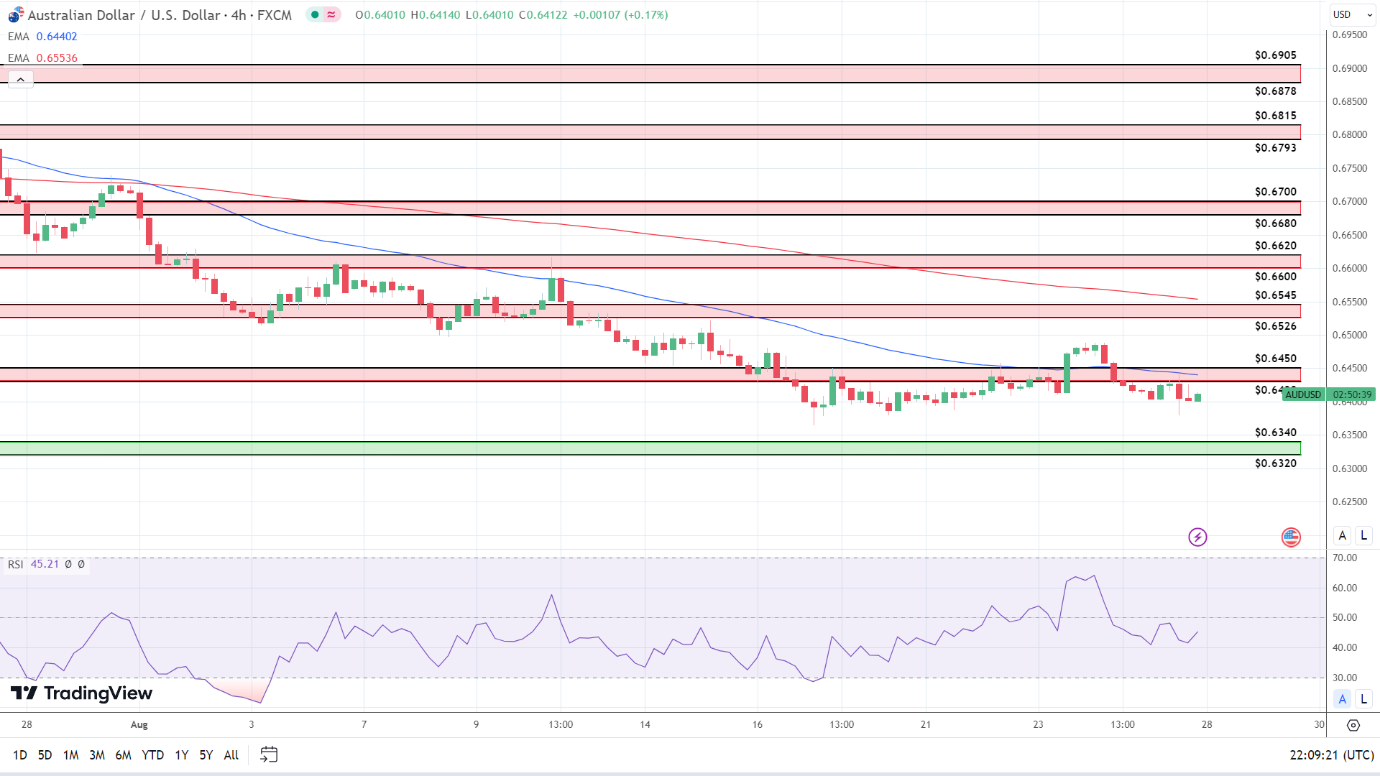
Looking at the 4-Hourly Chart, the AUD/USD sits below the $0.6430 – $0.6450 resistance band. After the Thursday and Friday losses, the AUD/USD hovers below the 50-day and 200-day EMAs, affirming the bearish near and longer-term price signals.

Looking at the 14-4-Houly RSI, 45.21 also reflects a bearish sentiment, with selling pressure overweighing buying pressure. The RSI and the EMAs signal a return to sub-$0.64 to bring the $0.6340 – $0.6320 support band into play. However, a move through the lower level of the $0.6430 – $0.6450 resistance band would bring the 50-day EMA and $0.6450 into play.

4-Hourly Chart affirms bearish price signals.
AUDUSD 280823 4-Hourly Chart
EUR/USD Forecast: ECB Signals and Grim Economic Data Clash

EUR/USD Forecast: ECB Signals and Grim Economic Data Clash

Friday Overview

On Friday, the EUR/USD slipped by 0.15%. Following a 0.48% loss on Thursday, the EUR/USD ended the week down 0.68% to $1.07946. The EUR/USD struck a Friday high of $1.08417 before revisiting a session low of $1.07659.

Central Bank Guidance Offsets Grim Economic Indicators

It is a busy week for the EUR/USD, with marquee economic indicators from the euro area in focus. While ECB President Lagarde talked about maintaining restrictive policy for as long as required, euro area economic indicators could test the theory.

Trading Derivatives carries a high level of risk to your capital and you should only trade with money you can afford to lose. Trading Derivatives may not be suitable for all investors, so please ensure that you fully understand the risks involved, and seek independent advice if necessary. A Product Disclosure Statement (PDS) can be obtained either from this website or on request from our offices and should be considered before entering into a transaction with us. Raw Spread accounts offer spreads from 0.0 pips with a commission charge of USD $3.50 per 100k traded. Standard account offer spreads from 1 pips with no additional commission charges. Spreads on CFD indices start at 0.4 points. The information on this site is not directed at residents in any country or jurisdiction where such distribution or use would be contrary to local law or regulation.

Inflation figures for Germany and the Eurozone could prove pivotal this week. However, investors must wait until Wednesday and Thursday for German and Eurozone inflation figures. Softer inflation numbers would question the ECB interest rate outlook.

Until Wednesday, central bank commentary and market risk sentiment will remain the key drivers.

There are no euro area economic indicators to consider or ECB Executive Board members on the calendar to speak today. However, investors should monitor ECB commentary with the media.

Central Bank Forward Guidance Leaves Economic Divergence in Focus

Following the Jackson Hole Symposium, the jury is out on whether the Fed or the ECB will lift rates higher. The prospect of the Fed and the ECB leaving rates unchanged leaves economic divergence in focus.

US economic indicators signaled a hotter-than-expected US economy, supporting the recent EUR/USD losses. However, US economic indicators this week need to send a similar message to avoid a dollar sell-off.

Core PCE Price Index, personal spending, and the US Jobs Report are out on Thursday and Friday. The economic calendar sets the EUR/USD pair up for a volatile second half of the week.

For the Fed, sticky inflation, an uptrend in personal spending, a pickup in wage growth, and a steady unemployment rate would likely give the dollar the upper hand.

Tight labor market conditions continue to fuel wage growth and demand-driven inflationary pressures. Further interest rate hikes would hit disposable incomes and consumption. A pullback in consumption would ease demand-driven inflationary pressures.

Later today, we expect investors to brush aside the Dallas Fed Manufacturing Index numbers. The US manufacturing sector accounts for less than 30% of the US economy, leaving the investor focus on the services sector, labor market conditions, and inflation.

EUR/USD Price Action

Daily Chart

The Daily Chart showed the EUR/USD above the $1.0750 – $1.0700 support band. A bullish start to the week saw the EUR/USD move through the 200-day EMA. However, the EUR/USD remains below the 50-day EMA, sending bearish near-term but bullish longer-term price signals.

Looking at the 14-Daily RSI, the 35.27 reading reflects a bearish sentiment. The RSI and the 50-day EMA signal a fall through the 200-day EMA to bring the upper level of the $1.0750 – 1.0700 support band into view. However, a EUR/USD hold above the 200-day EMA would give the bulls a run at the $1.0850 – $1.0900 resistance band.

EUR/USD Daily Chart sends bearish near-term price signals.
EURUSD 280823 Daily Chart

4-Hourly Chart

The EUR/USD remains below the $1.0850 – $1.0900 resistance band. Despite the bullish morning, the EUR/USD sits below the 50-day and 200-day EMAs, sending bearish near and longer-term price signals.

The 14-4H RSI at 42.69 reflects a bearish sentiment, with selling pressure outweighing buying pressure. Significantly, the RSI and EMAs signal a fall through the upper level of the $1.0750 – $1.0700 support band. However, a EUR/USD move through the lower level of the $1.0850 – $1.0900 resistance band would give the bulls a run at the 50-day EMA.

4-Hourly Chart affirms bearish near-term price signals.
EURUSD 280823 4 Hourly Chart
Silver Prices Forecast: XAG/USD Resilience Defies Powell’s Hawkish Tone

Silver Prices Forecast: XAG/USD Resilience Defies Powell’s Hawkish Tone

Silver Prices Firm Amid Macro Factors

Silver prices firmed unexpectedly on Monday, largely due to subdued Treasury yields and a stable U.S. Dollar. This resilience appeared despite the hawkish tone set by Jerome Powell concerning interest rates.

Powell’s Remarks and Market Sentiment

At the Jackson Hole symposium, Powell, the U.S. Federal Reserve Chair, alluded to potential further rate hikes. These hikes, motivated by prevailing inflation worries, accentuate the current strength of the U.S. economy. Powell’s alertness to the ongoing inflation scenario hinted at the necessity for further tightening of monetary policies. He commented, “Inflation remains too high,” and did not shy away from suggesting the possibility of future rate elevations to ensure inflation aligns with the Federal objectives. Surprisingly, markets displayed minimal disturbance post his speech, implying that traders might have anticipated this stance.

Trading Derivatives carries a high level of risk to your capital and you should only trade with money you can afford to lose. Trading Derivatives may not be suitable for all investors, so please ensure that you fully understand the risks involved, and seek independent advice if necessary. A Product Disclosure Statement (PDS) can be obtained either from this website or on request from our offices and should be considered before entering into a transaction with us. Raw Spread accounts offer spreads from 0.0 pips with a commission charge of USD $3.50 per 100k traded. Standard account offer spreads from 1 pips with no additional commission charges. Spreads on CFD indices start at 0.4 points. The information on this site is not directed at residents in any country or jurisdiction where such distribution or use would be contrary to local law or regulation.

Uncertainties and Upcoming Data

The path ahead for silver prices is cloudy. Accelerating inflation combined with the robust U.S. economy could signal another rate adjustment as soon as November. Loretta Mester of the Cleveland Federal Reserve supported this view, suggesting that controlling inflation might demand another rate hike, subsequently followed by a stable phase. Traders are eagerly awaiting the upcoming U.S. non-farm payroll report on Friday, hoping it provides deeper insights into the economy’s status.

Short-term Outlook for Silver

Despite looming economic reports and potential rate adjustments, the immediate forecast for silver seems to tilt towards the bearish side. With interest rates potentially on the ascent, assets like silver, which don’t yield, might lose their shine. However, it’s essential to consider the likelihood of a robust short-covering rally, especially since much of Powell’s Friday declarations seem to have been preemptively factored into current prices.

Technical Analysis

4-Hour Silver (XAG/USD)XAG/USD’s current 4-hour price sits at 24.20, a marginal increase from its prior value of 24.18. Comparing it with the moving averages, the current price resides comfortably above both the 200-4H moving average of 23.85 and the 50-4H moving average of 23.39. This suggests the market currently showcases an upward momentum. The 14-4H RSI is 64.97, indicating a stronger momentum but still under the overbought territory.

With the main support area placed between 22.70 to 22.28 and the main resistance area ranging from 25.00 to 25.27, the price stands closer to the midpoint of these two zones. Conclusively, the market’s sentiment for Silver is moderately bullish in the short term.

Gold Prices Forecast: XAU/USD Holds Firm Despite Fed Rate Hike Signals

Gold Prices Forecast: XAU/USD Holds Firm Despite Fed Rate Hike Signals

Gold Prices Amid Interest Rate Speculations

Gold’s Resilience Gold prices showed unexpected strength on Monday, buoyed by a combination of subdued Treasury yields and an unchanged U.S. Dollar, even in the face of Jerome Powell’s hawkish comments on interest rates.

Powell’s Impact on the Markets

At the annual Jackson Hole meeting in Wyoming, Powell, the U.S. Federal Reserve Chair, hinted at the possibility of further rate hikes due to heightened inflation concerns, emphasizing the robustness of the U.S. economy. Despite this, it appears that traders had already factored in this hawkish sentiment, resulting in minimal market turbulence post-speech.

Trading Derivatives carries a high level of risk to your capital and you should only trade with money you can afford to lose. Trading Derivatives may not be suitable for all investors, so please ensure that you fully understand the risks involved, and seek independent advice if necessary. A Product Disclosure Statement (PDS) can be obtained either from this website or on request from our offices and should be considered before entering into a transaction with us. Raw Spread accounts offer spreads from 0.0 pips with a commission charge of USD $3.50 per 100k traded. Standard account offer spreads from 1 pips with no additional commission charges. Spreads on CFD indices start at 0.4 points. The information on this site is not directed at residents in any country or jurisdiction where such distribution or use would be contrary to local law or regulation.

Anticipating Further Moves

Gold’s future trajectory remains uncertain, as accelerating inflation and the resilience of the U.S. economy could herald a rate hike as early as November. Echoing this sentiment, Loretta Mester from the Cleveland Federal Reserve Bank stated that quelling inflation might necessitate another interest rate increment, followed by a period of stability.

Upcoming Economic Indicators

Market participants are now keenly awaiting a slew of economic data, with the U.S. non-farm payroll report due on Friday expected to shed further light on the state of the economy. Additionally, recent data underscores the waning bullish sentiment in gold; COMEX gold speculators reduced their net long positions significantly in the week ending August 22.

Short-Term Forecast

Given the looming economic data and potential rate hikes, the short-term outlook for gold leans bearish. As interest rates rise, the appeal of non-yielding assets like gold typically diminishes. Nevertheless, there is the potential for a strong short-covering rally since most of what Powell said on Friday had already been priced into the market.

Technical Analysis

4-Hour Gold XAU/USDGold is currently displaying a slight uptick in momentum, with the current 4-hour price of XAU/USD at 1917.34, a marginal increase from the previous close at 1915.71. This suggests a mildly bullish undertone in the very short-term price action.

Moving Average Insights

The current 4-hour price rests comfortably above the 50-4H moving average, which stands at 1902.73, indicating an underlying strength in the market. However, the commodity still lags behind the longer-term 200-4H moving average positioned at 1935.94. This positioning showcases a tug of war between medium-term bearishness (since the price is below the 200-4H MA) and short-term bullishness (above the 50-4H MA).

Momentum and Key Levels

The 14-4H RSI reading stands at 58.85, suggesting that the commodity possesses a moderately strong momentum, being slightly above the neutral threshold of 50 but not entering the overbought territory. Furthermore, the XAU/USD price is nestled between the main support area of 1893.07 to 1885.79 and the main resistance zone of 1946.99 to 1964.88. This indicates that the commodity is currently consolidating, seeking direction.

Overall Sentiment

Considering the above factors, the gold market portrays a cautiously bullish stance in the short-term. The price above the 50-4H MA, combined with a moderately strong RSI, lends confidence. However, the significant resistance posed by the 200-4H MA implies the need for robust momentum to establish a decisive bullish or bearish direction.

The Week Ahead – Rate Hikes on the Horizon? Key Indicators to Watch This Week

The Week Ahead – Rate Hikes on the Horizon? Key Indicators to Watch This Week

On the Macro

The economic calendar will give investors more to think about. US nonfarm payrolls, wage growth, and inflation numbers could cement a September Fed rate hike.

Eurozone inflation numbers could also pressure the ECB to tighten policy further despite the grim PMI numbers for August.

After the hawkish Fed Chair Powell speech, central bank commentary needs consideration this week.

For the Dollar:

Consumer confidence and JOLTs job openings kickstart the week on Tuesday. On Friday, Fed Chair Powell opened the door to further rate hikes. A pickup in consumer confidence and steady job openings would support a more hawkish Fed policy outlook. Tight labor market conditions fuel consumer confidence, which drives consumption and demand-driven inflation.

On Wednesday, ADP nonfarm employment change and Q2 GDP figures need consideration. The ADP figures historically deviate from the US Jobs Report, which should limit the impact of the numbers on risk sentiment. However, revisions to Q2 GDP numbers would move the dial.

The PCE Price Index Report and jobless claims figures will affect market sentiment toward monetary policy. A decline in initial jobless claims, pickup in personal spending, and sticky inflation would raise bets on a September Fed rate hike.

Economic indicators on Friday could cement the Fed policy decision, with the US Jobs Report in focus. Wage growth and the nonfarm payroll numbers will be the focal points. A steady unemployment rate and a pickup in wage growth would drive hawkish Fed bets.

For the EUR:

The EUR will be in the hands of prelim inflation numbers for August and consumer sentiment and spending numbers.

On Tuesday, the GfK German Consumer Climate numbers will draw interest ahead of German inflation figures on Wednesday. Softer inflation and a pullback in consumer sentiment would send bearish price signals.

Eurozone inflation, German retail sales, and German unemployment figures will need consideration (Thurs). Another fall in German retail sales and deteriorating labor market conditions would also test buyer appetite. However, Eurozone inflation will be the focal point.

French GDP, inflation, and consumer sentiment figures will likely play second fiddle to the numbers out of Germany and the Eurozone on Thursday.

Manufacturing sector PMI numbers for August end a busy week. After the dire prelim figures for August, revisions to the Flash numbers and the PMI for Italy should have more impact.

Beyond the numbers, the ECB monetary policy meeting minutes will also move the dial. The latest stats from the euro area have reduced the chance of an ECB rate hike. We expect the minutes to provide some guidance.

For the Pound:

The UK housing sector will draw interest this week. However, we don’t expect the numbers to affect the Pound.

On Friday, revisions to the flash UK manufacturing PMI will influence. However, we expect central bank chatter to have more impact. The latest round of UK economic indicators eased bets on the BoE pushing for two interest rate hikes. BoE Chief Economist Huw Pill could provide clarity at events on Thursday and Friday.

For the Loonie:

GDP numbers will drive the Loonie. Q2 figures are out on Friday. Hotter-than-expected numbers will likely test market bets on a Bank of Canada hold on interest rates.

From elsewhere, private sector PMI numbers from China will also move the dial.

Out of Asia

For the Aussie Dollar:

Retail sales will draw interest on Monday. With the RBA hitting pause on interest rate hikes, hotter-than-expected numbers would support the Aussie Dollar. However, RBA Board members must deliver hawkish chatter to shift the bearish sentiment plaguing the Australian Dollar.

Building approvals, private new CAPEX, and home loan figures will draw interest in the second half of the week. The RBA remains sensitive to housing sector data. A deterioration in housing sector conditions could cement an RBA hold on interest rates.

For the Kiwi Dollar:

The Kiwi Dollar will sit in the hands of private sector PMIs from China and market risk sentiment.

While NBS private sector PMIs from China will draw interest on Thursday, the Caixin Manufacturing PMI will be the key driver. A return to growth would support riskier assets and the Kiwi Dollar.

For the Japanese Yen:

The Japanese Yen will need monitoring this week. Economic indicators from Japan include industrial pro

duction and capital spending.

While the numbers will draw interest, the Bank of Japan (BoJ) will likely remain focused on inflation. BoJ member commentary must be hawkish to end a four-week losing streak.

Out of China

Private sector PMIs will move the dial. On Thursday, the NBS Manufacturing and Non-Manufacturing PMIs will draw interest. A more marked contraction across the manufacturing sector would weigh on riskier assets. However, the all-important Caixin Manufacturing PMI will have more impact on Friday.