Australian Dollar Defies Gravity with Action Out of China, the PBOC and Japan

Australian Dollar Defies Gravity with Action Out of China, the PBOC and Japan

The Australian Dollar scoped out yesterday’s 10-month earlier today before rebounding on a bunch of data domestically and from Japan and China.

The backdrop to today’s move in the Aussie, and broader markets, has been the rise of the US Dollar being fanned by higher Treasury yield tailwinds.

The benchmark 10-year Treasury note eclipsed 4.20% in early Asian trade today after having hurdled the level overnight for the first time since November last year.

That move coincided with AUD/USD dipping toward its low, assisted by a weaker-than-expected wage price index of 3.6% year-on-year to the end of July, missing estimates of 3.7%. The soft read led to speculation of a less hawkish RBA.

That data point was soon surpassed by Chinese numbers that revealed a weaker than forecast economy.

Year-on-year to the end of July saw industrial production at 3.7% rather than the 4.3% anticipated, retail sales were 2.5% instead of the 4.0% estimated and fixed asset investment ex-rural came in at 3.4%, below the 3.7% forecast.

The statistics showed why the Peoples Bank of China (PBOC) had cut the 1-year medium-term lending facility (MLF) just prior. The Yuan tumbled lower with USD/CNY rallying toward 7.3000.

Elsewhere today, Japanese GDP figures printed way above expectations at 6.0% annualised for 2Q to the end of July, above the 2.9% expected by economists.

There was little reaction in markets with most of the boost emanating from exports and thereby lacked the impetus to move the dial on speculation of a tilt to the Bank of Japan’s yield curve control (YCC) program.

USD/JPY continues to tread water above 145.50 and the Nikkei 225 modest gains along with Australian and Korean indices. Not surprisingly, Chinese and Hong Kong bourses are lower on the day.

Futures are pointing toward a steady start to markets across Europe and Wall Street.

Commodity markets have had a relatively subdued start to Tuesday although soft (grains) commodities are slightly weaker.

Natural gas is a little higher on concerns of strikes at Woodside and Chevron, some of the world’s largest producers. Spot gold has been unable to recover recent losses as it trades near US$ 1,900 an ounce.

Looking ahead, after UK jobs data and the German ZEW survey, Canada will see CPI figures while the US will also see job statistics.

AUD/USD TECHNICAL ANALYSIS SNAPSHOT

Overall, AUD/USD marginally broke the lower bound of the six-month trading range of 0.6459 – 0.6900 when it traded at 0.6554.

If the price fails to run lower in the next few sessions, it might be regarded as a false break. That scenario may also indicate that a Double Bottom could be in place.

For more information on range trading, click on the banner below.

Nearby resistance could be at a cluster of breakpoints and prior peaks in the 0.6595 – 0.6615 area. On the downside, support might be near the recent lows of 0.6486 and 0.6459.
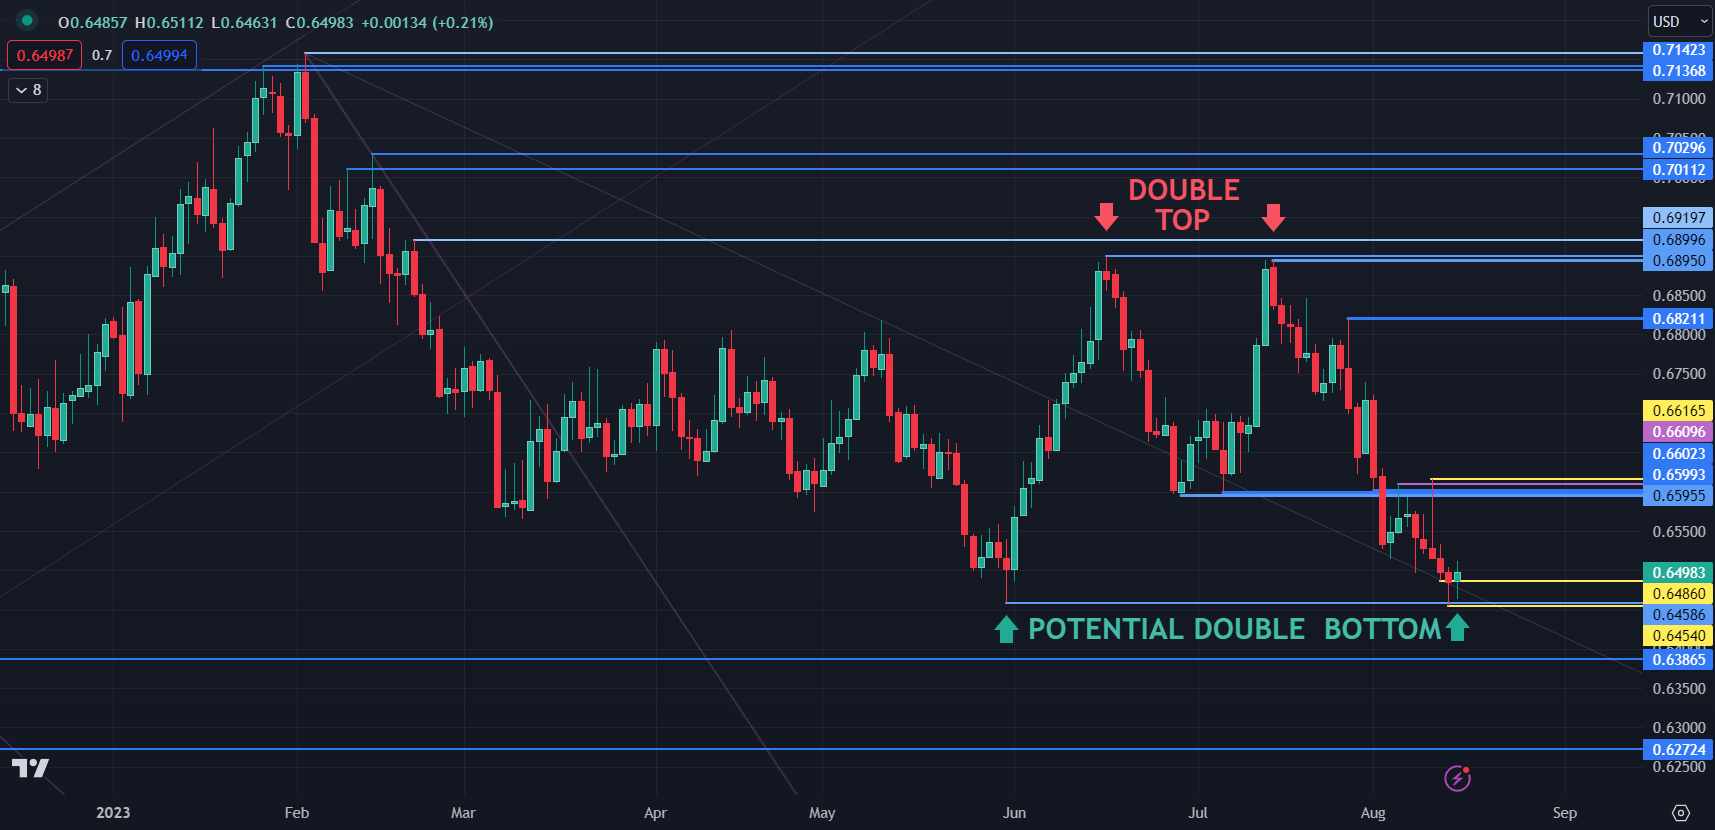

image1.png


BoE Faces Pressure Following Average Earnings Spike as Unemployment Rises, GBP/USD Bid

BoE Faces Pressure Following Average Earnings Spike as Unemployment Rises, GBP/USD Bid

The latest data out from the UK showed a mixed bag for the UK labour market. Estimates for April through to June 2023 show decreases in the employment and economic inactivity rates compared with the previous quarter. The number of people in work fell fell by 66 thousand in the three months to June 2023, against market expectations of a 75 thousand rise and following a 102 thousand increase in the previous period. This is the first drop in job creation since August 2022 and could be a sign of some cooling in the labor market despite the increase in average earnings.

image1.png

The unemployment rate increased to 4.2% on the quarter above the forecasted figure of 4% and 0.2% above pre-coronavirus pandemic levels. The increase in unemployment was driven by people unemployed for up to 6 months. In the latest quarter, the number of people unemployed for up to 6 months increased, with the largest increase since August to October 2022. This suggests that it is taking longer for those leaving economic inactivity to find work than in recent periods.

In April to June 2023, annual growth in regular pay (excluding bonuses) was 7.8%; this is the highest regular annual growth rate since comparable records began in 2001. Average earnings incl. bonuses rose even faster coming in at 8.2% for the period April to June 2023; it is important to note that this total growth rate is affected by the NHS one-off bonus payments made in June 2023.

image2.png

UK OUTLOOK MOVING FORWARD

Looking ahead and the recent GDP data out of the UK showed promising signs once more. The Bank of England have remained firm in their belief that inflation will trickle down in Q3 and Q4 of 2023 with the most recent print showing a significant drop-off.

There is no denying the UK economy has remained resilience for the large part, however today’s data will give the Bank of England (BoE) a massive headache. We have seen a bigger than expected drop-off in unemployment, but the Central Bank had stressed prior to the release that the average earnings figure would be crucial. Given the massive beat in average earnings it is unlikely that the BoE will be able to take its foot of the pedal in terms of rate hikes, at least not yet.

The Bank of England did leave the door open to further interest rate hikes and I think it is something they will have to act on following today’s data releases. We obviously have CPI data tomorrow with any print above or in line forecast likely to cement another rate hike in September.

MARKET REACTION

The initial market reaction following the news has seen GBPUSD bounce around 40-pips from the key support area around the 1.2680 mark.

However, GBPUSD on a daily timeframe still remains within the range between the 50 and 100-day MAs resting around the 1.26100 and 1.2760 mark. Yesterday saw an attempt to break below support at the 1.26100 mark but was met with buying pressure which has been the case of late. Sustainable moves continue to elude market participants as risk on-risk off battle continues. For a more comprehensive breakdown and longer-term view click on the article EUR/GBP, GBP/USD Remain Rangebound as GBP Faces a Defining Week.

GBPUSD Daily Chart, August 15, 2023


NASDAQ 100, Dow Jones, S&P 500: August Jitters Continue as Retail Giants Await Spotlight

NASDAQ 100, Dow Jones, S&P 500: August Jitters Continue as Retail Giants Await Spotlight

Overview

In a jittery start to August, Wall Street’s key indicators, the S&P 500 and Nasdaq Composite, edged down on Monday by 0.7% and 0.11%, respectively, while the Dow Jones Industrial Average slightly retreated by around 0.08%. A string of notable movements in individual stocks has become the talk of the town:

Shifting Dynamics in Key Players

U.S. Steel: This heavyweight jumped a significant 26% after snubbing a $7.3 billion buyout proposal from competitor Cleveland-Cliffs. The steel producer is now assessing “strategic alternatives.”

Trading Derivatives carries a high level of risk to your capital and you should only trade with money you can afford to lose. Trading Derivatives may not be suitable for all investors, so please ensure that you fully understand the risks involved, and seek independent advice if necessary. A Product Disclosure Statement (PDS) can be obtained either from this website or on request from our offices and should be considered before entering into a transaction with us. Raw Spread accounts offer spreads from 0.0 pips with a commission charge of USD $3.50 per 100k traded. Standard account offer spreads from 1 pips with no additional commission charges. Spreads on CFD indices start at 0.4 points. The information on this site is not directed at residents in any country or jurisdiction where such distribution or use would be contrary to local law or regulation.

Tesla: The EV magnate took a 2.2% hit after announcing a price cut on its Model Y variants in China.

Okta: This identity management firm experienced a 5% stock surge after Goldman Sachs switched its stance to a buy rating, pointing to a promising risk-reward scenario.

Few Stocks Buck the Trend

Parsons Corporation and Nikola showcased contrasting stories. While Parsons rose 2.5% after a double-upgrade by Bank of America, green truck producer Nikola tumbled 15% in the wake of a recall announcement for 209 electric trucks.

Short-Term Forecast

This week’s focal point will likely be the health of the U.S. consumer, with earnings insights expected from retail giants like Home Depot, Target, and Walmart. Coupled with this, the retail sales data for July is anticipated on Tuesday. Amidst the backdrop of inflation reports that still exceed the Federal Reserve’s 2% aim, market sentiments seem to align with earlier projections of short-term market stagnation. As we navigate the quieter days of August, investors are recalibrating their strategies, veering away from a soft landing, and re-evaluating market scenarios.

Silver Price Forecast – Silver Continues to Look for Buyers

Silver Price Forecast – Silver Continues to Look for Buyers

Silver Markets Technical Analysis

Silver’s move, or lack of, on Monday gave us a clear picture of how crazy the market can get. At first, things looked bad as the market went down, but then it quickly bounced back up. This roller coaster has made people rethink how they should approach silver’s future.

Trading Derivatives carries a high level of risk to your capital and you should only trade with money you can afford to lose. Trading Derivatives may not be suitable for all investors, so please ensure that you fully understand the risks involved, and seek independent advice if necessary. A Product Disclosure Statement (PDS) can be obtained either from this website or on request from our offices and should be considered before entering into a transaction with us. Raw Spread accounts offer spreads from 0.0 pips with a commission charge of USD $3.50 per 100k traded. Standard account offer spreads from 1 pips with no additional commission charges. Spreads on CFD indices start at 0.4 points. The information on this site is not directed at residents in any country or jurisdiction where such distribution or use would be contrary to local law or regulation.

The big story about silver is that it’s having a tough time going up in value, especially in the short term. The road ahead seems full of obstacles, making it hard for silver to keep going up smoothly. Even though things are shaky right now, many people believe that silver’s price could go higher in the long run. But before it goes up, it might need some time to stabilize.

One important thing that experts and traders are keeping a close eye on is the way silver reacts to changes in the US dollar. This fancy relationship has a big impact on what happens in the market. When the US dollar gets stronger, silver usually struggles, but when the dollar gets weaker, silver tends to do better. This adds an extra layer of confusion to how the market works.

Right now, everyone is watching a crucial support level at $22. This number has shown its importance many times before. If the price goes below this level, it might trigger a bigger drop in the market. If that happens, silver could head towards the important $20 mark. This number is important not just because of history but also because it means a lot to traders and experts.

On the other hand, if things turn around and the price starts going up again past the 200-Day Exponential Moving Average, we might see it reach $24. This is closely connected to another number, the 50-Day EMA, and this could bring new energy to the market. When these two numbers come together, they could make more people start trading because they show how the market is changing.

While the market is going through a tough time, it’s good to know that there’s strong support underneath. The big question is whether the market will bounce back and recover in a bigger range. When things are uncertain, it’s best to be patient and let the market decide what to do. Trying to guess what will happen might not be a good idea and could lead to more risks. That’s why it’s important for traders and investors to be careful and thoughtful as they deal with the ups and downs of the silver market.

In the end, Friday’s market roller coaster showed us how crazy silver trading can be. Its struggle to go up, especially with all the challenges, is like a mirror reflecting its relationship with the US dollar. The battle at $22 is a big deal, and numbers like the 200-Day EMA and the 50-Day EMA could guide its journey. In times of uncertainty, patience and careful reactions are key for those trying to make sense of the unpredictable world of silver trading.

Gold Price Forecast – Gold Markets Continue to Look for Direction

Gold Price Forecast – Gold Markets Continue to Look for Direction

Gold Market Technical Analysis

Gold markets fell just a bit during the trading session on Monday, but it also looks like we have a bit of support underneath. Because of this, I think it is a situation where we are trying to get back to the 50-Day EMA, near the $1965 level. If we can break above there, then it’s likely that the market could go looking to the $2000 level after that. The $2000 level of course is a very important psychological figure and an area where a lot of options will be sitting on. In other words, it will have a major influence on the market.

Trading Derivatives carries a high level of risk to your capital and you should only trade with money you can afford to lose. Trading Derivatives may not be suitable for all investors, so please ensure that you fully understand the risks involved, and seek independent advice if necessary. A Product Disclosure Statement (PDS) can be obtained either from this website or on request from our offices and should be considered before entering into a transaction with us. Raw Spread accounts offer spreads from 0.0 pips with a commission charge of USD $3.50 per 100k traded. Standard account offer spreads from 1 pips with no additional commission charges. Spreads on CFD indices start at 0.4 points. The information on this site is not directed at residents in any country or jurisdiction where such distribution or use would be contrary to local law or regulation.

On the other hand, if we were to break down below the 200-Day EMA, then it opens up and move down to the $1900 level. Anything below that level opens up a move down to the $1800 level where we had seen a lot of support previously, but I think you have to look at this through the prism of whether or not the US dollar is rising or falling, and of course pay close attention to the bond markets because higher yields will cause some issues for gold. At this point, you should also keep in mind that it’s the dead of summer and the vacation season, so a certain amount of volume is probably missing from the market.

From a longer-term standpoint, central banks out there are big buyers of gold and have been for a while, so that does put a little bit of a floor in the market. Whether or not we can go straight up in the air is a completely different question altogether, but I do think that we have a real shot at grinding higher over the longer term. Nonetheless, if we were to break down below the $1900 level, it could change a lot of things in this market and have people freaking out a bit. Ultimately, I do think that this market will try to go higher, but it will probably be a very slow and grinding slog to the upside. I’m still bullish, but it’s more of an investment than a trade, especially in August.

USD/JPY Forecast – Dollar on The Verge of a Massive Move

USD/JPY Forecast – Dollar on The Verge of a Massive Move

US Dollar vs Japanese Yen Technical Analysis

Beyond its numerical significance, the ¥145 threshold bears a weight of psychological relevance, casting its influence over traders across the board. A successful breach above this juncture could very well increase the trajectory of sustained upward momentum, potentially sending the market toward the ¥147.50 level. While the ¥147.50 level garners its share of attention, its current prominence does not overshadow other levels that pave the way to the elusive ¥150 level and, quite possibly, even beyond. In fact, I think this is what’s about to happen.

Trading Derivatives carries a high level of risk to your capital and you should only trade with money you can afford to lose. Trading Derivatives may not be suitable for all investors, so please ensure that you fully understand the risks involved, and seek independent advice if necessary. A Product Disclosure Statement (PDS) can be obtained either from this website or on request from our offices and should be considered before entering into a transaction with us. Raw Spread accounts offer spreads from 0.0 pips with a commission charge of USD $3.50 per 100k traded. Standard account offer spreads from 1 pips with no additional commission charges. Spreads on CFD indices start at 0.4 points. The information on this site is not directed at residents in any country or jurisdiction where such distribution or use would be contrary to local law or regulation.


The likelihood of a pullback materializing from the current vantage point could paradoxically catalyze an even stronger surge. The backdrop of the Bank of Japan’s unwavering efforts to counterbalance interest rates through quantitative easing measures further emboldens this upward scenario. The very foundation of these measures seeks to diminish the allure of the Japanese yen. Moreover, the US dollar’s own display of strength during the session provides an additional boost to the case for an upward trajectory. In terms of support, the ¥142.50 level emerges as a potential bastion against any substantial retracements.

It’s worth emphasizing that, given the existing landscape, shorting this particular currency pair doesn’t hold much allure. The subdued appeal of the Japanese yen within this context discourages any inclination toward holding this currency. Rather, the focus hones in on identifying intermittent value opportunities that arise.

Recent observations have unveiled a subtle sense of overextension, an inkling that suggests an impending pullback could serve as a strategic entry point. The 50-Day Exponential Moving Average casts its influence around the ¥141.50 mark and is steadily ascending. This market resonates with the sentiment of “one-way fundamentals,” echoing a symphony of technical analysis. This doesn’t imply an instantaneous breakout, but rather hints at a gradual crescendo of momentum. Thus, a measure of patience is poised to yield substantial rewards when navigating this currency pairing. The undercurrent of momentum is undeniable, and while the breakout might not be instantaneous, the undercurrent of buildup is certainly palpable.

In summation, the recent oscillations of the US dollar against the Japanese yen offer a glimpse into the intricate choreography that defines currency markets. The meticulous approach to pivotal levels, in tandem with the interplay between fundamental and technical factors, sketches a vivid canvas of prospects and pitfalls. In this enigmatic realm, traders navigate strategically, recognizing the latent value concealed within these fluctuations. Armed with insights into overarching trends and an intimate connection with the underlying market impetus, investors are poised to optimally position themselves for the potential crescendo, mindful that patience often ushers forth the most rewarding crescendos.

AUD/USD Forecast – Aussie Dollar Finds Buyers on the Dip

AUD/USD Forecast – Aussie Dollar Finds Buyers on the Dip

Australian Dollar vs US Dollar Technical Analysis

During the Monday session, the Australian dollar fell hard, breaking through the 0.65 level, only to turn around. This showcased the support and resistance fight around the level. Beyond its round figure, this figure bears substantial psychological weight, prompting a closer examination with the prospect of a potential but possibly short-lived turnaround in the short term.

Trading Derivatives carries a high level of risk to your capital and you should only trade with money you can afford to lose. Trading Derivatives may not be suitable for all investors, so please ensure that you fully understand the risks involved, and seek independent advice if necessary. A Product Disclosure Statement (PDS) can be obtained either from this website or on request from our offices and should be considered before entering into a transaction with us. Raw Spread accounts offer spreads from 0.0 pips with a commission charge of USD $3.50 per 100k traded. Standard account offer spreads from 1 pips with no additional commission charges. Spreads on CFD indices start at 0.4 points. The information on this site is not directed at residents in any country or jurisdiction where such distribution or use would be contrary to local law or regulation.

Hovering above is the 0.66 level, potentially serving as a resistance barrier due to its previous role as a support zone. The concept of “market memory” could resurface here, exerting potential influence on the market’s behavior. However, even if a breakthrough occurs above this threshold, a rendezvous with the 50-Day Exponential Moving Average, situated close to the 0.67 level, seems imminent. In the grand tapestry of events, any rally at this juncture could also unveil signs of exhaustion, presenting a window of opportunity for vigilant traders.

Conversely, envisioning a scenario where the lower boundary of Monday’s candlestick is breached prompts contemplation of the Australian dollar’s potential descent below the 0.64 level. This trajectory could propel the currency downward, possibly targeting the 0.64 level—a region that has consistently demonstrated its relevance in the past.

In the midst of this complex landscape, the prudent course of action lies in exercising caution when determining position sizes. The Australian dollar is inherently attuned to shifts in risk appetite and global growth prospects. This heightened sensitivity translates into a market environment teeming with noise, demanding a judicious approach to trading strategies.

Stepping back from the intricate details, the current scenario is a tableau of substantial ambiguity and nuance. The trading sentiment is polarized, with participants grappling to decipher the impending trajectory. With the Federal Reserve maintaining its stance, the potential resilience of the US dollar seems credible. However, a contingent of traders is gravitating towards the notion that the Federal Reserve’s maneuverability to tighten might be constrained. Within this intricate dance, the global growth outlook emerges as a decisive factor, rendering the overall picture perplexing at best.

In the end, the recent move of the Australian dollar underscore the multifaceted realm of currency trading. The confined ranges and fluid dynamics encapsulate the hurdles faced by traders endeavoring to navigate this landscape. Amidst these oscillations, the Australian dollar’s susceptibility to broader economic forces adds a layer of intricacy. As market participants strive to disentangle uncertainties while contending with divergent viewpoints, the unfolding trading activity is bound to continue its trajectory of unpredictability and volatility.

The Dollar Holds Strong as Headline Inflation Ticks Back Up

The Dollar Holds Strong as Headline Inflation Ticks Back Up

Annual non-core inflation in the USA for July came in at 3.2% on Thursday 10 August, slightly lower than expected but still an uptick from June’s figure. The core figure was also lower than the consensus at 4.7%. The reaction by markets has been muted partially because activity is seasonally low, but the dollar’s gains have continued on the whole while gold has struggled.

American annual non-core inflationAlthough the pace of rising prices did increase slightly, the general picture is cautiously optimistic for the consumer; prices for food and energy specifically have continued to drop although more slowly than last month. Sentiment in markets remains fairly positive, with many participants becoming more confident in recent months that the USA can avoid a significant recession.

However, the Fed still wants to bring inflation down further, closer to 2% or even below. With job data and GDP relatively strong considering how high and how quickly the funds rate has gone up, it seems like there’s more room for the Fed to keep hiking. For now, the large majority of participants expects the current 5.25-5.5% to be the peak of this cycle of tightening according to CME FedWatch Tool. A pivot is expected at the very end of the first quarter next year at the earliest.

It’s generally not a good idea to read too much into one month’s data for inflation. There’s still one more release on 13 September before the Fed’s next meeting a week after that. The FOMC will consider all of the latest figures within their context when deciding on rates and possibly signalling an extended pause.

Cable, Daily Chart


undefined


Apart from American inflation, surprisingly positive British GDP data on Friday 11 August have boosted the pound in many of its pairs. Nevertheless, the Bank of England remains 0.25% behind the Fed on rates despite British inflation at 7.9% being more than double the USA’s. According to recent comments, the Bank of England now expects the UK to avoid a recession. Overall, there isn’t a clear fundamental narrative for cable in either direction at the moment.

That makes the downward movement since the middle of last month understandable as a technical retracement rather than the beginning of a new downtrend, for the moment at least. Volume for cable has remained relatively high this summer, while 3 August’s strong bounce with a dragonfly doji from the 100 SMA would usually suggest a fairly strong buy signal. Acting on that would require patience, but it’s also not certain how the pound will react to the critical job report and inflation data on 15 and 16 August.

S&P 500, Daily Chart


undefined


The S&P 500 didn’t react strongly to the release of numbers on inflation, but on Friday 11 August sentiment was somewhat dented by higher producer prices in the USA. These might suggest that the Fed will have to keep rates higher for longer. As for most other markets, there haven’t been any dramatic moves by major American shares this summer so far, with tech and travel-related shares generally remaining strong.

The support in focus remains the 61.8% weekly Fibonacci retracement around 4,350, which was also the limit of the smaller retracement two months ago. It doesn’t seem likely that the price could break through there before activity starts to return later this month and in September unless there are major surprises from the biggest companies still to release earnings reports, including Nvidia, Walmart and Cisco. However, since the price hasn’t clearly broken through the 50 SMA from Bands, it’d be possible to see a bounce in the next few days and a channel forming between 4,450 and 4,600.

If you’d like to discover more about any of these topics and the prospects for the Fed’s next meeting, register for and join Exness’ upcoming webinar on 11 September at 10.00 GMT. Antreas Themistokleous CFTe, trading specialist at Exness, will discuss the latest news affecting major symbols, analyse gold, forex and more live plus answer all relevant questions.

Potential Supply Shocks Threaten Natural Gas Prices This Winter

Potential Supply Shocks Threaten Natural Gas Prices This Winter

Bullish Tides for Natural Gas This Winter

As summer heatwaves blaze through regions like Texas, those in the natural gas sector are already setting their sights on winter supply dynamics. Several recent events hint at a bullish trend for natural gas prices in the winter of 2023-2024.

Global Supply Disruptions

Australia, a significant global producer, is currently in the limelight due to potential strikes that may disrupt the natural gas supply. These strikes arise from disputes about pay and conditions at major Australian plants, including those owned by Chevron Corp. and Woodside Energy Group Ltd., according to Reuters.

Remarkably, these two giants account for over 10% of global liquefied natural gas supplies. With labor unions in continued negotiations, prolonged plant closures could significantly upset the balance of global supplies.

Heightened Demand Anticipation

Despite the subdued demand for gas in the northern hemisphere, the looming heating season and the prospect of disrupted supplies have already sent wholesale gas prices climbing. These hikes are further exacerbated by the extreme weather events experienced this summer and setbacks among other major producers.

U.S. in the Spotlight

With the Australian supply situation turning dicey, all eyes will turn to the US, the world’s largest and most flexible supplier of LNG. But there’s a catch. The ongoing Atlantic hurricane season, which threatens the US Gulf Coast – home to a concentration of US LNG exporters – is a significant concern. As ocean temperatures rise, US forecasters predict an unusually active Atlantic hurricane season, which may disrupt LNG exports.

Market Constraints

Should the Australian supply disruption stretch into September, global supplies would be directly impacted right before the heating season. Such a scenario would mean a spike in prices in both Asia and Europe. In an already tight LNG market, this could push price indices even higher, with regional markets vying for limited supplies.

Global Dependencies

A potential month-long strike at Australia’s key LNG plants could remove about 44 cargoes of LNG from the market, according to Bloomberg. This is of particular concern for countries like Japan, Thailand, and Taiwan, which rely heavily on these supplies. These facilities also account for a significant portion of China’s and Singapore’s imports. With their regular suppliers in jeopardy, these countries may be forced to tap into the spot markets, further driving prices up.

Compounding Supply Pressures

According to Bloomberg, supplies from other regions are also facing challenges. Russian LNG exports have dwindled due to maintenance, while Trinidad & Tobago and Egypt face their own sets of issues, further constricting global supplies. Additional scheduled maintenance, including at Australia’s Prelude, is slated for the third quarter.

Impact on Consumers and Industries

The culmination of these factors spells volatility for natural gas prices this winter. Households, as well as large-scale gas consumers like steel, fertilizer, and ceramic industries, could brace for higher bills, reminiscent of last year’s price surge.

Conclusion

Considering the myriad of challenges and uncertainties plaguing the natural gas market, it seems almost inevitable that prices will surge in the winter of 2023-2024. The global tug of war for limited supplies, combined with potential supply disruptions, places natural gas at the forefront of economic concerns this coming winter.

US Dollar Index News: DXY Climbs Amid Concerns Over China’s Economy

US Dollar Index News: DXY Climbs Amid Concerns Over China’s Economy

Overview

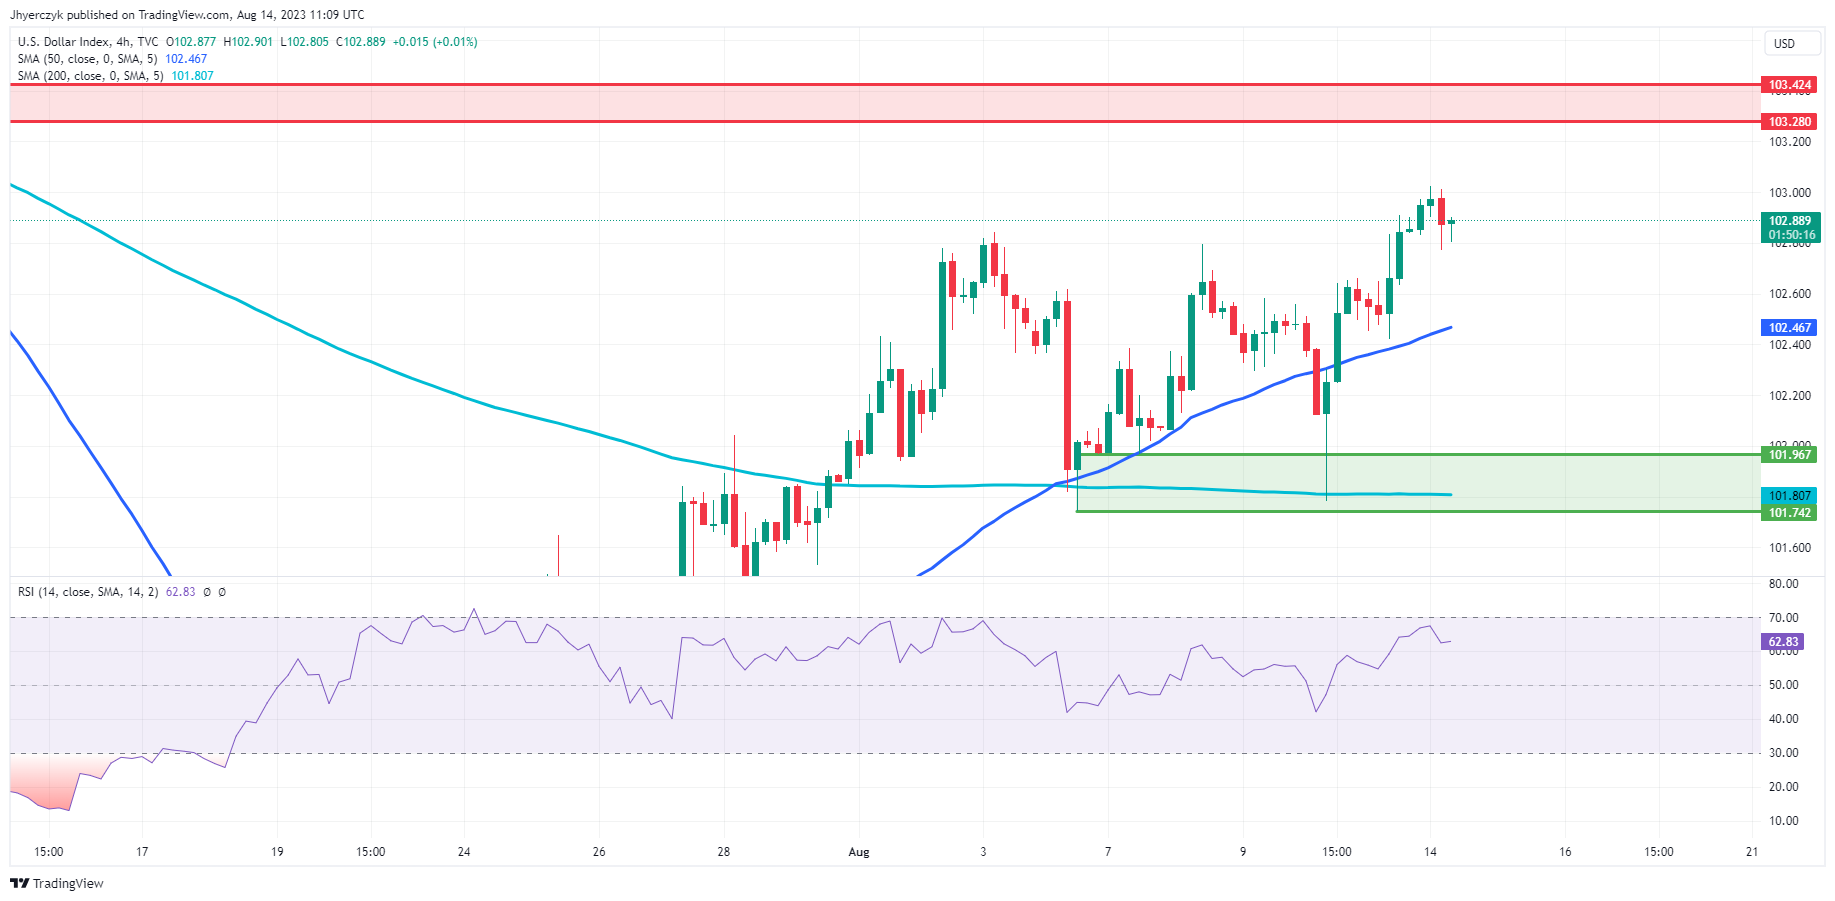
The U.S. dollar (DXY), acting as a beacon for safe-haven seekers, soared to a one-month high of 103.02 against major currencies amidst mounting concerns over China’s economic landscape. However, it retraced slightly to 102.82, nearly even for the session.

Dollar Rises Amid Global Uncertainty

These upward fluctuations reflect investor sentiments gravitating towards the dollar, primarily due to anxiety over the global economy’s health, underscored by China’s uncertain status. Additionally, a noticeable ascent in U.S. bond yields, indicative of a resilient U.S. economy, has buttressed the dollar’s appeal.

Trading Derivatives carries a high level of risk to your capital and you should only trade with money you can afford to lose. Trading Derivatives may not be suitable for all investors, so please ensure that you fully understand the risks involved, and seek independent advice if necessary. A Product Disclosure Statement (PDS) can be obtained either from this website or on request from our offices and should be considered before entering into a transaction with us. Raw Spread accounts offer spreads from 0.0 pips with a commission charge of USD $3.50 per 100k traded. Standard account offer spreads from 1 pips with no additional commission charges. Spreads on CFD indices start at 0.4 points. The information on this site is not directed at residents in any country or jurisdiction where such distribution or use would be contrary to local law or regulation.

Yen Dips; Intervention Anticipated Again

On the Asian front, the yen experienced turbulence. Plunging to its lowest since last November at 145.22 per dollar, it stirred anticipation of potential intervention by the Japanese government. Notably, the Bank of Japan’s steadfast commitment to its ultra-loose monetary policy contrasts with global central banks’ tightening stance, placing downward pressure on the yen.

Historical context is essential here: the dollar breached the 145 yen mark last September, triggering the Ministry of Finance’s intervention to stabilize the currency around 140 yen. A near 10% annual depreciation against the dollar, combined with the absence of verbal intervention, hints at Japanese authorities’ possibly increased tolerance threshold.

Euro Stabilizes; China Financial Strains

European currencies weren’t exempt from volatility, with the euro experiencing a brief dip before stabilizing against the dollar at $1.095. Meanwhile, in China, the suspension of Country Garden’s onshore bonds and Zhongrong International Trust Co.’s payment defaults highlighted distress signals in the nation’s financial sector. Such events, coupled with high U.S. bond yields, have imposed strains on risk assets.

Crucial China Data Could Set Weekly Tone

The week ahead holds significant promise for currency markets. Crucial data releases include China’s industrial outputs and consumer expenditure insights on Tuesday, trailed by the U.S. Federal Reserve meeting minutes and the U.K.’s inflation data on Wednesday. Japan is set to reveal GDP figures on Tuesday and inflation data by week’s end, underscoring a potentially transformative week for global currency trends.

Technical Analysis

4-Hour US Dollar Index (DXY)The US Dollar Index (DXY) has recently shown an uptrend, with the current 4-hour price at 102.918, marginally above the previous 4-hour close of 102.874. This indicates a slight bullish sentiment.

When we assess the moving averages, the DXY is positioned above the 50 and 200-4H moving averages, a bullish sign. The 14-4H RSI stands at 63.41, indicating stronger upward momentum without being overbought.

Lastly, the current price stands above the main support area (101.967 to 101.742) and below the main resistance zone (103.280 to 103.424). Given this configuration and the indicators’ values, the market sentiment for DXY currently leans bullish.