Bank tax hits investor confidence in Italian govt

Bank tax hits investor confidence in Italian govt

MILAN: Italian Prime Minister Giorgia Meloni’s government watered down its surprise windfall tax on banks this week after a brutal market reaction, but the damage to investor confidence was done.

“The most damaging impact… will not be the hit to the earnings of Italian banks but the higher risk premium that investors will demand to compensate them for the risk of future government intervention,” noted Johann Scholtz, analyst at Morningstar.

Meloni’s hard-right government announced out of the blue on Monday night that it would levy a 40-percent tax on banks’ “surplus profits” generated by interest rate hikes, due to last one year.

Shares in Italian banks plunged the next day on the Milan exchange, losing 9.5 billion euros ($10.5 billion) in capitalisation – a figure well in excess of the money Rome had hoped to raise from the tax.

That evening, the government announced the levy would be capped at 0.1 percent of the total assets of a bank, causing them to recover some of their lost ground in trading on Wednesday and Thursday.

But ratings agency Moody’s said on Thursday that the one-off tax would “lower profits systemwide and significantly reduce the benefit of increased interest rates to the sector”.

Parliament must still approve the decree law but if implemented in its current form, the levy would represent “about 15 percent” of Italian banks’ net income in 2022, it said.

‘Haphazard manner’

It was Meloni’s first showdown with the markets since she took office in October, after her far-right Brothers of Italy party came top in September’s general election.

Initial alarm at the potential for radical change in the eurozone’s third-largest economy gave way to relief as Meloni mostly followed the path set by her predecessor, former European Central Bank chief Mario Draghi.

One of Draghi’s ministers, Giancarlo Giorgetti of the far-right League party, stayed on as Meloni’s economy minister.

He reassured banks in June that a windfall tax was not on the cards – but was absent on Monday when the measure was unveiled by League leader Matteo Salvini.

“An economy minister who does not show up for a press conference in such an occasion gives a very bad image of the country,” noted Francesco Giavazzi, a former economic advisor to Draghi.

“The haphazard manner of the announcement, where the government changed the terms of the tax at least three times in one day, will do little to restore investor confidence,” added Scholtz.

‘Populist target’

While Meloni left the announcement of the tax to Salvini, her deputy prime minister, she defended it in a video posted on social media on Wednesday.

She criticised the “unfair margins” of the banks, and said the money raised would help “fund measures of support for households and businesses” struggling with record inflation.

Italian banks, like their European counterparts, saw their net interest income soar in the wake of the European Central Bank’s rise in interest rates.

The government – which also includes the Forza Italia party of late former premier Silvio Berlusconi – has been criticised for cutting an anti-poverty mechanism and blocking opposition calls for a minimum wage.

“Banks are an easy populist target and their bashing can only attract political support,” said Lorenzo Codogno, former chief economist at the Italian Treasury.

But he warned that “a Soviet-style tax” such as this week’s levy “risks producing permanent damage to the attractiveness of Italy’s economy”.

GDP first quarterly estimate, UK: April to June 2023

GDP first quarterly estimate, UK: April to June 2023

The implied GDP deflator represents the broadest measure of inflation in the domestic economy, reflecting changes in the price of all goods and services that comprise GDP. It is important to note that the GDP deflator covers the whole of the domestic economy, not just consumer spending, and also reflects the change in the relative price of exports to imports. For more information on the implid GDP deflator, see our Measuring price changes of the UK national accounts: February 2023 article.

The implied price of GDP rose by 2.1% in Quarter 2 2023, which was primarily driven by higher price pressures for household consumption (1.5%) and government consumption (3.1%). The implied price of GDP was 6.7% higher in Quarter 2 2023 than the same quarter a year ago, a slight increase from growth of 6.5% in the previous quarter.

In the year to Quarter 2 2023, growth was driven by strong rises in the price of household consumption, though there was a slowing in the latest quarter of how much these prices increased. There have also been large price movements in internationally traded goods and services, where there was an easing in the implied price of imports; this contributes positively to the increase in the GDP implied deflator (Figure 2). Further information on the price movements of trade is discussed in our article, The purchasing power of GDP, UK: 2022.

Source: GDP first quarterly estimate from the Office for National Statistics

Notes:
  1. Q1 refers to Quarter 1 (Jan to Mar), Q2 refers to Quarter 2 (Apr to June), Q3 refers to Quarter 3 (July to Sept) and Q4 refers to Quarter 4 (Oct to Dec).
  2. Components contribution may not sum to total because of rounding.
  3. An increase in import prices contributes negatively to the implied GDP deflator, while a decrease in import prices contributes positively to the implied GDP deflator.
GBP to USD Forecast: Sub-$1.26 in Play on UK GDP and US PPI Numbers

GBP to USD Forecast: Sub-$1.26 in Play on UK GDP and US PPI Numbers

On Thursday, the GBP to USD fell by 0.34% to wrap up the day at $1.26755. The US CPI Report and recessionary jitters left the GBP/USD at sub-$1.27.

It is a busy day ahead for the GBP to USD. UK GDP numbers for the second quarter and industrial and manufacturing production, and trade data will be in focus this morning. We expect GDP and manufacturing production figures to have more impact.

Trading Derivatives carries a high level of risk to your capital and you should only trade with money you can afford to lose. Trading Derivatives may not be suitable for all investors, so please ensure that you fully understand the risks involved, and seek independent advice if necessary. A Product Disclosure Statement (PDS) can be obtained either from this website or on request from our offices and should be considered before entering into a transaction with us. Raw Spread accounts offer spreads from 0.0 pips with a commission charge of USD $3.50 per 100k traded. Standard account offer spreads from 1 pips with no additional commission charges. Spreads on CFD indices start at 0.4 points. The information on this site is not directed at residents in any country or jurisdiction where such distribution or use would be contrary to local law or regulation.

Economists forecast manufacturing production to increase by 0.2% in June. However, economists expect the UK economy to stall in the second quarter after expanding by 0.1% in the previous quarter. Monthly GDP numbers could provide relief, with economists forecasting the economy to grow by 0.2% in June.

Later in the session, NIESR GDP estimates will also move the dial.

While the UK economic calendar is busier, no Bank of England Monetary Policy Committee Members are on the calendar to speak today, leaving chatter with the media to influence.

UK GDP figures have a material impact on the GBP/USD. A deteriorating macroeconomic environment leads to a decline in foreign investment and demand for the Pound. The Bank of England must also consider economic conditions when making monetary policy decisions. Tight monetary policy conditions and a weakening macroeconomic environment would force the BoE to ease policy or hit the brakes in a monetary policy tightening cycle.

The US Session

It is another big day ahead, with US producer price index numbers and the Michigan Consumer Sentiment survey in focus. A more marked increase in the producer price index and improving consumer confidence would give the Fed more food for thought.

Economists forecast the producer price index to increase by 0.2% in July, following a 0.1% increase in June. However, economists expect the Michigan Consumer Sentiment Index to slip from 71.6 to 71.0.

The producer price index shows the direction of selling prices received by domestic producers. Significantly, the PPI includes selling prices from the first commercial transaction for products and services, a leading indicator for consumer price inflation. Upward trends in the producer price index signal a pickup in consumer inflationary pressures.

Beyond the economic calendar, investors should monitor the news wires for Fed chatter throughout the day.

GBP to USD Price Action

Weekly chart sends bearish near-term price signals.
GBPUSD 110823 Weekly Chart

Daily Chart

The Daily Chart showed the GBP to USD sat below the $1.2785 – $1.2862 resistance band. Looking at the EMAs, the GBP to USD sat below the 50-day EMA ($1.27377) while holding above the 200-day EMA ($1.24566), sending bearish near-term but bullish longer-term price signals.

Notably, the 50-day EMA narrowed to the 200-day EMA, signaling further price losses.

Looking at the 14-Daily RSI, the 41.38 reading sends bearish price signals. The RSI signals a fall to sub-$1.2650 to bring the $1.2520 – $1.2440 support band into view. However, a GBP to USD move through the 50-day EMA ($1.27377) would support a breakout from the $1.2785 – $1.2862 resistance band to target $1.29.

GBP to USD Daily Chart affirms bearish near-term price signals.
GBPUSD 110823 Daily Chart

4-Hourly Chart

Looking at the 4-Hourly Chart, the GBP to USD hovers below the $1.2785 – $1.2862 resistance band. The GBP to USD also sits below the 50-day ($1.27528) and 200-day ($1.27810) EMAs, sending bearish near and longer-term price signals.

Significantly, the 50-day EMA fell back from the 200-day EMA, a bearish price signal. However, a GBP to USD move through the EMAs would support a breakout from the $1.2785 – $1.2862 resistance band to give the bulls a look at $1.29. Failure to move through the 50-day EMA would leave sub-$1.2650 and the $1.2520 – $1.2440 support band in play.

The 14-4H RSI reading of 40.60 sends bearish signals, with selling pressure outweighing buying pressure. Significantly, the RSI signals a fall to sub-$1.2650 to bring the $1.2520 – $1.2440 support band into play.

GBP to USD sends bearish price signals.
GBPUSD 110823 4 Hourly Chart
Oil Price Forecast: Traders Balancing OPEC Optimism, China’s Economic Woes

Oil Price Forecast: Traders Balancing OPEC Optimism, China’s Economic Woes

Overview

Oil prices are flat early Friday as traders stand their ground in the face of fluctuating global economic cues. As Asian markets began trading, traders kept a close eye on the balance between OPEC’s upbeat demand forecasts and China’s wavering economic figures, the world’s top oil consumer.

OPEC Foresees Strong 2024 Oil Demand

The Organization of the Petroleum Exporting Countries (OPEC) recently reiterated its projections, expecting a climb in global oil demand by 2.44 million barrels per day (bpd) in 2023, and 2.25 million bpd in 2024. The driving force behind this uptick? They anticipate robust economic growth in 2024, especially from China, signaling an increase in oil consumption. Conversely, U.S. consumer prices data from July has sparked conversations about the potential culmination of the Federal Reserve’s intense rate-hiking period, boosting market morale.

Trading Derivatives carries a high level of risk to your capital and you should only trade with money you can afford to lose. Trading Derivatives may not be suitable for all investors, so please ensure that you fully understand the risks involved, and seek independent advice if necessary. A Product Disclosure Statement (PDS) can be obtained either from this website or on request from our offices and should be considered before entering into a transaction with us. Raw Spread accounts offer spreads from 0.0 pips with a commission charge of USD $3.50 per 100k traded. Standard account offer spreads from 1 pips with no additional commission charges. Spreads on CFD indices start at 0.4 points. The information on this site is not directed at residents in any country or jurisdiction where such distribution or use would be contrary to local law or regulation.

China’s Data Clouds Fuel Demand

However, clouds of uncertainty loom due to China’s recent economic data. While crude imports have experienced a year-on-year rise, overall exports have seen a significant drop, diminishing by 14.5% compared to last year. Furthermore, a concerning trend has emerged with China’s consumer prices dipping into deflation territory and factory gate prices dwindling further in July. These factors highlight potential hiccups in fuel demand from the Asian giant.

Russia-Ukraine Tensions Buoy Oil Prices

From a supply standpoint, there are silver linings. Extended output cutbacks from major players like Saudi Arabia and Russia, coupled with apprehensions about disruptions to Russian oil deliveries due to Russia-Ukraine tensions, have kept the price buoyant. While crude markets might face a supply deficit in the latter half of the year, it might not be as stark as OPEC’s prediction.

Traders Anticipate Bullish Oil Trend

In conclusion, while our anticipated supply deficit seems milder than OPEC’s, it’s sufficient to propel oil prices above US$90/bbl through the latter half of 2023. With a blend of optimistic and cautious cues from the market, traders should brace for a potentially bullish trend.

Technical Analysis

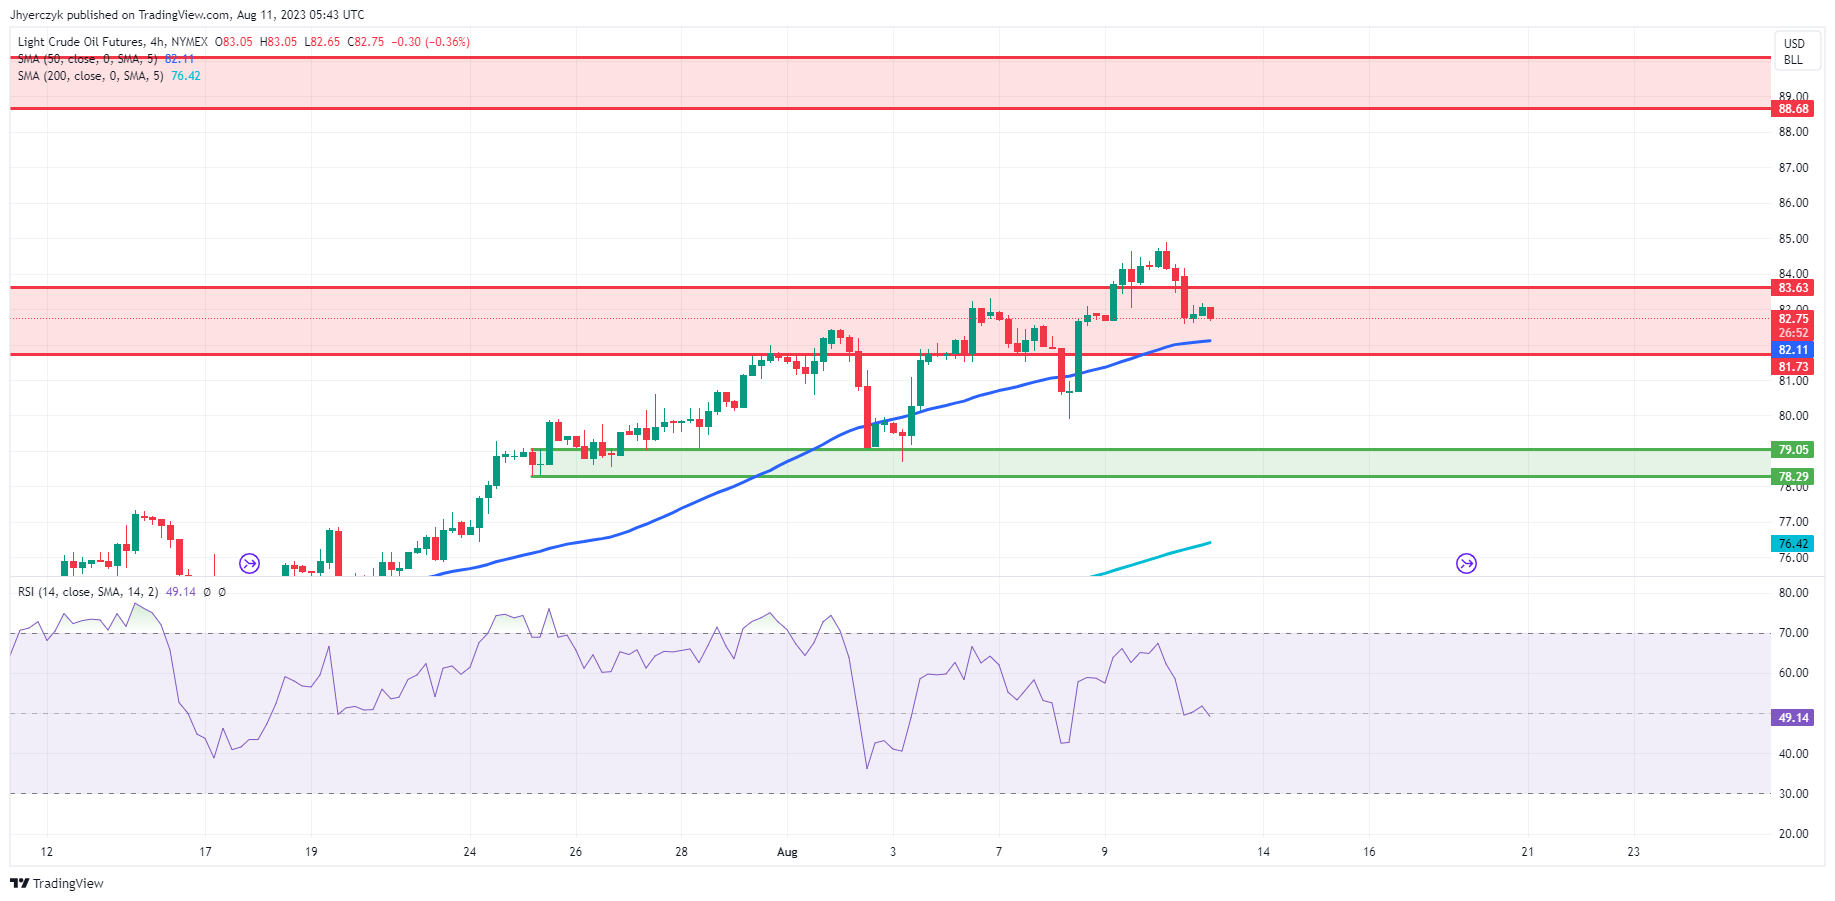
4-Hour Crude OilThe current price of $82.71 represents a mild retracement from the previous 4-hour price of $83.05. When compared to the 200-4H moving average at $76.42, the commodity is trading considerably above, highlighting a bullish longer-term trend. Yet, it’s positioned slightly above the 50-4H moving average of $82.11, suggesting recent momentum supports a potential upward move. The 14-4H RSI at 48.90 is slightly below the neutral 50 mark, pointing to a marginal decrease in bullish momentum.

The price is currently navigating between the main support area of $79.05 to $78.29 and the main resistance zone of $81.73 to $83.63.

Summarizing, Crude Oil’s short-term outlook appears modestly bullish, but traders should watch for potential resistance challenges ahead.

AUD to USD Forecast: US Producer Price Index to Deliver Sub-$0.65

AUD to USD Forecast: US Producer Price Index to Deliver Sub-$0.65

On Thursday, the AUD/USD fell by 0.20% to end the day at $0.65148. The US CPI Report dragged the Aussie dollar into negative territory.

This morning, there are no economic indicators from Australia or China to influence. The lack of economic indicators will leave the Aussie dollar in the hands of market risk sentiment throughout the morning session. Economic uncertainty stemming from weak economic indicators from China and the Fed threat remain headwinds.

Trading Derivatives carries a high level of risk to your capital and you should only trade with money you can afford to lose. Trading Derivatives may not be suitable for all investors, so please ensure that you fully understand the risks involved, and seek independent advice if necessary. A Product Disclosure Statement (PDS) can be obtained either from this website or on request from our offices and should be considered before entering into a transaction with us. Raw Spread accounts offer spreads from 0.0 pips with a commission charge of USD $3.50 per 100k traded. Standard account offer spreads from 1 pips with no additional commission charges. Spreads on CFD indices start at 0.4 points. The information on this site is not directed at residents in any country or jurisdiction where such distribution or use would be contrary to local law or regulation.

The US Session

It is another big day ahead, with US producer price index numbers and the Michigan Consumer Sentiment survey in focus. A more marked increase in the producer price index and improving consumer confidence would give the Fed more food for thought.

Economists forecast the producer price index to increase by 0.2% in July, following a 0.1% increase in June. However, economists expect the Michigan Consumer Sentiment Index to slip from 71.6 to 71.0.

The producer price index shows the direction of selling prices received by domestic producers. Significantly, the PPI includes selling prices from the first commercial transaction for products and services, a leading indicator for consumer price inflation. Upward trends in the producer price index signal a pickup in consumer inflationary pressures.

Beyond the economic calendar, investors should monitor the news wires for Fed chatter throughout the day.

AUD/USD Price Action

Daily Chart

The Daily Chart showed the AUD/USD hover at the lower level of the $0.6545 – $0.6526 support band. Significantly, the Aussie remained below the 50-day ($0.66668) and 200-day ($0.67325) EMAs, sending bearish near and longer-term price signals.

The 50-day EMA fell further from the 200-day EMA, sending bearish price signals.

Looking at the 14-Daily RSI, the 36.23 reading signals a bearish trend and supports a fall to sub-$0.65. However, an AUD/USD move through the 0.6545 – 0.6526 support band would give the bulls a run at the $0.6600 – $0.6620 resistance band.

AUD to USD Daily Chart sends bearish price signals.
AUDUSD 110823 Daily Chart

4-Hourly Chart

Looking at the 4-Hourly Chart, the AUD/USD hovers at the lower level of the $0.6545 – $0.6526 support band. Significantly, the AUD/USD remains below the 50-day ($0.65777) and 200-day ($0.66630) EMAs, sending bearish near and longer-term price signals.

The 50-day EMA pulled back from the 200-day EMA, a bearish price signal.

Looking at the 14-Daily RSI, the 42.29 reading signals a bearish trend and supports a fall to sub-$0.65. However, an AUD/USD move through the 0.6545 – 0.6526 support band would give the bulls a run at the 50-day EMA ($0.65777) and the $0.6600 – $0.6620 resistance band.

4-Hourly Chart affirms bearish price signals.
AUDUSD 110823 4-Hourly Chart
EUR/USD and $1.10 Hinged on US Producer Price Index Numbers

EUR/USD and $1.10 Hinged on US Producer Price Index Numbers

On Thursday, the EUR/USD rose by 0.06% to wrap up the day at $1.09808. The US CPI Report delivered a choppy afternoon session. While inflation numbers fell short of forecasts, core inflation remained sticky, capping the upside on the day.

Today, finalized July inflation figures from France will draw interest. The EUR/USD will likely respond to revisions, with no other economic indicators to consider this morning.

Trading Derivatives carries a high level of risk to your capital and you should only trade with money you can afford to lose. Trading Derivatives may not be suitable for all investors, so please ensure that you fully understand the risks involved, and seek independent advice if necessary. A Product Disclosure Statement (PDS) can be obtained either from this website or on request from our offices and should be considered before entering into a transaction with us. Raw Spread accounts offer spreads from 0.0 pips with a commission charge of USD $3.50 per 100k traded. Standard account offer spreads from 1 pips with no additional commission charges. Spreads on CFD indices start at 0.4 points. The information on this site is not directed at residents in any country or jurisdiction where such distribution or use would be contrary to local law or regulation.

With the European economic calendar on the light side, investors should track ECB chatter. However, no ECB Executive Board Members are on the calendar to speak today, leaving commentary with the media to move the dial.

The US Session

It is another big day ahead, with US producer price index numbers and the Michigan Consumer Sentiment survey in focus. A more marked increase in the producer price index and improving consumer confidence would give the Fed more food for thought.

Economists forecast the producer price index to increase by 0.2% in July, following a 0.1% increase in June. However, economists expect the Michigan Consumer Sentiment Index to slip from 71.6 to 71.0.

The producer price index shows the direction of selling prices received by domestic producers. Significantly, the PPI includes selling prices from the first commercial transaction for products and services, a leading indicator for consumer price inflation. Upward trends in the producer price index signal a pickup in consumer inflationary pressures.

Beyond the economic calendar, investors should monitor the news wires for Fed chatter throughout the day.

EUR/USD Price Action

Daily Chart

The Daily Chart showed the EUR/USD remained below the $1.1015 – $1.1060 resistance band. However, the EUR/USD held above the 50-day ($1.09742) and 200-day ($1.07990) EMAs, sending bullish near and longer-term price signals.

A EUR/USD hold above the 50-day EMA ($1.09742) would give the bulls a run at the $1.1015 – $1.1060 resistance band. However, a fall through the 50-day EMA would bring the $1.0900 – 1.0850 support band into play.

Looking at the 14-Daily RSI, the 48.17 reading sends moderately bearish price signals. The RSI suggests a fall through the 50-day EMA and the upper level of the $1.0900 – 1.0850 support band.

Daily Chart sends bullish price signals.
EURUSD 110823 Daily Chart

4-Hourly Chart

Looking at the 4-Hourly Chart, the EUR/USD sits below the $1.1015 – $1.1060 resistance band. The EUR/USD remains below the 50-day ($1.09920) and 200-day ($1.09981) EMAs, sending bearish near and longer-term price signals.

The 50-day EMA eased back from the 200-day EMA this morning, a bearish price signal. Failure to move through the EMAs would bring sub-$1.0950 and the $1.0900 – 1.0850 support band into play. However, a EUR/USD move through the EMAs would support a breakout from the $1.1015 – $1.1060 resistance band to target $1.11.

The 14-4H RSI at 50.07 sends moderately bullish EUR/USD price signals, with buying pressure outweighing selling pressure. Significantly, the RSI suggests a move through the EMAs to bring the $1.1015 – $1.1060 resistance band into play.

Price action today hinges on the US PPI Report and consumer sentiment.

4-Hourly Chart sends bearish price signals.
EURUSD 110823 4 Hourly Chart
Silver Price Forecast: XAG Slides Amidst Dollar’s Rise, CPI Surprises

Silver Price Forecast: XAG Slides Amidst Dollar’s Rise, CPI Surprises

Overview

Silver (XAG) prices, much like their golden counterparts, are struggling despite U.S. inflation figures that failed to meet expectations. As Friday rolls in, silver is poised to conclude one of its weakest seven-week periods, largely due to the formidable performance of the U.S. dollar and resilient bond yields.

CPI Misses Mark; Fed’s Response?

Delving into specifics, the U.S. Consumer Price Index (CPI) – a critical gauge of inflation – recorded a 3.2% annual increase. This fell short of Reuters’ anticipated 3.3%, fueling the speculation that the Federal Reserve might abstain from rate hikes in 2023. Dissecting the CPI further, core readings, which exclude volatile components like food and energy, have surged by 4.7% over the last year. Despite these nuances, the primary take-away is the overarching consensus that the Federal Reserve may maintain the status quo on policy rates come September. This decision will likely be influenced by the potential for slowing inflation, especially with the expected decline in robust shelter inflation.

Trading Derivatives carries a high level of risk to your capital and you should only trade with money you can afford to lose. Trading Derivatives may not be suitable for all investors, so please ensure that you fully understand the risks involved, and seek independent advice if necessary. A Product Disclosure Statement (PDS) can be obtained either from this website or on request from our offices and should be considered before entering into a transaction with us. Raw Spread accounts offer spreads from 0.0 pips with a commission charge of USD $3.50 per 100k traded. Standard account offer spreads from 1 pips with no additional commission charges. Spreads on CFD indices start at 0.4 points. The information on this site is not directed at residents in any country or jurisdiction where such distribution or use would be contrary to local law or regulation.

Mixed Sentiments Surround Rate Hikes

However, the market’s sentiment is far from unanimous. While many anticipate a steady stance from the Federal Reserve in its next assembly on September 20th, certain figures like Federal Reserve Bank Governor Michelle Bowman suggest that interest rate hikes might still be on the table. This dichotomy in perspectives is crucial for silver investors since rate hikes typically bolster bond yields, making non-yielding assets like silver less attractive.

Silver’s Rally Falters; Dollar Rises

Summing up the week’s trends, silver’s short-lived rally post the CPI revelation seemed to fizzle out. This wane in enthusiasm can be attributed to the broader market realization that a 4.7% core CPI isn’t particularly impressive. The U.S. dollar’s resurgence, propelled by comments from Fed member Mary Daly, further dented silver’s appeal. As we approach week’s end, silver remains under duress, echoing the patterns of the U.S. dollar index and 10-year Treasury bond yields – both aiming for their fourth straight week of gains. For traders, the immediate horizon for silver appears bearish, influenced heavily by macroeconomic cues and the Federal Reserve’s impending decisions.

Technical Analysis

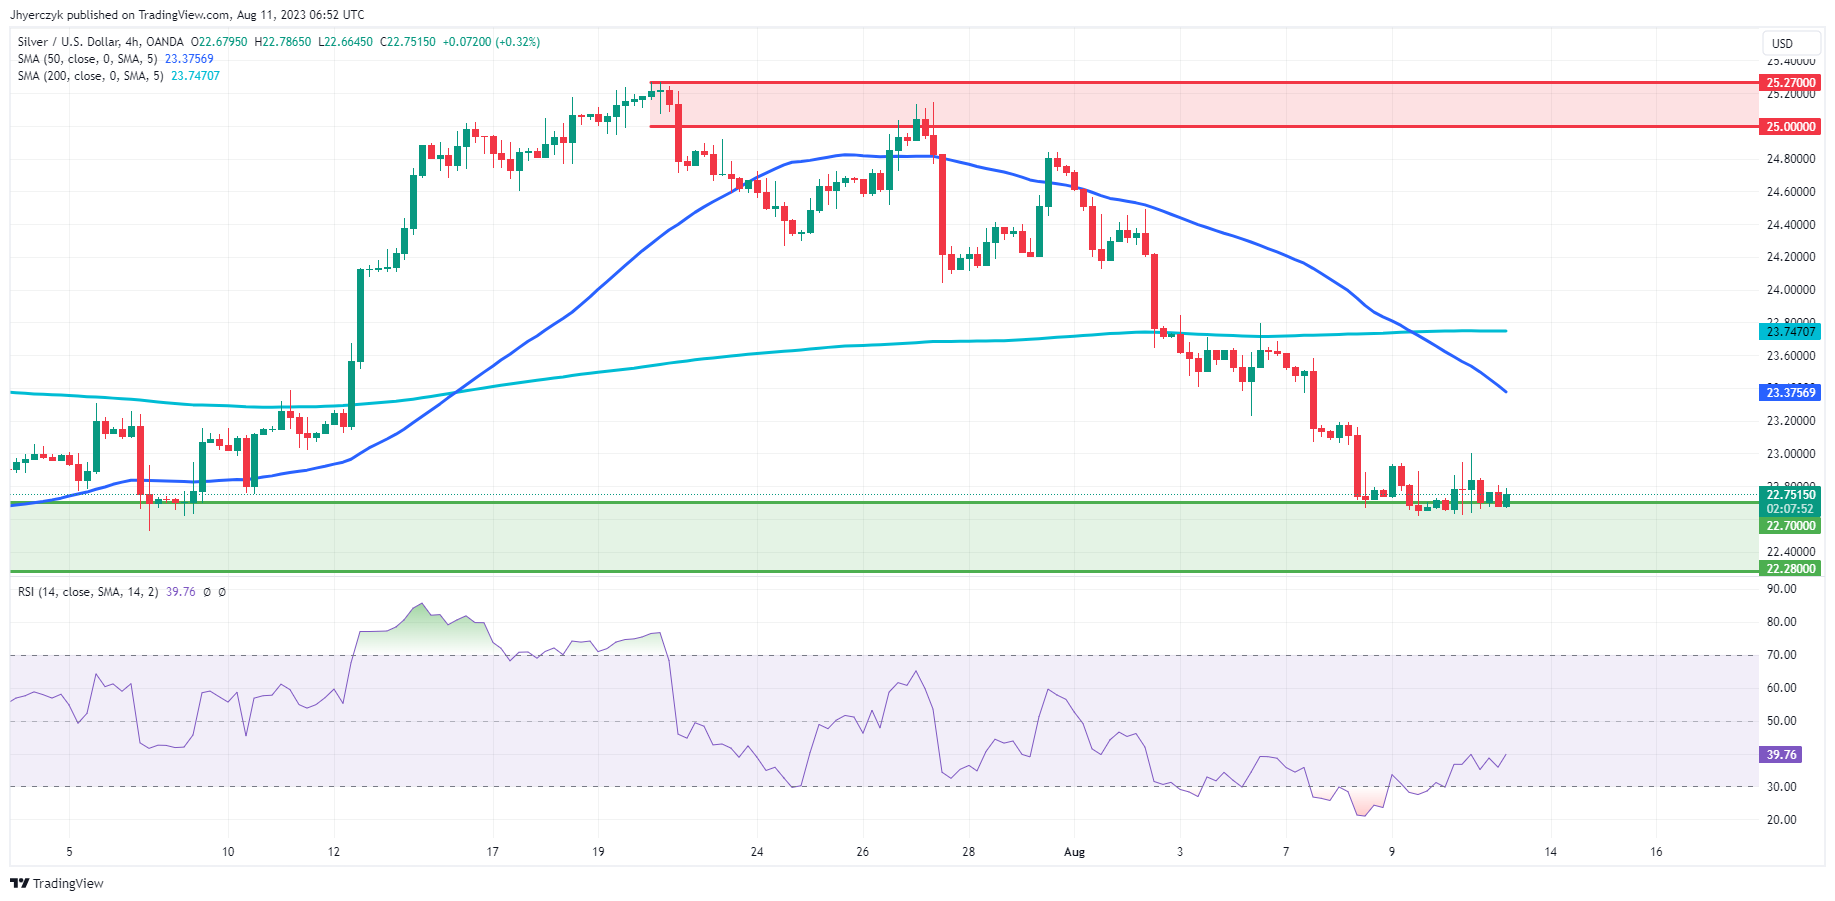
4-Hour Silver (XAGUSD)Based on the 4-hour chart data provided for Silver (XAG), the current price of 22.75 is slightly above the previous 4-hour price of 22.68, suggesting a minimal uptick.

However, the current price resides below both the 200-4H moving average of 23.72 and the 50-4H moving average of 23.38, indicating a bearish sentiment in the short-term. The 14-4H RSI stands at 40.13, slightly below the neutral 50 mark, suggesting weaker momentum.

Price-wise, Silver is hovering just above the main support area (22.70 to 22.28) and is considerably below the main resistance area (25.00 to 25.27). In conclusion, the current market sentiment for Silver on the 4-hour chart is bearish.

Gold Price Forecast: XAU Bearish with US Inflation, Fed’s Rate Stance in Focus

Gold Price Forecast: XAU Bearish with US Inflation, Fed’s Rate Stance in Focus

Overview

Gold (XAU) prices continue to linger near their one-month lows this Friday. This comes despite the recent cooler-than-expected U.S. inflation figures. The precious metal is set to record its most challenging week in nearly two months, impacted by the robust performance of the U.S. dollar and bond yields. Spot gold saw a minor increase of 0.1% to reach $1,913.95 per ounce, hovering close to its lowest since early July. On the flip side, U.S. gold futures experienced a slight dip.

U.S. CPI Rise Affects Gold

The backdrop for this decline was Thursday’s revelation. The U.S. Consumer Price Index (CPI) witnessed a 3.2% year-on-year rise, falling just short of the anticipated 3.3%. This development has fueled speculation that the U.S. Federal Reserve may not opt for another interest rate hike in 2023. It’s pivotal to note that hikes in interest rates can dampen gold’s appeal. These hikes can elevate bond yields, subsequently increasing the opportunity cost of possessing non-yielding assets like gold.

Trading Derivatives carries a high level of risk to your capital and you should only trade with money you can afford to lose. Trading Derivatives may not be suitable for all investors, so please ensure that you fully understand the risks involved, and seek independent advice if necessary. A Product Disclosure Statement (PDS) can be obtained either from this website or on request from our offices and should be considered before entering into a transaction with us. Raw Spread accounts offer spreads from 0.0 pips with a commission charge of USD $3.50 per 100k traded. Standard account offer spreads from 1 pips with no additional commission charges. Spreads on CFD indices start at 0.4 points. The information on this site is not directed at residents in any country or jurisdiction where such distribution or use would be contrary to local law or regulation.


Core CPI’s Growth Lags Expectations

However, there’s a nuance to the CPI data. While the core CPI’s growth rate of 4.7% was slower than projected, it still isn’t an ideal figure. The gold market responded with a lukewarm rise, signaling a lack of firm conviction among traders. Additionally, comments from Fed member Mary Daly introduced further ambiguity. She hinted that decisions regarding future rate adjustments, be it maintaining or hiking, remain undecided.

Bearish Short-Term Outlook

In summary, as the week draws to a close, gold prices have diminished by approximately 1.4%. Concurrently, the U.S. dollar index and 10-year Treasury bond yields are both on a path to mark their fourth successive weekly ascent. Given the prevailing circumstances and market dynamics, the short-term outlook for gold leans bearish.

Technical Analysis

4-Hour Gold (XAU)Gold (XAU) is currently trading at 1916.05, a slight increment from its prior 4-hour close of 1913.54, showing minimal upward movement. In comparison to the 200-4H moving average of 1940.77, the precious metal is trading below this threshold, indicating bearish sentiment. The same can be inferred when looking at the 50-4H moving average of 1933.14; the current price remains below this average as well. The 14-4H RSI stands at 40.02, suggesting a weakening momentum but not yet reaching the oversold territory.

With the current price closely grazing the main support area ranging from 1914.00 to 1902.75, and being considerably below the main resistance range of 1979.00 to 1987.53, it suggests that gold is under bearish pressure for the short-term.

UK GDP Numbers Open the Door for More BoE Rate Hikes

UK GDP Numbers Open the Door for More BoE Rate Hikes

It was a busy start to the day on the European economic calendar. UK GDP numbers for the second quarter, industrial and manufacturing production, and trade data drew interest this morning.

The UK economy expanded by 0.5% in June and 0.2% in the second quarter. Year-over-year, the economy grew by 0.4%. Industrial production jumped by 1.8%, driven by a 2.4% surge in manufacturing production.

Economists forecast manufacturing production to increase by 0.2% in June. However, economists expected the UK economy to stall in the second quarter after expanding by 0.1% in the previous quarter. Economists forecast the economy to grow by 0.2% in June.

According to the Office for National Statistics,

  • The services sector saw growth of 0.1% in the quarter, with the production sector expanding by 0.7%.
  • Household and government consumption drove growth in expenditure, partially offset by a fall in international trade.
  • In the second quarter, real household expenditure increased by 0.7%, with government consumption expenditure up 3.1%.
  • Export volumes declined by 2.5% in the second quarter, with services exports down 4.0%.
  • Import volumes increased by 1.0%, driven by a 1.7% increase in goods imports, mainly machinery and transport equipment.

The latest GDP number will allow the Bank of England to target wage growth and elevated inflation with more interest rate hikes. On Monday, Bank of England Chief Economist Huw Pill held a live monetary policy report Q&A session. Significantly, Huw Pill noted that food inflationary pressure may not subside, suggesting more rate hikes.

GBP to USD Reaction to the UK GDP Report

Before the UK GDP Report, the GBP to USD fell to an early low of $1.26664 before rising to a pre-GDP Report high of $1.26908.

However, in response to the UK GDP Report, the GBP to USD fell to a post-stat low of $1.26847 before rising to a high of $1.27116.

This morning, the GBP to USD was up 0.25% to $1.27082.

GBP/USD responds to the UK GDP Report.
110823 GBPUSD Hourly Chart

Next Up

Later in the session, NIESR GDP estimates will also move the dial.

However, investors must also consider the US economic calendar. US producer price numbers and the Michigan Consumer Sentiment survey will be in focus. A more marked increase in the producer price index and improving consumer confidence would give the Fed more food for thought.

Economists forecast the producer price index to increase by 0.2% in July, following a 0.1% increase in June. However, economists expect the Michigan Consumer Sentiment Index to slip from 71.6 to 71.0.

Beyond the economic calendar, investors should monitor the news wires for Fed chatter throughout the day.