Gold Price Outlook Steadies After a Test Lower that May Prove Pivotal. Higher XAU/USD?

Gold Price Outlook Steadies After a Test Lower that May Prove Pivotal. Higher XAU/USD?

Gold has tried lower but rallied off the floor after the US Dollar took a turn in the aftermath of rate decisions from the Federal Reserve and the European Central Bank this week.

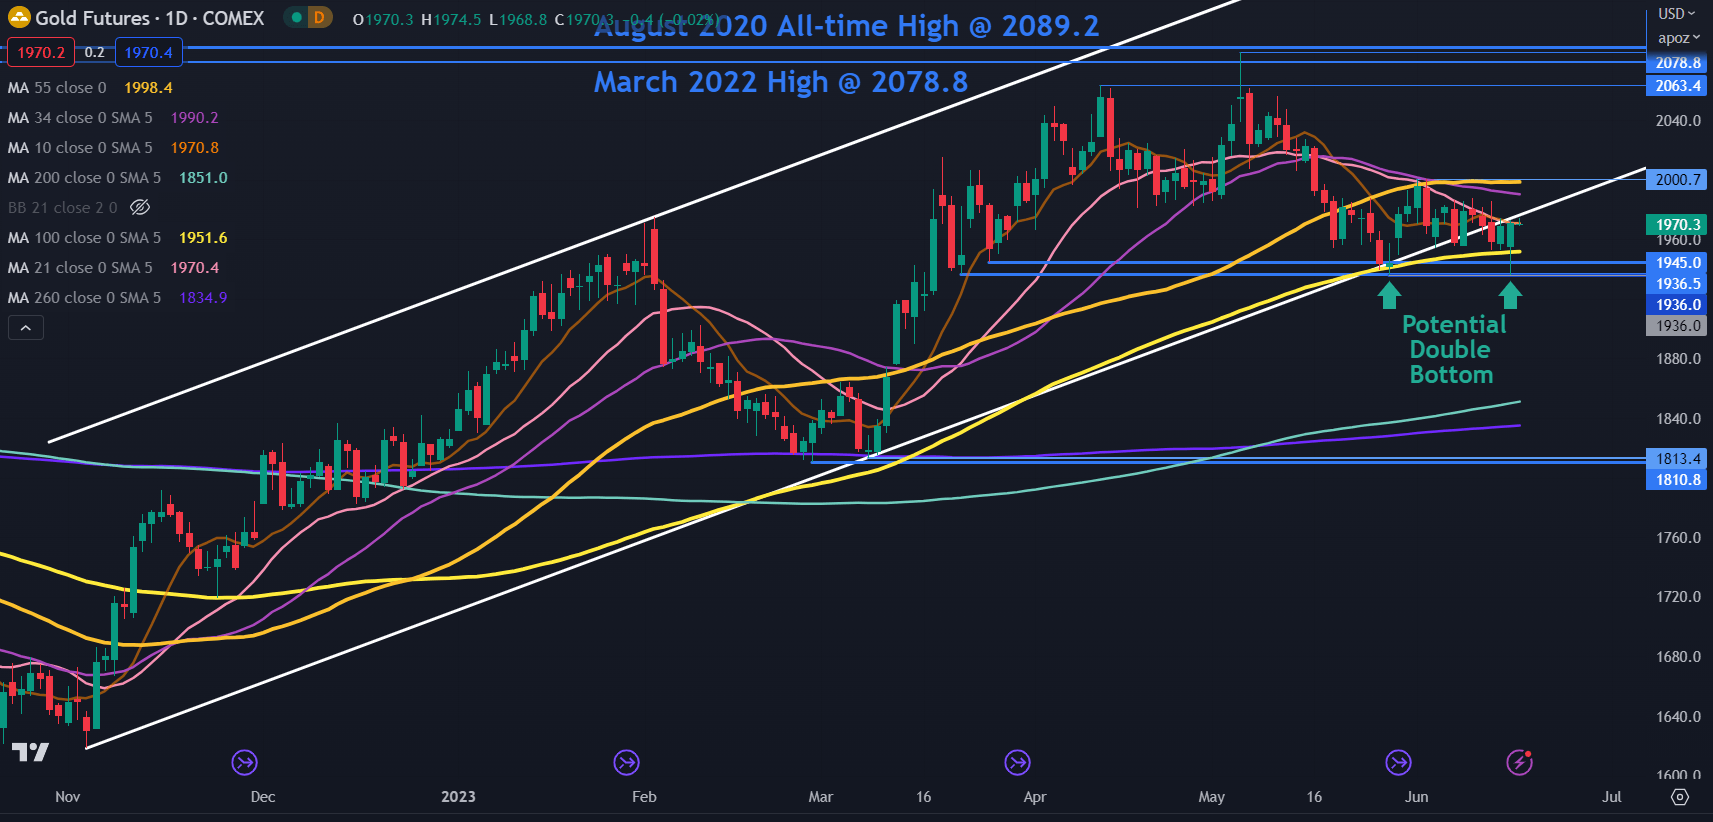
GC1 (GOLD FRONT FUTURES CONTRACT) TECHNICAL ANALYSIS

Gold’s recent dip below an ascending trend line and subsequent test of support levels in the 1936 – 1945 area might ask more questions than it answers.

Thursday’s low of 1936 has set up a potential Double Bottom that coincides with a previous low. The potential Double Bottom could be confirmed should it move above the neckline at 2000.

The push lower went under the 100-day Simple Moving Average (SMA) but the daily close was back above it.

This may suggest that recent bearishness could have been rejected by the market for now and that the 1936 – 1945 zone might remain supportive.

A clean break below that area may see a bearish run evolve, and the next support zone of note could be at the next Double Bottom of 1811 and 1813.

While the price is above the 100-, 200- and 260-day SMAs, it remains below all other shorter-period SMAs. If gold gets above the 55-day SMA, currently dissecting at 2000, it will be above all period daily SMAs, which may suggest that bullish momentum is evolving.

This potentially opens up 2000 as a critical level for gold to overcome if it is to reignite bullish momentum.

If it does break above 2000, it could run for the crucial resistance zone ahead of the all-time high.

The early May high of 2085 eclipsed the March 2022 peak of 2079 but was unable to overcome the all-time high of 2089. This failure to break new ground to the upside has created a Triple Top which is an extension of a Double Top formation.

This has set up a potential resistance zone in the 2080 – 2090 area but a snap above those levels may indicate further evolving bullishness. The next level of resistance could be at the upper ascending trend channel line that is currently near 2190.

image1.png


The CPI and Forex: How CPI Data Affects Currency Prices

The CPI and Forex: How CPI Data Affects Currency Prices

What is CPI and why does it matter to forex traders?

The Consumer Price Index, better known by the acronym CPI, is an important economic indicator released on a regular basis by major economies to give a timely glimpse into current growth and inflation levels.

Inflation tracked through CPI looks specifically at purchasing power and the rise of prices of goods and services in an economy, which can be used to influence a nation’s monetary policy.

CPI is calculated by averaging price changes for each item in a predetermined basket of consumer goods, including food, energy, and also services such as medical care.

It is a useful indicator for forex traders due to its aforementioned effect on monetary policy and, in turn, interest rates, which have a direct impact on currency strength. The full utility of knowing how to interpret CPI as a forex trader will be explored below.

CPI release dates

CPI release dates usually occur every month, but in some countries, such as New Zealand and Australia, quarterly. Some nations also offer yearly results, such as Germany’s index. The US Bureau of Labor Statistics has reported the CPI monthly since 1913.

The following table shows a selection of major economies and information about their CPI releases.

Country/jurisdiction Compiling body Frequency of releases
Australia Australian Bureau of Statistics Quarterly
Canada Statistics Canada Monthly
China National Bureau of Statistics of China Monthly
Eurozone European Central Bank Twice monthly
Germany Federal Statistical Office of Germany Monthly, yearly
Italy Istat Monthly
India Ministry for Statistics and Programme Implementation Monthly
Japan Statistics Japan Monthly
UK Monetary Policy Committee Monthly
US US Bureau of Labor Statistics Monthly

Why forex traders should follow CPI data

Understanding CPI data is important to forex traders because it is a strong measure of inflation, which in turn has a significant influence on central bank monetary policy.

So how does CPI affect the economy? Often, higher inflation will translate to higher benchmark interest rates being set by policymakers, to help dampen the economy and subdue the inflationary trend. In turn, the higher a country’s interest rate, the more likely its currency will strengthen. Conversely, countries with lower interest rates often mean weaker currencies.

The release and revision of CPI figures can produce swings in a currency’s value against other currencies, meaning potentially favorable volatility from which skilled traders can benefit.

Also, CPI data is often recognized as a useful gauge of the effectiveness of the economic policy of governments in response to the condition of their domestic economy, a factor that forex traders can consider when assessing the likelihood of currency movements.

The CPI can also be used in conjunction with other indicators, such as the Producer Price Index, for forex traders to get a clearer picture of inflationary pressures.

What to consider when trading forex against CPI data

When using CPI data to influence forex trading decisions, traders should consider the market expectations for inflation and what is likely to happen to the currency if these expectations are met, or if they are missed.

Similar to any major release, it may be beneficial to avoid having an open position immediately before. Traders might consider waiting for several minutes after the release before looking for possible trades, since forex spreads could widen significantly right before and after the report.

Below is a chart displaying the monthly inflation rates for the US. For the latest month, expectations are set at 1.6% inflation compared to last year’s data. If CPI is released higher or lower than expectations this news event does have the ability to influence the market.
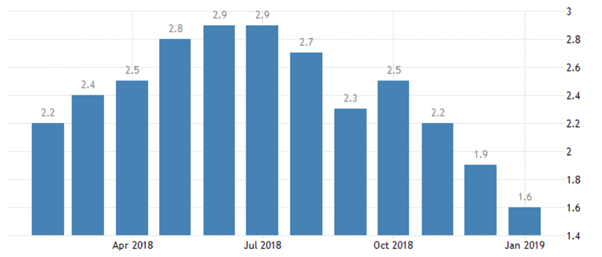
Chart to show US inflation levels in 2018/19. Source: TradingEconomics.com. US Bureau of Labor Statistics

One way the effects of CPI data can be interpreted is by monitoring the US Dollar Index, a 2018/19 example chart for which is below. If CPI is released away from expectations, it is reasonable to believe this may be the catalyst to drive the Index to fresh highs, or to rebound from resistance.

Since the Index is comprised of EUR/USD, USD/JPY, and GBP/USD, by watching the US Dollar we can get a full interpretation of the events outcome.
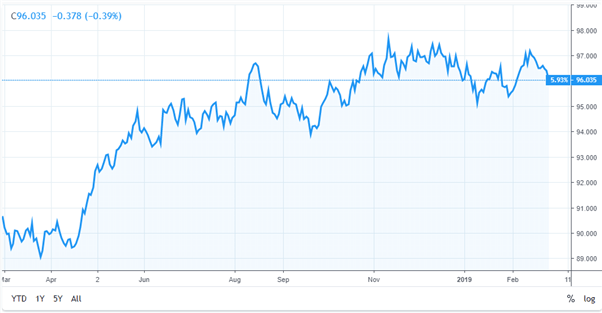
Chart to show movement in the US Dollar Index. Source: TradingView.com

As can be observed in the example above, as inflation rose during the first half of 2018, the US Dollar Index went up accordingly. But with US inflation drifting lower in the following months and with a missed target of 2%, this pushed US interest rate hikes off the agenda. As a result, the dollar struggled and weakened against a basket of other currencies.

Not every fundamental news release works out through price as expected.

Once the CPI data has been released and analyzed, traders should then look to see if the market price is moving through or rebounding off any areas of technical importance. This will help traders understand the short-term strength of the move and/or the strength of technical support or resistance levels, and help them make more informed trading decisions.

Read more on CPI, inflation and forex

Make sure you bookmark our economic calendar to stay tuned in to the latest CPI data released by a range of countries, and stay abreast of all the DailyFX news and analysis updates. Also, reserve your place at our Central Bank Weekly webinar series to learn about news events, market reactions, and macro trends.

For more information on inflation and its impact on forex decisions, take a look at our article Understanding Inflation for Currency Trading.

Big Mistake Leads Technical Trader to Top Three Tools

Big Mistake Leads Technical Trader to Top Three Tools

I’ve been trading the markets for nearly 20 years – There’s been ups and down. Along the way you try to find what style trading works best for your personality and goals. Sometimes this process can be orderly and structured- it wasn’t for me.

The 116 Death Trap

Developing your strategy comes at a cost –often a lot of time, money and frustration. I came to this realization in 2003 as USD/JPY was pulling back from multi-year highs. The ‘116 death trap,’ as I’ve dubbed it, was a seemingly rock solid zone of support. It had caught the lows since 2001 with numerous defenses suggesting a perfect opportunity for me to ‘catch the lows’ and cost average in. Even when price broke, my hope was that every rebound was the low. Not quite. In September of 2003, the death trap began with a drop of more than 12% over the next year, taking USD/JPY to lows not seen since the late-90s. Even a glimmer of hope offered by a multi-week rally in early 2004 reversed. With the pain finally too hard to tolerate, I exited at the lows. So much for cost averaging into a loser. That was my hard lesson learned.

USD/JPY Daily Price Chart

Where did I go wrong?

Well, there was a lot, but for starters, emotions are not your friend. Most of all, my error was not having a plan and not recognizing market conditions. Knowing the style of trading that works best for your personality, risk tolerance and goals is critical and without a plan you are on a ship without a rudder.

Everyone comes to this realization differently. I learned through years of managing market flow for one of the first brokers to offer online retail FX trading. It was through close observations of retail market flow and tracking near-term price-action that Ideveloped three basic principles for my technical trading strategy. It boils down to assigning a value for price, time and momentum.

Price Value – Key reversals, Fibonacci, High/Low-day Closes

It’s all about the levels – identifying support / resistance is a critical part of being able to create actionable trade ideas targeting or countering key levels in price. These lateral levels can be identified using various methods. The three I rely on most are key reversals (outside-day reversals), high and low-day closes and Fibonacci.

The word “Fibonacci” often appears in trading and it is likely that you have already seen or heard of it — for good reason. It is a simple measurement based on the golden ratio of 61.8%. This ratio can be observed everywhere in nature from trees to galaxy formations and is also very relevant to buying and selling behavior in markets. It is a tool you can implement in both trending and range-bound markets to help identify areas of possible support / resistance. We have a lot more in the education section: Fibonacci Application in Financial Markets (dailyfx.com)

One discipline I rely heavily on is pitchfork and median-line analysis. The goal of this style of analysis is to identify the slope or gradient of a given market in an attempt to highlight when a price level may be significant. It is this time value that adds another dimension to the lateral levels identified earlier – these “confluence zones” are often points in price and time that can offer major pivots in near-term price-action. Trading into / off these inflection points todayform the basis of my favored technical trade setups.

Momentum value – RSI

The speed of a market can tell The Relative Strength Index (RSI). The RSI is an oscillator that is used as a measure of momentum — the speed of the recent price movement in either direction. While all oscillators are inherently backward looking, they can still be of value when you are trying to asses when the market maybe overextended in either the overbought or oversold conditions. The ability to assess the inertia of a given market is critical for near-term swing and trend trading as it offers a window into the possible longevity and strength of a given move as well as ideas on when it may expire.

Bottom line

Having a multi-faceted approach that takes into account price value, momentum value and time value could help steer you not only to possible opportunities, but also help you avoid failure. Knowing the condition of the market using price, time and momentum has been a major philosophy of my trading.

Federal Reserve pushes pause on interest rate hikes

Federal Reserve pushes pause on interest rate hikes

For the first time since beginning the current tightening cycle in March 2022, the Fed opted against raising the federal funds rate at the June 14, 2023, FOMC meeting. The decision officially ends a run of 10 consecutive interest rate hikes by the central bank.

While the move was expected, the Fed’s release of its summary of economic projections signifies that its hawkish tone on curbing inflation remains intact, as additional rate hikes in 2023 are projected, and the federal funds rate was pushed out to 5.6% by year-end, up from March’s 5.1% year-end projection.

“The Fed’s new dot-plot forecast of potentially higher interest rates in 2023 suggests it is too early for the Fed to claim victory over inflation,” said Raymond James Chief Investment Officer Larry Adam. “However, given the recent disinflationary trends in place, especially with the recent deceleration in CPI and PPI we have seen this week, we still believe the Fed is in the latter stages, if not near the end, of this tightening cycle.”

The updated dot plot also speaks to the Fed’s continued hawkishness. The median federal funds rate for the end of 2024 increased from 4.1% in March to about 4.4% in June.

“As we’ve stated previously, it is clear that the Fed is convinced that in order to prevent markets from bringing longer-term interest rates down, it needs to continue to push the federal funds rate, which is the only interest rate it controls, higher,” said Raymond James Chief Economist Eugenio Alemán.

The Personal Consumptions Expenditures (PCE) inflation forecast moved a touch lower, from 3.3% in March to 3.2% in June, while Core PCE increased from 3.6% in March to 3.9% in June.

The decision to pause keeps the Fed’s cumulative total increase over the last 15 months to 500 basis points (bps), and the federal funds rate remains 5.00%-5.25%, the highest range in the past 15 years.

“In our opinion, there is no question that the economic data – for example, slowing inflation, rising jobless claims and below-trend growth – are moving in the direction the Fed wants. [The movement] is just not happening at the pace that [the Fed] wants,” said Adam. “The big question is how much patience the Fed has to allow the disinflationary trend to continue before tightening further. Lifting the potential fed funds rate ‘dot’ for 2023 allows the Fed more flexibility to remain balanced in the event the disinflationary path stalls.”

Yen Falls to 7-Month Low as Traders Shift Focus From Fed to BOJ

Yen Falls to 7-Month Low as Traders Shift Focus From Fed to BOJ

The yen weakened to its lowest since November against the dollar as traders shifted their focus from a hawkish Federal Reserve to Friday’s Bank of Japan policy decision.

The relatively hardline stance from Fed officials on Wednesday stands in sharp contrast to BOJ policymakers who have stuck with monetary easing even as most global peers tighten, a disparity that favors the US currency. The Fed projected borrowing costs will go higher than previously seen, while almost all of the economists surveyed by Bloomberg see the BOJ leaving its ultra loose policy unchanged Friday.

The Japanese currency fell 1% to around 141.50 per dollar, even after Chief Cabinet Secretary Hirokazu Matsuno said that excessive movements weren’t desirable. Last month when the yen weakened to similar levels, top currency official Masato Kanda said that the government would take action if needed, after an unscheduled meeting between the BOJ, Ministry of Finance and Financial Services Agency.

“The trend for the yen to weaken amid no policy change by the BOJ, in combination with a more hawkish Fed, is likely to continue for a while,” said Tsutomu Soma, a bond and currency trader at Monex Inc. “The authorities may verbally intervene as the yen continues to weaken but actual intervention is unlikely as there’s some benefit from it for the nation, such as higher stock prices.”

The benchmark US Treasury yield climbed 4 basis points to 3.83% in Asia trading Thursday, with its Japanese counterpart little changed at 0.42%. The widening gap between the two played a huge part in pushing the yen to a three-decade low last year.

Demand for the dollar was also likely influenced by Japanese importers, who typically buy the greenback on trading days that are a multiple of five such as the 10th, 15th and 20th of any month.

Looking ahead to Friday, BOJ officials likely see little need to adjust their yield curve control program given some improvement in the functioning of the bond market, according to people familiar with the matter. Governor Kazuo Ueda said earlier this month that the BOJ has consistently stated it will maintain easing until its price goal is achieved in a stable manner, feeding further into speculation the central bank will stay pat in coming months.

BOJ’s Ueda Likely to Hold With Bond Market on His Side for Now

Last year, the yen weakening toward 146 per dollar triggered Japan’s first intervention to prop up the currency since 1998, though in the build up to that there were repeated official warnings about direct action. The Japanese currency has fallen more than 7% this year.

“A sustained break above 141 opens the door for levels above 142 to be tested and potentially quite quickly,” said Rodrigo Catril, strategist at National Australia Bank Ltd. in Sydney. “Intervention is unlikely to do much to arrest yen weakness, it merely offers an opportunity to reset shorts.”

ECB tipped to hike rates again, as Fed hits pause

ECB tipped to hike rates again, as Fed hits pause

FRANKFURT: The European Central Bank is expected to again hike interest rates on Thursday and signal that the fight against inflation is not over yet, analysts said, even as the eurozone falls into recession.

With inflation slowing but still three times above the ECB’s two-percent target, there is little doubt the Frankfurt institution will raise borrowing costs for an eighth consecutive time.

A 0.25-percentage-point hike “looks like a done deal”, Capital Economics economist Jack Allen-Reynolds said.

More interesting to investors will be any clues from president Christine Lagarde at her afternoon press conference in Frankfurt about how much higher rates will go – or if a pause might be on the horizon.

The Federal Reserve, which began lifting rates earlier than the ECB, on Wednesday opted to stand pat after 10 straight increases.

But the US central bank also indicated that further rate rises could be needed this year.

The ECB embarked on an unprecedented campaign of monetary tightening after Russia’s war in Ukraine sent food and energy prices soaring, raising its interest rates by 3.75 percentage points since last July.

Another 25-basis-point hike on Thursday would take the ECB’s closely watched deposit rate to 3.50 percent.

‘No evidence yet’

Eurozone inflation eased to 6.1 percent in May year on year, from a peak of 10.6 percent in October, mainly thanks to rapidly declining energy prices.

But closely watched core, or underlying, inflation – which strips out volatile food and energy prices – decelerated only slightly to 5.3 percent, from 5.6 percent in April.

“There is no clear evidence that underlying inflation has peaked,” Lagarde warned earlier this month, stressing that the ECB still had “ground to cover” on rates.

Like all central banks, the ECB has to walk a fine line in raising interest rates sufficiently to dampen demand and contain inflation, without provoking a sharp economic slowdown in the process.

Higher borrowing costs have already led to a plunge in demand for credit from households and companies, recent data showed, suggesting the ECB’s moves are having an impact.

No pause in sight as ECB eyes next rate hike

But the eurozone economy has proved less resilient than initially thought.

Revised data last week showed that the economy in the 20-nation currency union shrank by 0.1 percent for two straight quarters at the end of 2022 and the start of 2023, meeting the technical definition of a recession.

While still mild, the surprise winter recession has cast doubt on more optimistic predictions for 2023.

‘Heated summer debate’

The ECB will unveil its latest economic forecasts on Thursday, likely to show a downward revision for growth.

The recent disappointing economic data and slowing inflation could strengthen the case of the “doves” among ECB policymakers against tightening much further, analysts said.

But the “hawks” may point to strong wage growth in the eurozone and stubbornly high core inflation to warn against taking the foot off the gas too early.

Senior policymakers including Lagarde have also expressed concern about corporate profits worsening inflation, suggesting some companies were raising prices even as their costs have come down.

Berenberg economist Holger Schmieding predicted “a heated summer debate” between the hawks and the doves, but said “a final rate hike” of another 25 basis points at the next meeting in July seemed likely.

The ECB “will play it safe and follow up with another interest rate hike in July”, agreed Fritzi Koehler-Geib, chief economist at public lender KfW.

EUR/USD: ECB will have to out-hawk the Fed to tempt buyers to reload longs – SocGen

EUR/USD: ECB will have to out-hawk the Fed to tempt buyers to reload longs – SocGen

Economists at Société Générale discuss EUR/USD outlook ahead of the European Central Bank (ECB) Monetary Policy Decision.

ECB could tempt buyers on Euro dip after gains fizzled out following Fed pause

The ECB will have to out-hawk the Fed today to tempt buyers to reload EUR/USD longs.

The pair understandably wavered after the Fed decision but a 25 bps hike today by the ECB and prospect of another increase in July and possibly September means the policy rate and bond yield differentials will narrow, provided the Fed holds fire.

Downside risks to the currency outlook stem essentially from the rally in risk assets fizzling out and European economic growth languishing compared to the US.

The technical recession and stagflationary backdrop do not quite enhance the appeal of the single currency or European risk assets (making abstraction of relative valuations), but in a FX regime where rate differentials are governing the price action, there is a tactical case for EUR/USD to target higher levels.

EUR/USD trades with modest losses above 1.0800 ahead of ECB

EUR/USD trades with modest losses above 1.0800 ahead of ECB

EUR/USD is trading under pressure while defending 1.0800, following an early uptick to the 1.0850 region. The pair consolidates losses, as the US Dollar bulls take a breather after the Fed’s hawkish pause-led upswing. All eyes remain on ECB policy announcements.

The EUR/USD rose again, posting its highest daily close in a month above 1.0800, despite the US Dollar’s recovery triggered by the hawkish hold from the FOMC. Attention now turns to the European Central Bank (ECB) meeting and upcoming US data, which could become more relevant given Fed Chair Powell’s statement that the July meeting will be a ‘live’ meeting.”

The ECB will have its Governing Council meeting on Thursday. It is expected to hike interest rates by 25 basis points. The key for the Euro will be the language used in the statement and ECB President Lagarde’s comments during the press conference. Probably, she will repeat that they are not done raising rates. If the meeting turns out to be ‘dovish’, with signals of a potential pause, the Euro could suffer.

The US dollar recovered ground after the Fed meeting, during which the central bank kept interest rates unchanged but signaled that it is not done hiking rates. The hawkish tone weighed on Treasury bonds and boosted the greenback. Fed Chair Jerome Powell stated that the July meeting will be a “live meeting”, keeping more rate hikes on the table. According to their projections, most FOMC members see another 50 basis points of tightening by year-end

During the Asian session, markets will continue to digest the Fed’s decision and will likely be the key driver until the ECB meeting. Also, key economic data from the US is due on Thursday, particularly Retail Sales, Jobless Claims, and the Philly Fed Index.

New Zealand Dollar Dips on Soft GDP Data. Where to for NZD/USD?

New Zealand Dollar Dips on Soft GDP Data. Where to for NZD/USD?

The New Zealand Dollar fell in response to GDP today after a stellar run higher on the back of a sliding US Dollar. The S&P/NZX 50 equity index is slightly in the green so far today.

The quarterly number was in line with expectations, but the annual read saw some downward revisions.

1Q quarter-on-quarter GDP came in at -0.1% as forecast and against the previous -0.7% that was revised down from -0.6%. Prior quarters also saw downward revisions.

Annual GDP to the end of March was 2.2% rather than the 2.6% anticipated and 2.2% previuosly.

Prior to the GDP data, the real estate institute of New Zealand (REINZ) revealed that house sales slipped -0.4% year-on-year to the end of May. A notable improvement on the April figure of -15. 3%.

Yesterday, Statistics New Zealand data revealed food prices rose by 0.3% month-on-month in May against 0.5% previously. This made for an increase of 12.1% year-on-year to the end of May, slightly below the prior of 12.5% which was the highest read in 36 years.

Earlier in the week, Statistics New Zealand also revealed that there were net 72,300 migrant arrivals in the year ended in April. This was composed of 98,400 migrant arrivals of non-NZ citizens and 26,100 migrant departures of NZ citizens.

The addition might go some way to alleviate the tight labour reflected by the historically low unemployment rate of 3.4%.

All of this stacks up for a delicate dance that the RBNZ will need to trot in order to avoid a deep recession when they next meet on July 12th. The general criteria for a recession is defined as two consecutive quarters of negative growth.

Annual CPI is running at 6.7% and while there has been a deceleration, it is stubbornly high at a time when economic activity is slowing down. The overnight index swaps (OIS) market is pricing no more hikes by the bank this year, leaving the overnight cash rate (OCR) at 5.50%.

For the New Zealand, Dollar, sways in the US Dollar might continue to impact direction, judging by the reaction to last night’s Federal Open Market Committee (FOMC) meeting.

The Fed left rates unchanged, and the ensuing statement appears to have been interpreted as remaining hawkish with a lift in the so-called dot plot. Not long after, Fed Chair Jerome Powell spoke at the press conference and his remarks seem to have been seen with a dovish spin.

The next FOMC is July 26th and there is a mountain of data points between now and then that the market will need to take onboard, as well as Fed commentary along the way.

NZD/USD REACTION TO THE FED DECISION AND NZ GDP