Singapore: Inflation lost momentum in March – UOB

Singapore: Inflation lost momentum in March – UOB

Senior Economist at UOB Group Alvin Liew reviews the latest inflation figures in Singapore.

Key Takeaways

“Headline and core CPI inflation eased and further converged in Mar 2023. Headline CPI rose by 0.5% m/m NSA, from 0.6% in Jan. Despite the m/m increase, CPI inflation rose at a slower pace of 5.5% y/y in Mar (from 6.3% in Feb). Similarly, core inflation (which excludes accommodation and private road transport) rose sequentially in Mar by 0.2% m/m (after staying flat in Feb at 0.0% m/m). Core inflation, like the headline, also eased noticeably in Mar despite the sequential increase, coming in at 5.0% y/y (from 5.5% y/y in Feb).”

“Inflation Outlook – The MAS kept its inflation forecasts (that were first made in the 14 Oct 2022 MPS) unchanged in today’s Mar CPI report, just as it did in the recent Monetary Policy Statement release (14 Apr). The central bank stated that “MAS Core Inflation will stay elevated in the next few months, as accumulated business costs continue to feed through to consumer prices”, and it also expected core inflation “to slow more discernibly in the second half of this year.”  The MAS also noted both upside and downside risks to inflation (versus just upside risks previously in the Feb 2023 CPI report). We continue to expect headline inflation to average 5.0% and core inflation to average 4.0% in 2023. Excluding the 2023 GST impact, we expect headline inflation to average 4.0% and core inflation to average 3.0%.”

EUR/USD retreats toward 1.1000 ahead of US data

EUR/USD retreats toward 1.1000 ahead of US data

EUR/USD is easing toward 1.1000 in the European session, having failed to sustain above 1.1050. The pair is heading south, as the US Dollar finds its feet amid a cautious market mood. Investors weigh ECB-speak, US consumer data and tech earnings ahead.

EUR/USD turned south after the Relative Strength Index (RSI) indicator on the four-hour chart rose above 70, suggesting that the pair’s latest pullback is a technical correction.

On the downside, 1.1000 (psychological level, static level, 20-period Simple Moving Average (SMA) and 50-period SMA) aligns as important support. A four-hour close below that level could attract technical sellers and trigger an extended decline toward 1.0950 (100-period SMA, Fibonacci 23.6% retracement) and 1.0900 (psychological level, static level).

1.1050 (static level) acts as interim resistance before 1.1075 (end-point of the latest uptrend) and 1.1100 (psychological level).

EUR/USD has staged a technical correction and declined below 1.1050 in the European morning after having touched a fresh 10-day high near 1.1070 earlier in the day. 1.1000 aligns as key support for the pair in the short term and sellers are likely to remain on the sidelines unless this level is broken.

The sharp decline witnessed in the US Treasury bond yields weighed on the US Dollar on Monday and provided a boost to EUR/USD. With the benchmark 10-year US Treasury bond yield losing more than 2% and falling below 3.5%, the US Dollar Index fell nearly 0.5% on the first trading day of the week.

Investors seem to be reacting to renewed concerns over the financing conditions after First Republic Bank’s earnings report revealed that the bank’s deposits plunged by more than $1000 billion in the first quarter.

Meanwhile, European Central Bank (ECB) Chief Economist Philip Lane said early Tuesday that it was still not the right time to stop raising rates but noted that further rate hike after next week’s policy meeting will depend on data.

Later in the session, the Conference Board’s consumer survey will be featured in the US economic docket. Rather than the headline Consumer Confidence Index, investors will pay close attention to the one-year inflation expectation component, which edged higher to 6.3% in March from 6.2% in February. A decline in that component could weigh on the USD and vice versa but the market reaction could remain short-lived ahead of this week’s key data releases from the US.

It’s also worth noting that Google and Microsoft will be releasing first-quarter earnings reports after the closing bell on Tuesday. Hence, market participants could stay away from risk-sensitive assets in the second half of the day and help the USD limit its losses.

S&P 500 & Nasdaq 100 Cautiously Anticipate Tech Earnings

S&P 500 & Nasdaq 100 Cautiously Anticipate Tech Earnings

SPX, NDX FUNDAMENTAL BACKDROP

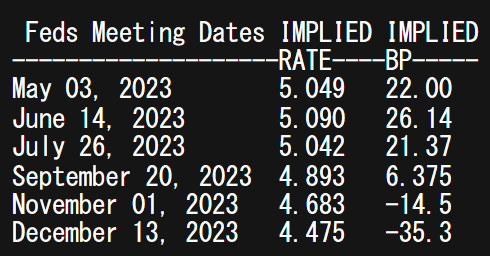
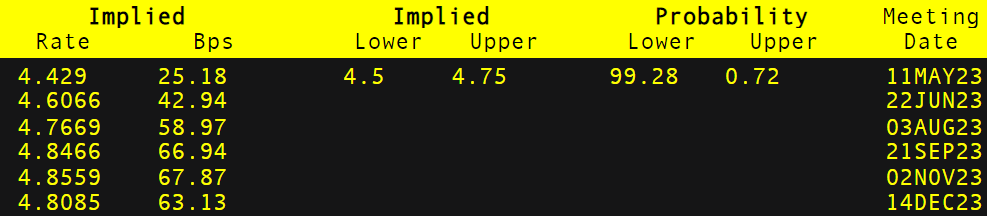
The S&P 500 and Nasdaq 100 index have been rather muted building up to this weeks tech earnings extravaganza. Equity futures are looking to open in the red during early European trade due to market apprehension as global recessionary fears gain traction. In 2023 thus far, tech stocks and the wider SPX index ignored an aggressive monetary policy environment by the Federal Reserve but now with hawkish Fed speak seen last week, investors are unsure as to the Fed’s outlook moving forward. Money markets are currently pricing in a 25bps rate hike next week with an almost 90% probability – generally a negative for stock valuations as the value of future earnings looks less appealing.

FEDERAL RESERVE INTEREST RATE PROBABILITIES

image1.png

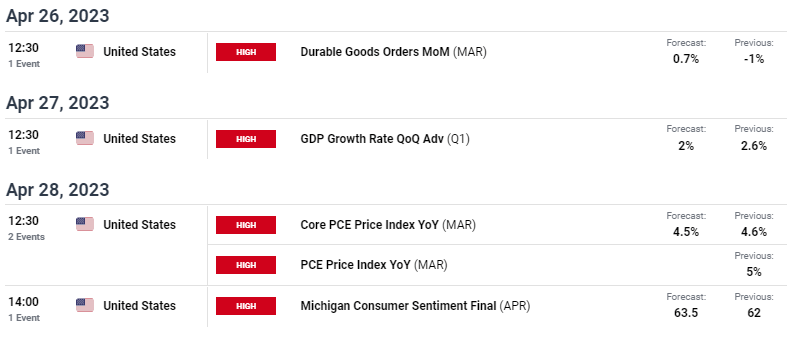
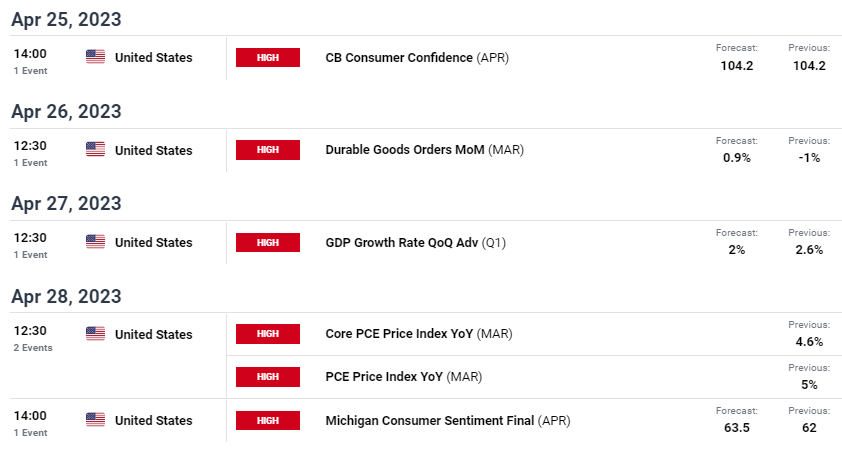
This week is as much about earnings as it is about US economic data and its impact on the Fed’s trajectory for 2023. The DailyFX economic calendar below outlines the high impact data that could shape the markets perception for future rate hikes. While many are anticipating a slowing US economy, anything marginally resilient or pointing to elevated inflationary pressures may open the door for additional interest rate hikes.

image2.png

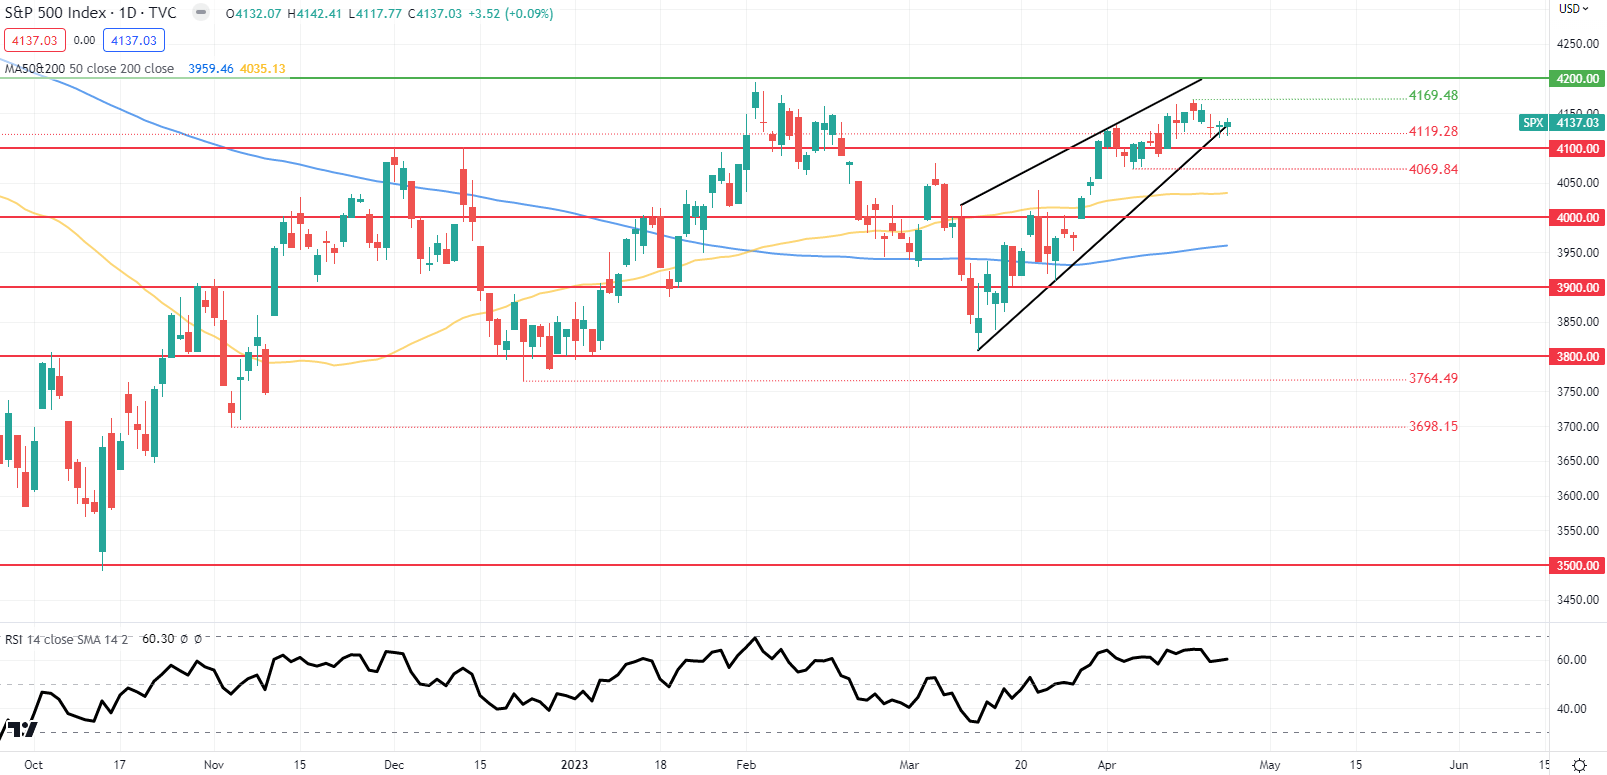
SPX DAILY CHART

image3.png

Prospects for Gold and Silver Prices: Is It a Bullish Sign When Retail Traders Make More Bearish Bets?

Prospects for Gold and Silver Prices: Is It a Bullish Sign When Retail Traders Make More Bearish Bets?

In recent weeks, gold and silver prices have been struggling to find the momentum to resume the broader upside trajectory since bottoming last year. From a technical standpoint, while some bearish signals have emerged, the broader upside focus remains. But, from a positioning standpoint, perhaps there is continued support for upside progress.

This can be seen by looking at IG Client Sentiment (IGCS), which tends to be a contrarian indicator, especially in trending markets. In recent days, it seems retail traders have been increasing their downside exposure in gold and silver. Is this a sign that further gains might be in store?

Gold Sentiment Outlook – Bullish

The IGCS gauge shows that about 58% of retail traders are net-long gold. Since most of them are biased to the upside, this hints that prices may fall down the road. But downside exposure increased by 11.66% and 10.04% compared to yesterday and last week, respectively. With that in mind, recent changes in exposure hint that prices may soon resume higher.

XAU/USD Daily Chart

On the daily chart, gold broke under the 20-day Simple Moving Average (SMA). This followed the emergence of a Bearish Engulfing candlestick pattern, increasingly opening the door to extending downside progress. But, confirmation of the 20-day SMA breakout is lacking after the midpoint of the Fibonacci extension at 1977 held. This is maintaining the near-term upside bias. Extending lower exposes the 100-day SMA.

XAU/USD Daily Chart

Silver Sentiment Outlook – Bullish

The IGCS gauge reveals that 51% of retail traders are net-long silver. Since traders are net-long, this hints price may keep falling. But, net-short exposure has increased by 7.87% and 171.66% compared to yesterday and last week, respectively. With that in mind, recent changes in exposure warn that the current price trend may soon reverse higher.

XAG/USD Daily Chart

Silver prices also face the downside risk of a Bearish Engulfing candlestick pattern. But, unlike gold, XAG/USD has been unable to break under the 20-day SMA, leaving the precious metal in better technical standing than XAU/USD. Turning higher places the focus on April 2022 highs (25.85 – 26.21). Otherwise, falling under the SMA exposes the 50-day equivalent for key support.

XAG/USD Daily Chart

Can naive traders still make money? Optimizing Risk Management

Can naive traders still make money? Optimizing Risk Management

Not Quite Being Lucky

Often, there is an element of luck when it comes to trading. Even if your analysis is spot on, the timing is very difficult. A famous example from the real world can be found in Michael Burry, the storied US investor who correctly predicted the 2008 housing bubble from Michael Lewis’ bestseller “The Big Short”. He had to face down a revolt among his investors that nearly chased him out of the very trades that would land him in the history books. Burry’s financial backers balked at a steady stream of expensive payments made to keep his trades in play as the markets dithered.

There is a way for traders to compensate for luck – risk management. Overlooking this essential component of the strategy is how an incredibly lucky trader – someone who can frequently call trades correctly – may still lose money in the aggregate. Conversely, using risk management effectively is how a poor win rate can still translate into profitability.

How is it that a lucky trader can lose money overall? Consider a person who profited on 8 trades out of 10, making 10 dollars per trade. On the two remaining trades, however, 50 dollars were lost each time. On net, this will leave the trader 20 dollars poorer. In this special report, we will show how an unlucky trader can still be profitable, and what you can do to optimize risk management.

The First Random Walk – Understanding the Sequence

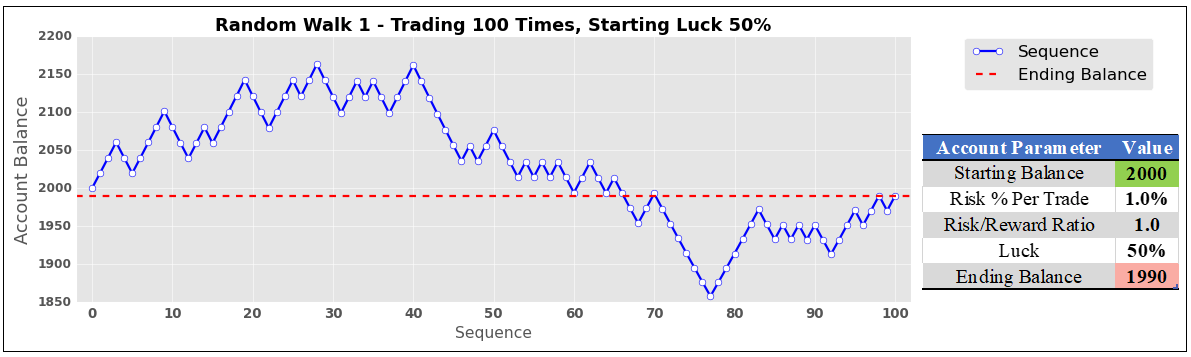
A random walk simulation was used to mimic someone trading 100 times in a row. Each random walk has a few parameters: starting account balance, the maximum risk a person is willing to take per trade as a percentage of the account balance (which stays the same as the trader makes or losses money), the risk-reward ratio (how much the trader wants to make relative to how much is put at risk), and finally the trader’s luck (the chance that a given trade in the sequence is profitable).

The first random walk is shown on the chart below. It simulates a trader that starts with a $2k account, risks 1% per trade, has a risk/reward (RR) ratio of 1:1 (meaning that the first trade risks losing $20 to make a profit of $20), and has 50% luck. Being lucky about half of the time had a predictable outcome. The ending balance ($1990) was nearly identical to where it started ($2000) after one hundred trades.
The First Random Walk – Understanding the Sequence

Study Limitations

It should be noted that this is a study computed with code and has no margin of error or human emotion factored into it. This means that no matter what, it assumes the trader being modeled always sticks to the game plan perfectly. It also assumes that trades can be seamlessly closed – with a profit or loss – at the designated settings with absolute precision. In the real world, stops may not always be executed at the specified price, resulting in some slippage. These simulations also assume 100 trades were taken, which will not match everyone’s level of activity. With that in mind, this is more of a demonstration of the importance of risk management rather than a one-size-fits-all trading system.

The Second Random Walk – Reducing Luck

What happens when we take the same sequence but make our hypothetical trader unlucky, leaving everything else unchanged? With 25% luck, disaster strikes. Someone with a risk/reward ratio of just 1:1 would see their account balance cut almost in half after 100 trades ($1137). As we will find at the end of this journey, however, an increase in the risk/reward ratio can compensate for worse luck.
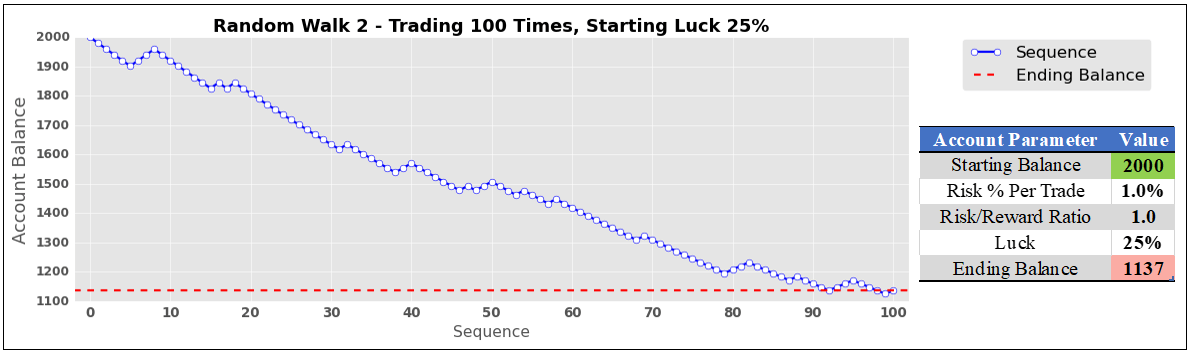
image2.png

Simulating Hundreds of Thousands of Trades to Find Optimal Risk/Reward Ratios

To find ideal risk/reward ratios for given levels of luck, these random walks were run many times to find statistically meaningful interpretations. In this study, one cycle constituted 100 trades conducted 100 times. That is a total of 10,000 trades per cycle! With each cycle, the risk/reward ratio automatically rose by 0.05, starting at 1. The program is coded to keep doing this until 100% of the trades are finished at or above the starting account balance.

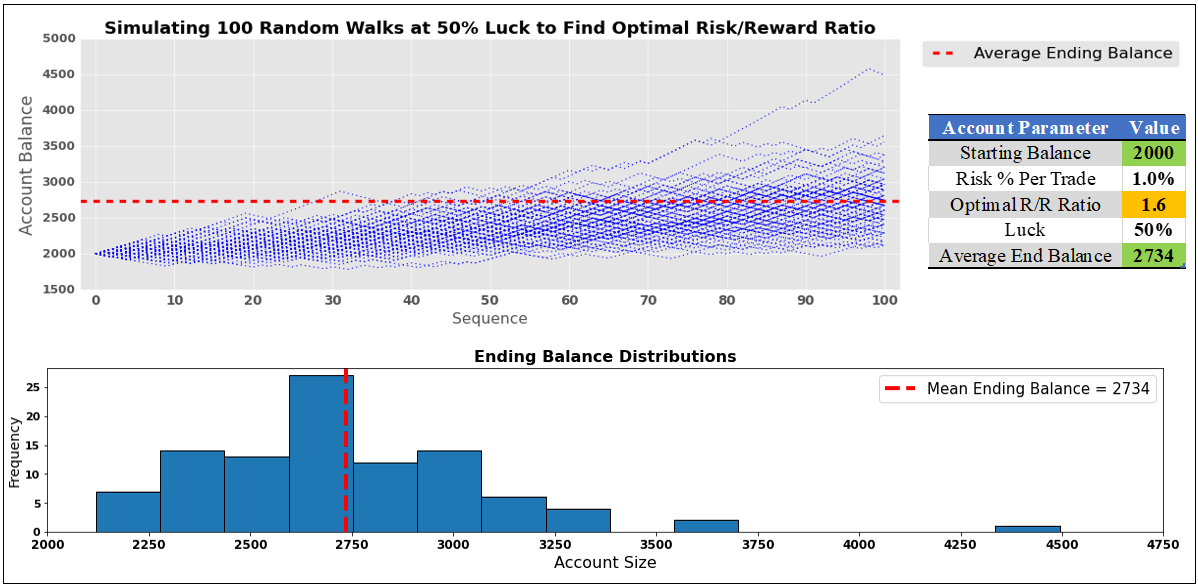
So, what does this look like for someone lucky about half of the time? Well, in the image below, we can see that the optimal risk-reward ratio is on average 1.6 (meaning that with a starting balance of $2k the strategy aims to make $32 in profit while risking $20 on the first trade). The latter two will adjust alongside the evolving account balance to maintain a 1.6 RR ratio, making sure the risk remains at 1% per trade.

The code ended up increasing the risk/reward ratio 6 times. Including the starting point, the cycle ran 7 times. In other words, 70k trades were conducted to find the optimal RR ratio. To further optimize this study, another 10 rounds of random sequences were used. This means that roughly 770,000 trades were placed to find the optimal risk/reward ratio for 50% luck! It is not exactly 770,000 because sometimes the RR ratio was above/under 1.6.

When someone is lucky half of the time, and they use a 1.6 risk-reward ratio, we can expect an average ending balance of $2734 (36.7% return, which remains constant no matter what the starting account balance size is) after 100 trades. In the lower half of the image, there is a normal distribution of outcomes. There were a couple of outliers, with an account topping $4.5k. A few others were above $3.5k.
Simulating Hundreds of Thousands of Trades to Find Optimal Risk/Reward Ratios

The Optimal Risk/Reward Ratio Curve

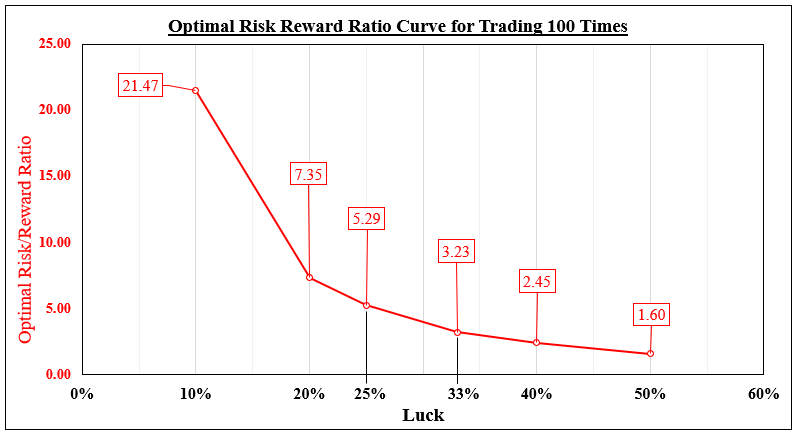
What about other levels of luck? In this study, I used the following: 50%, 40%, 33%, 25%, 20% and 10%. Optimal RR ratios are displayed in the chart below for a given luck level. As expected, lower levels of luck required higher risk/reward ratios to compensate. When you are lucky 40% of the time, an ideal RR ratio for a sequence of 100 trades seems to be 2.45.

At 2.45, a total of 30 cycles were simulated for a given random sequence. Just like before, an additional 10 were performed to help optimize this study. Combining all these sequences, roughly 3,300,000 trades were placed to find the optimal risk/reward ratio for 40% luck.

Someone lucky just 10% of the time can still make a profit. However, this would demand the daunting task of maintaining a 21.47 risk/reward ratio.
The Optimal Risk/Reward Ratio Curve

Is Trading Success Based on Luck?

Now, let us revisit the earlier scenario of a trader that is lucky just 25% of the time. Using a 1:1 risk-reward ratio, they lost almost half of their account. Using the optimal risk/reward ratio of 5.3 suggested in our analysis, their ending balance becomes $2844, a 42.2% return. Do traders have to be lucky to be profitable? Absolutely not. Success comes down to risk management.

Setup of US Dollar Prices Before PCE Data: USD/JPY, AUD/USD, and EUR/USD

Setup of US Dollar Prices Before PCE Data: USD/JPY, AUD/USD, and EUR/USD

The US dollar is broadly maintaining a weak tone going into key data this week, including GDP and a gauge of inflation, on rising expectations of rate cuts by the US Federal Reserve later this year.

US economic growth likely slowed to 2.0% on-quarter in the January-March quarter from 2.6% in the previous quarter as the impact of interest rate hikes spills over to the broader economy. Price pressures likely eased in March – Core PCE price index rose 4.5% on-year from 4.6% in February. Core measures, including CPI and PPI, appear to be in a cooling phase, but not enough for the Fed to proceed with one more rate hike at next week’s meeting. Beyond that, the market is pricing roughly 50 basis points of rate cuts by the end of the year.

EUR/USD Daily Chart

image1.png

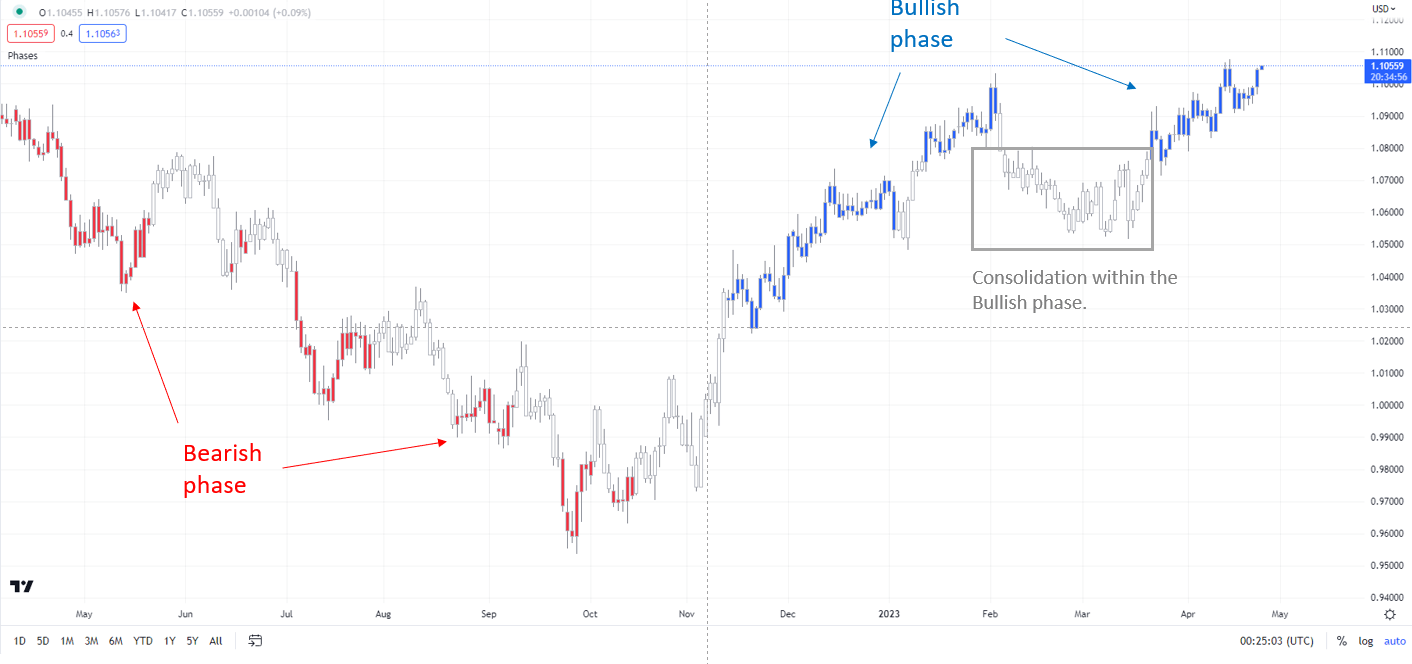
Note: In the above colour-coded chart, Blue candles represent a Bullish phase. Red candles represent a Bearish phase. Grey candles serve as Consolidation phases (within a Bullish or a Bearish phase), but sometimes they tend to form at the end of a trend. Note: Candle colors are not predictive – they merely state what the current trend is. Indeed, the candle color can change in the next bar. False patterns can occur around the 200-period moving average, or around a support/resistance and/or in sideways/choppy market. The author does not guarantee the accuracy of the information. Past performance is not indicative of future performance. Users of the information do so at their own risk.

If data shows price pressures failed to ease last month, it could buy some more time for the US dollar, but won’t be enough to derail the downtrend. Furthermore, key macro data elsewhere could help set the tone for the US dollar, including Australia Q1 inflation and Germany GfK consumer confidence data due Wednesday, and BOJ interest rate decision and Euro area Q1 GDP due Friday.

EUR/USD Daily Chart

image2.png

EUR: Attempting to break above key resistance at 1.10

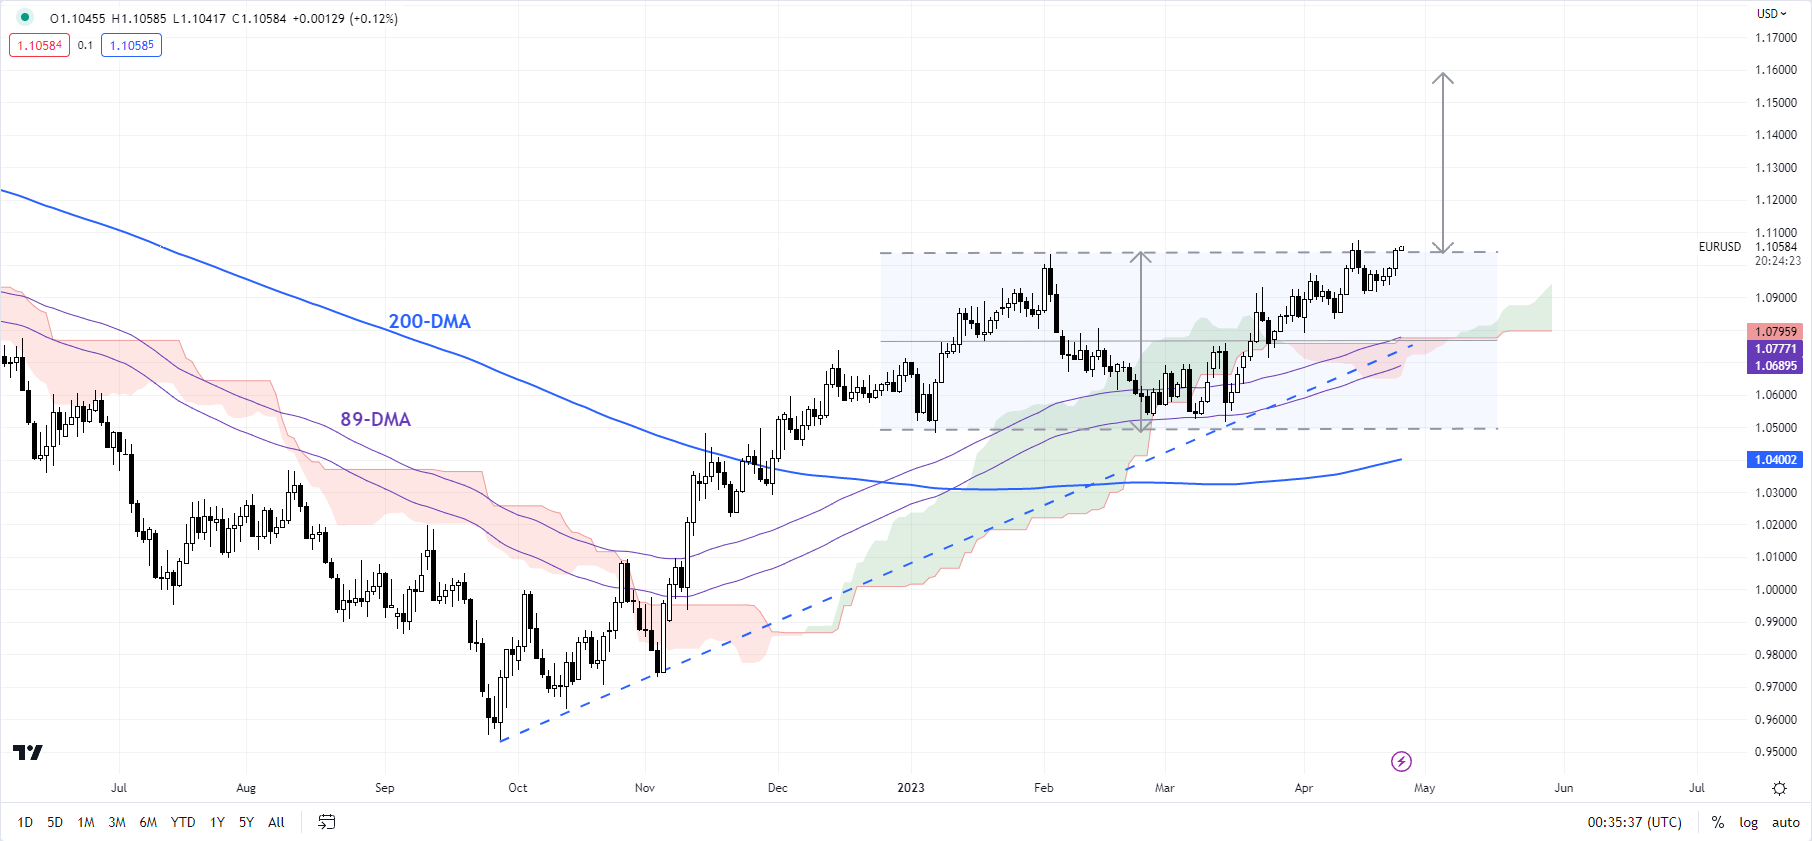
On technical charts, EUR/USD’s trend remains up on the daily charts, as the colour-coded candlestick charts based on trending/momentum indicators show. See previous updateson April 10andApril 13highlighting the uptrend. The pair is now preparing to break above a vital ceiling at the February high of 1.1035. A decisive break above could pave the way toward 1.1700 — the price objective of the double bottom pattern (the January and March lows).

AUD/USD Daily Chart

image3.png

AUD/USD: Capped by resistance

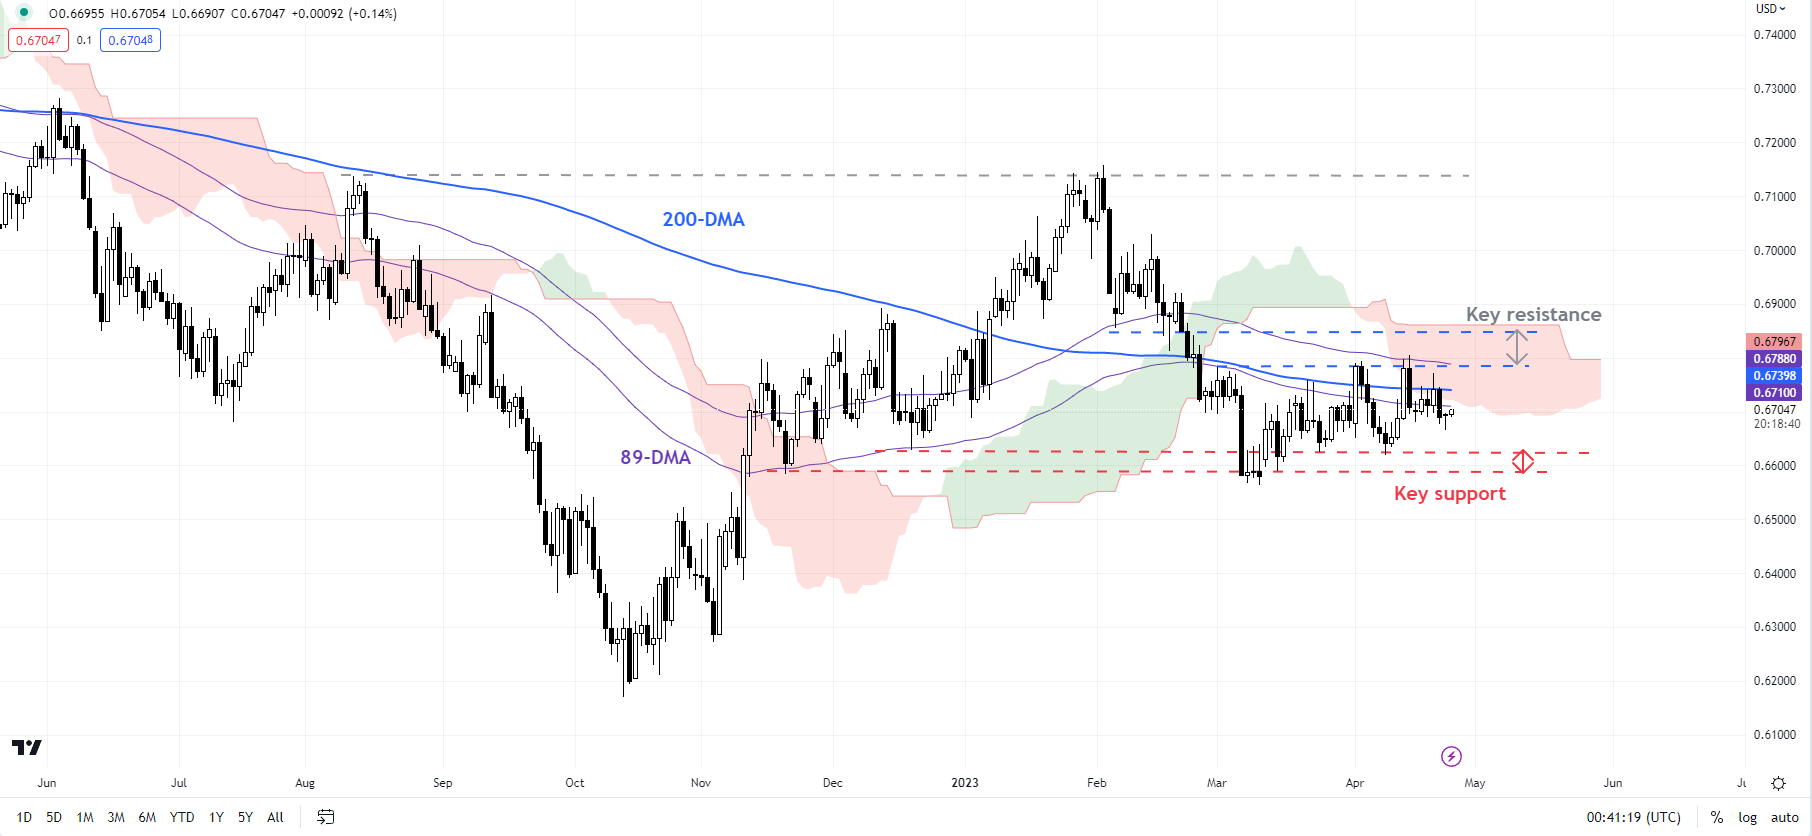
While AUD/USD has this month held above quite a strong support at the late-March low of 0.6625, the upward momentum subsequently has been lacking, leaving it vulnerable to another leg lower. So far, AUD/USD has been capped under a tough ceiling around the 200-day moving average, roughly coinciding with the early-April high of 0.6795. Unless the pair is able to cross the hurdle, the path of least resistance would remain sideways to down. On the downside, immediate support is at 0.6625, followed by a stronger cushion at the March low of 0.6550.

USD/JPY 240-minute Chart

image4.png

USD/JPY: Looking for cues from BOJ and US data

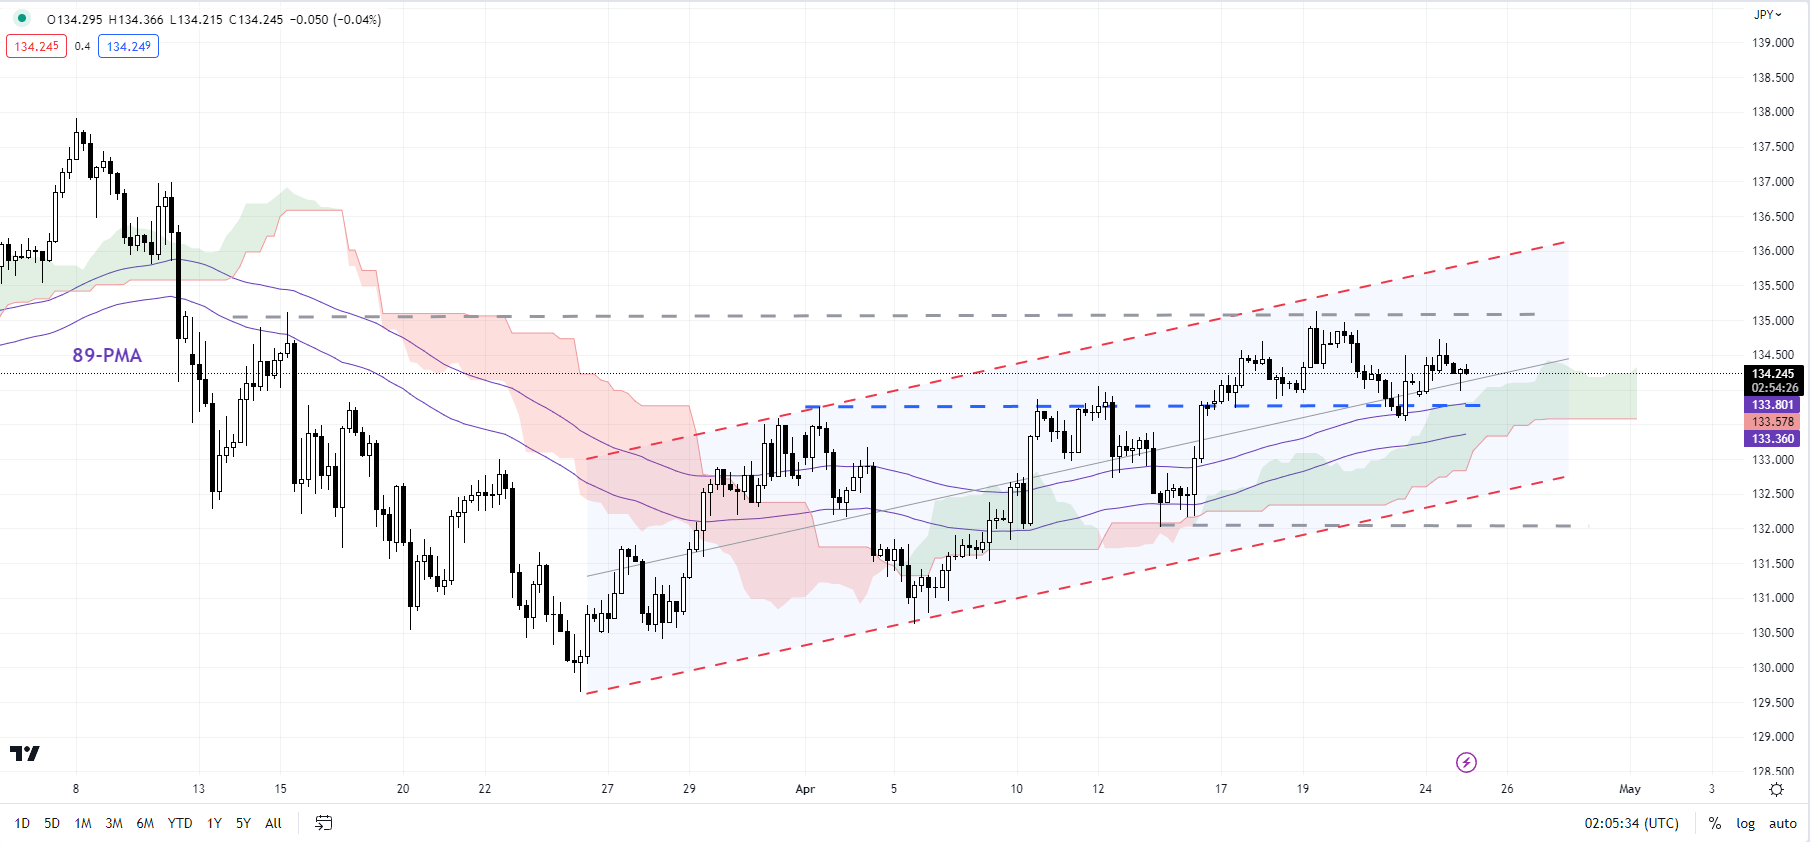
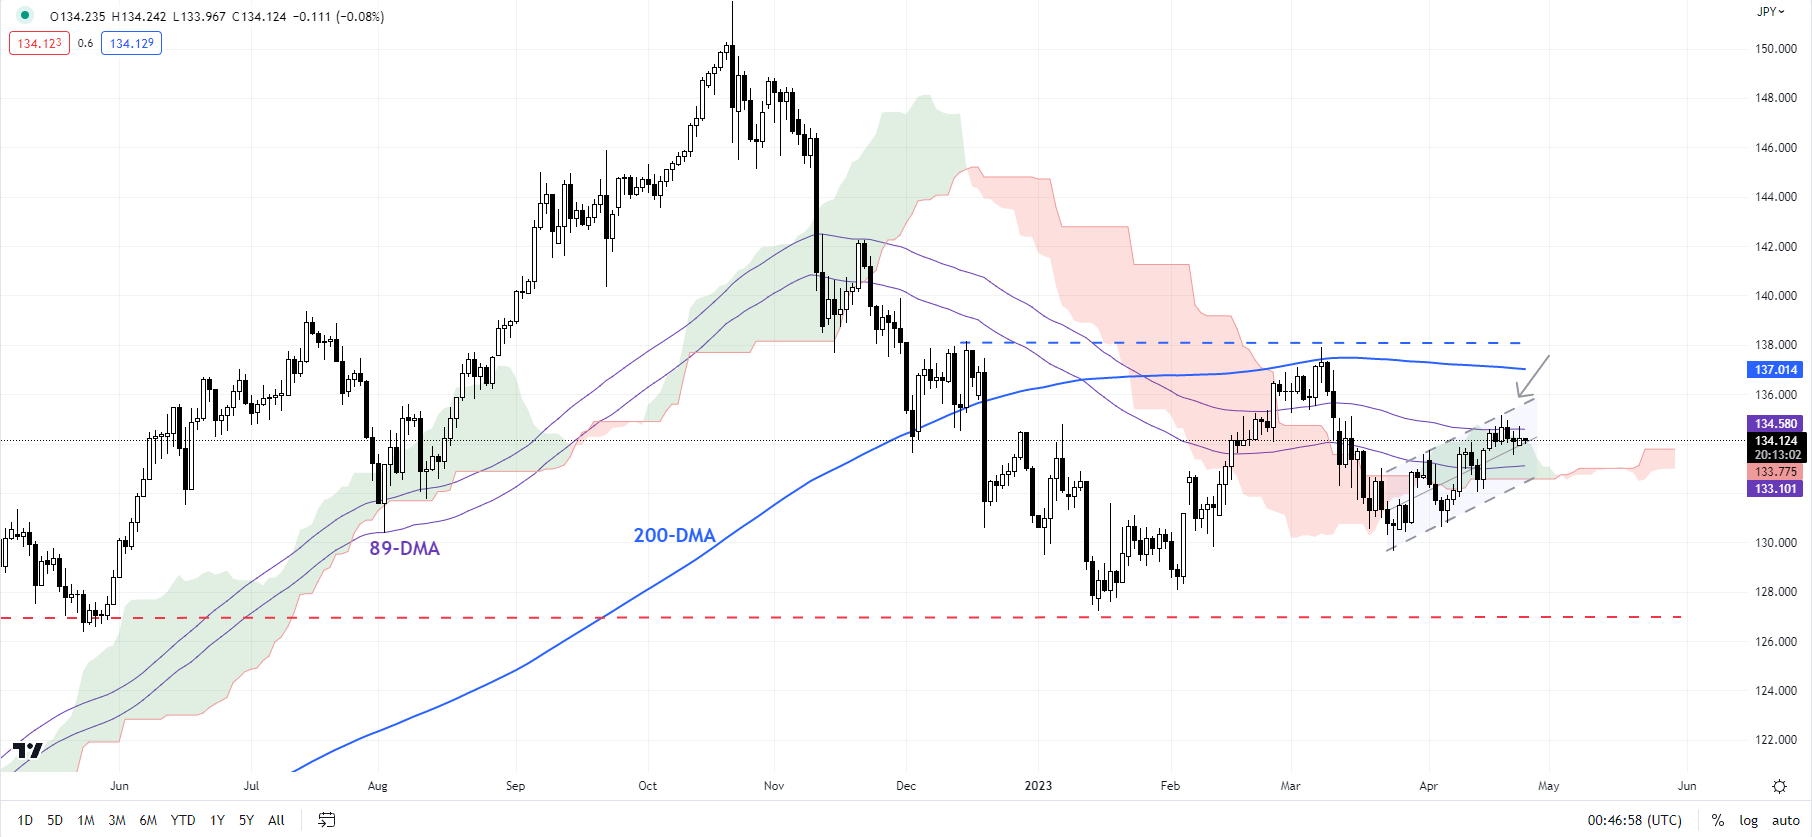
USD/JPY’s minor rebound since March appears to have stalled at a key converged barrier: the 89-day moving average, coinciding with the upper edge of a rising channel from March, and the upper edge of the Ichimoku cloud on the daily charts. The upward pressure is unlikely to run out of steam while the pair holds above the immediate floor on a horizontal trendline from earlier this month at about 134.00. Any break below could expose the downside toward 132.00.

USD/JPY Daily Chart

image5.png


Price Changes for Ethereum and Bitcoin: What else could go wrong?

Price Changes for Ethereum and Bitcoin: What else could go wrong?

Bitcoin and Ethereum have fallen sharply over the past couple of weeks, and chances are cryptocurrencies could decline further in the near term. However, it may be premature to assume that the multi-week-long rebound is over.

BITCOIN

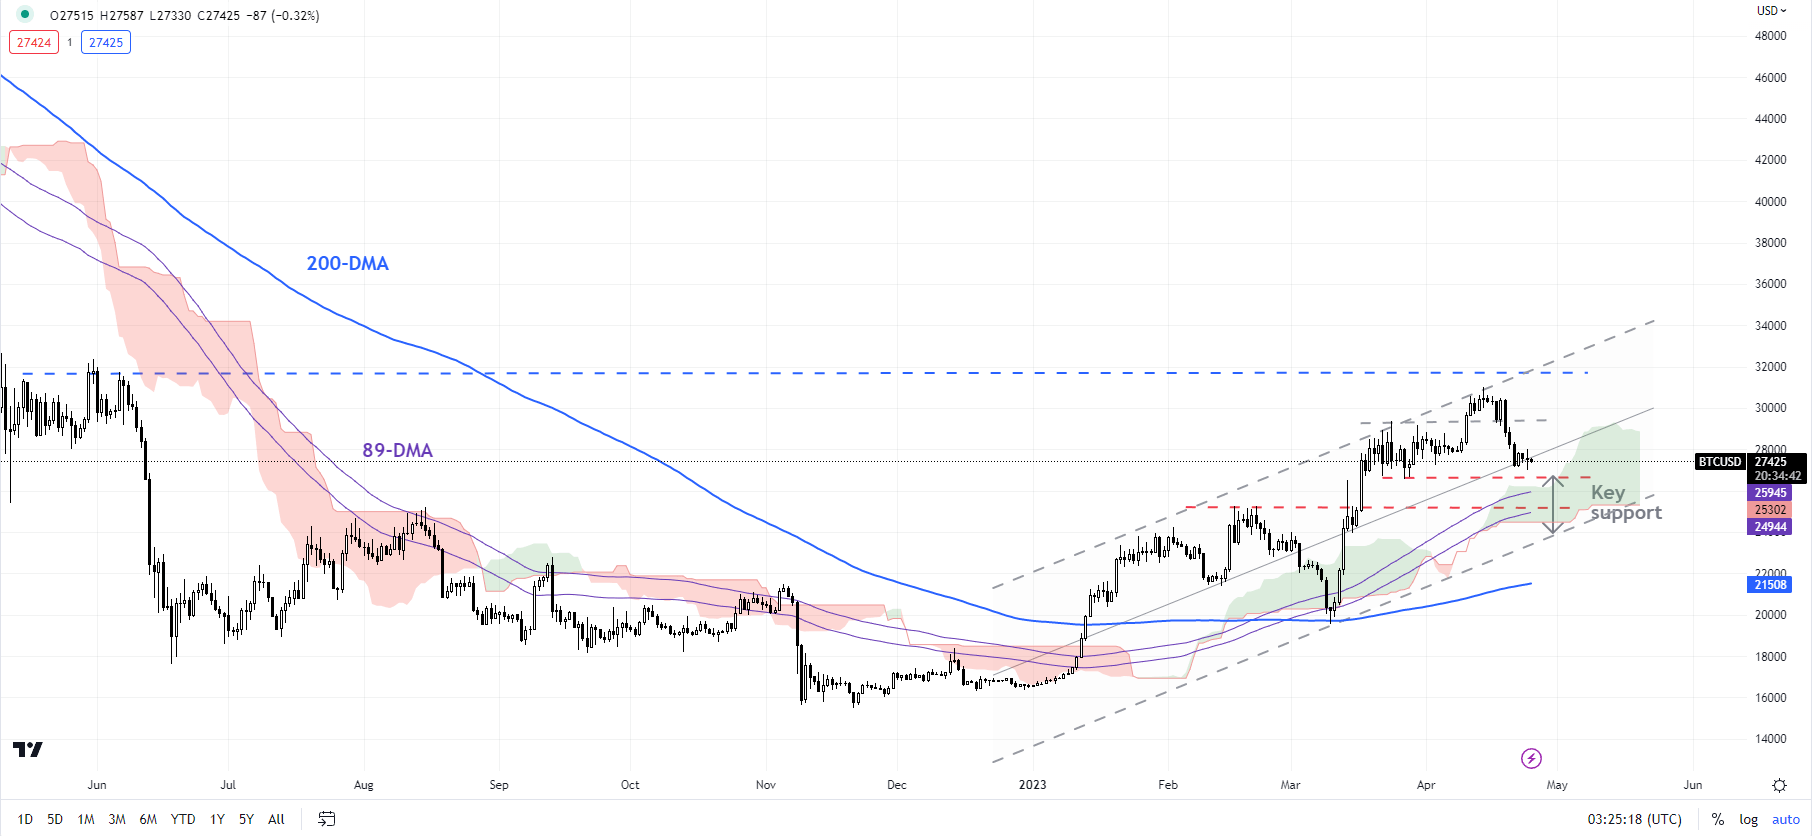
Bitcoin has pulled back sharply from near key resistance area: the May 2022 high of 32375, and an uptrend line from January, coinciding with the 89-week moving average – a risk highlighted in the previous update. See “Bitcoin Crosses the Key $30000 Mark: Will it Sustain?”, published April 11.

BTC/USD 240-minute Chart

image1.png

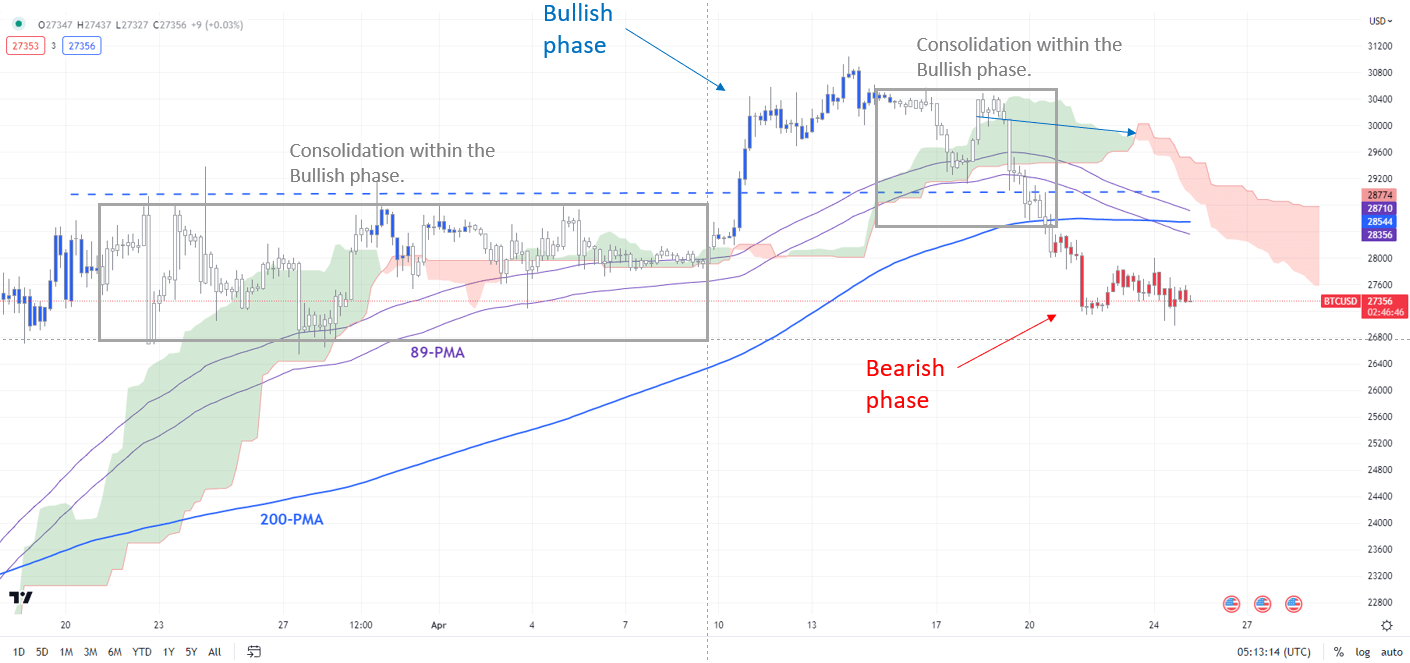
Note: In the above colour-coded chart, Blue candles represent a Bullish phase. Red candles represent a Bearish phase. Grey candles serve as Consolidation phases (within a Bullish or a Bearish phase), but sometimes they tend to form at the end of a trend. Note: Candle colors are not predictive – they merely state what the current trend is. Indeed, the candle color can change in the next bar. False patterns can occur around the 200-period moving average, or around a support/resistance and/or in sideways/choppy market. The author does not guarantee the accuracy of the information. Past performance is not indicative of future performance. Users of the information do so at their own risk.

The upward pressure has eased somewhat following the drop below support at the end-March high of around 29000. This is further reinforced by the colour-coded candlestick charts, based on trend/momentum indicators, on the 240-minute charts –BTC/USD has entered a bearish phase in the intraday timeframe.

BTC/USD Daily Chart

image2.png

The downward momentum could push BTC/USD toward initial support at the end-March low of 26525. Beyond that, further downside could be limited given plenty of cushions: the 89-day moving average and the lower edge of the Ichimoku cloud on the daily charts, near the February highs of 24250-25250.

ETH/USD Daily Chart

image3.png

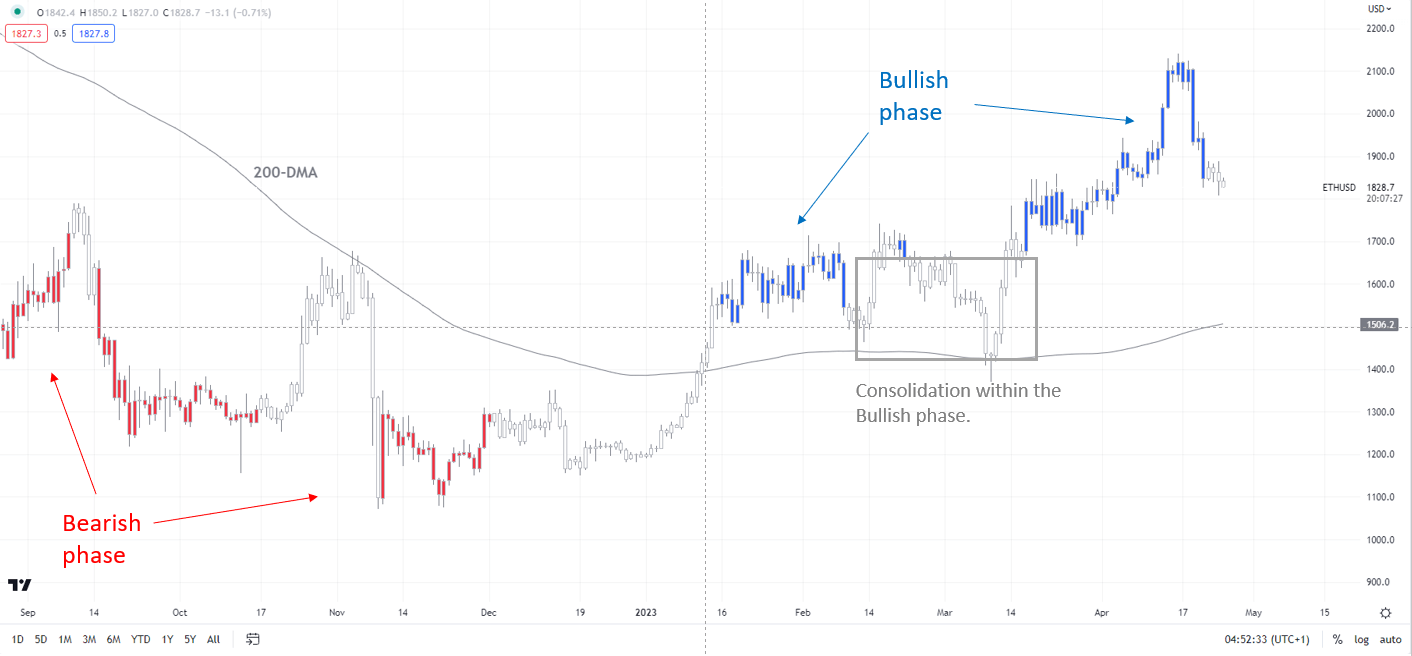
Note: In the above colour-coded chart, Blue candles represent a Bullish phase. Red candles represent a Bearish phase. Grey candles serve as Consolidation phases (within a Bullish or a Bearish phase), but sometimes they tend to form at the end of a trend. Note: Candle colors are not predictive – they merely state what the current trend is. Indeed, the candle color can change in the next bar. False patterns can occur around the 200-period moving average, or around a support/resistance and/or in sideways/choppy market. The author does not guarantee the accuracy of the information. Past performance is not indicative of future performance. Users of the information do so at their own risk.

Notwithstanding the recent retreat, the broader trend remains up on the daily charts – a trend that has been prevalent since January – see “Bitcoin Technical Outlook: BTC/USD Turns Bullish”, published January 18. Hence, for the five-month-long uptrend to reverse, BTC/USD would need to fall below strong support at the March low of 19540.

ETHEREUM

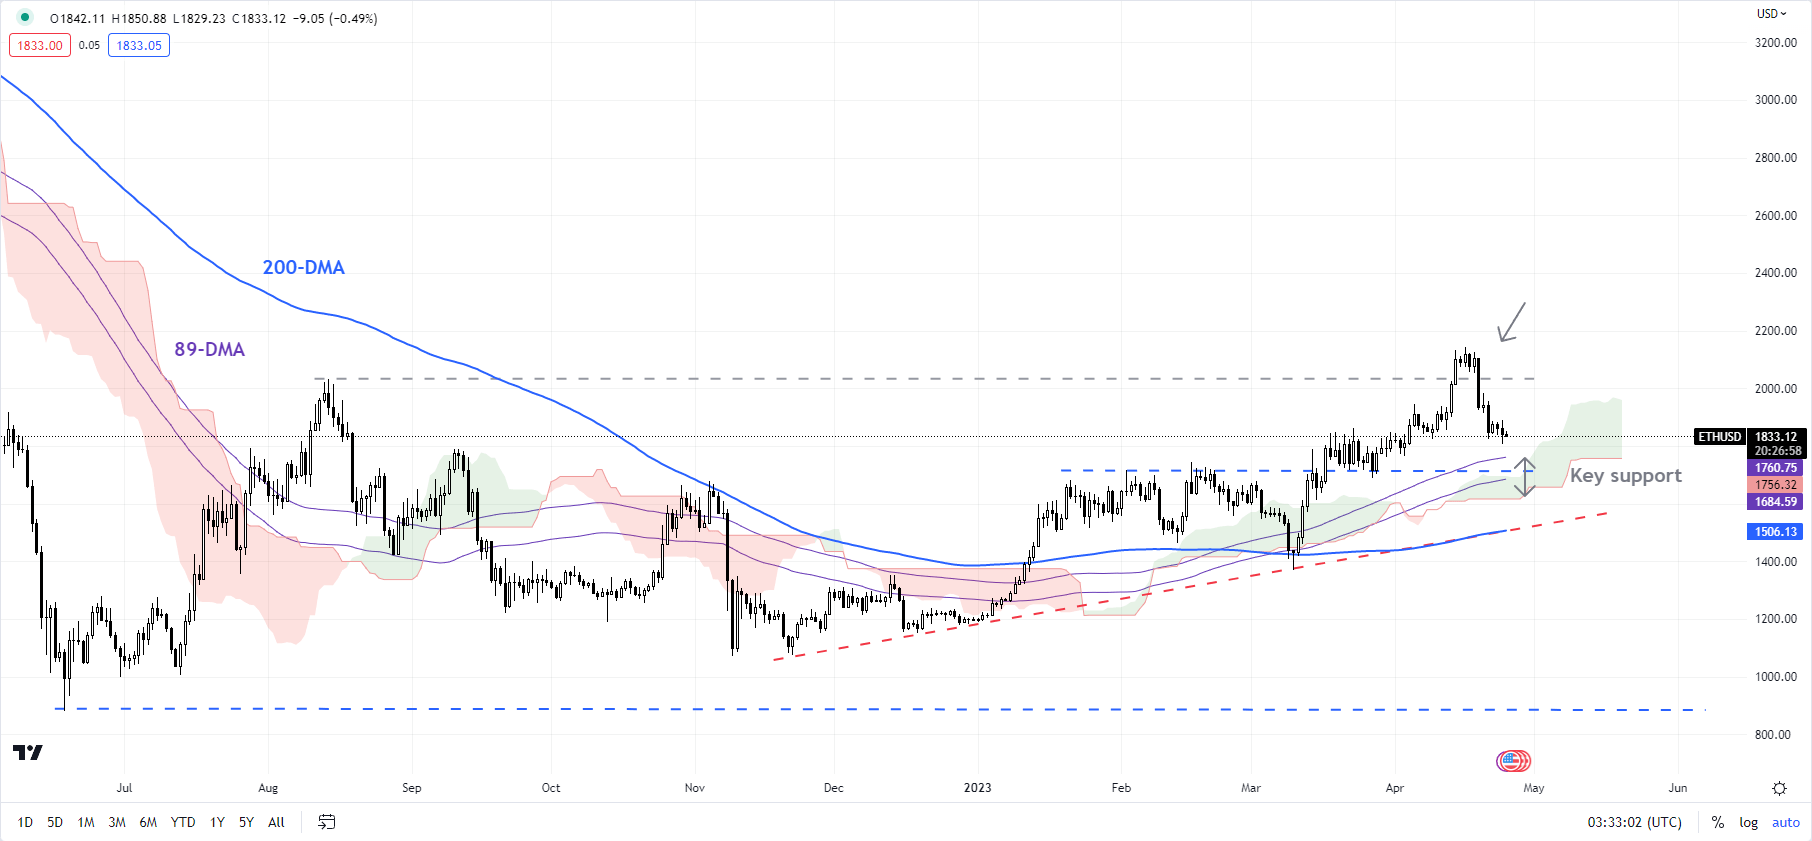
The technical posture in ETH/USD is similar – bullish on the daily charts, as the colour-coded candlestick charts show. Ethereum has pulled back from a fairly strong ceiling at the August high of 2030.

ETH/USD Daily Chart

image4.png

Still, there is a strong converged cushion on the 89-day moving average, the lower edge of the Ichimoku cloud on the daily chart, and a horizontal trendline from February at about 1715. Unless ETH/USD falls below the 1350-1500 area, including the 200-day moving average and the March low, the broader trend continues to be up.

JPY Pursuing Ascending Channel Break

JPY Pursuing Ascending Channel Break

JAPANESE YEN FUNDAMENTAL BACKDROP

The Japanese Yen has given back much of its gains seen in early March after optimism around the new Bank of Japan (BoJ) Governor Kazuo Ueda and a potential shift away from the long standing ultra-loose monetary policy. Since then, there has been little in the way of guidance from the BoJ to shift their policies while money market pricing (refer to table below) suggest policy hikes are unlikely in 2023.

BANK OF JAPAN (BOJ) INTEREST RATE PROBABILITIES

image1.png

This week, the BoJ will kick-off central bank rate decision on Friday with revised economic forecasts of high importance alongside any mentioned of Yield Curve Control (YCC). The graph below shows the BoJ’s expanding balance sheet stemming from Japanese Government Bond (JGB) purchases to defend their yield caps. The fact that easing measures have been a staple of global markets for many years, any slight adjustment could induce a heightened reaction.

BANK OF JAPAN BALANCE SHEET

image2.png

US centric data will guide the pair ahead of the rate announcement but many of these data points are projected to suggest a slowing US economy and thus could favor JY strength. Key releases include US GDP, durable goods orders and the Fed’s preferred measure of inflation, core PCE in a week where the Fed’s blackout period is underway (no Fed speak!).

ECONOMIC CALENDAR

image3.png

TECHNICAL ANALYSIS

USD/JPY DAILY CHART

image4.png


GBP/USD Price Forecast: Steady Pound Faces Big Data Week

GBP/USD Price Forecast: Steady Pound Faces Big Data Week

GBPUSD FUNDAMENTAL BACKDROP

The British pound remains resilient against the USD on Monday morning in what is scheduled to be a quiet week in terms of UK data. A quick recap last week revealed higher inflationary pressures, marginal improvements on retail sales and PMI numbers alongside tight labor market data. Markets reacted rather aggressively that led to a hawkish re-pricing of the Bank of England’s (BoE) interest rate probabilities (see table below), now including almost 3 additional rate hikes this year! While this is likely an overestimation, it looks clear that the BoE may not cut at all this year. Follow through from the already tight monetary policy may still filter through which is why I foresee less than 3 hikes for this year while adopting a more patient approach before hastily raising rates.

BANK OF ENGLAND INTEREST RATE PROBABILTIEIS

image1.png

Source: Refinitiv

This week is the turn of the US as shown in the economic calendar below. A slew of high impact data that will contribute to the upcoming Fed rate decision next week. Fed guidance has been rather one sided and in favor of a higher for longer approach to quell inflation. That being said, the Fed blackout period has commenced so markets will not receive added insight until the May 4th (end of the blackout period), emphasizing upcoming data. Most data points are expected to portray a slowing US economy, leaving room for further pound strength should this come to fruition.

Trade Smarter – Sign up for the DailyFX Newsletter

Receive timely and compelling market commentary from the DailyFX team

Subscribe to Newsletter

ECONOMIC CALENDAR

image2.png

Source: DailyFX Economic Calendar

TECHNICAL ANALYSIS

GBP/USD DAILY CHART

image3.png

Chart prepared by Warren Venketas, IG

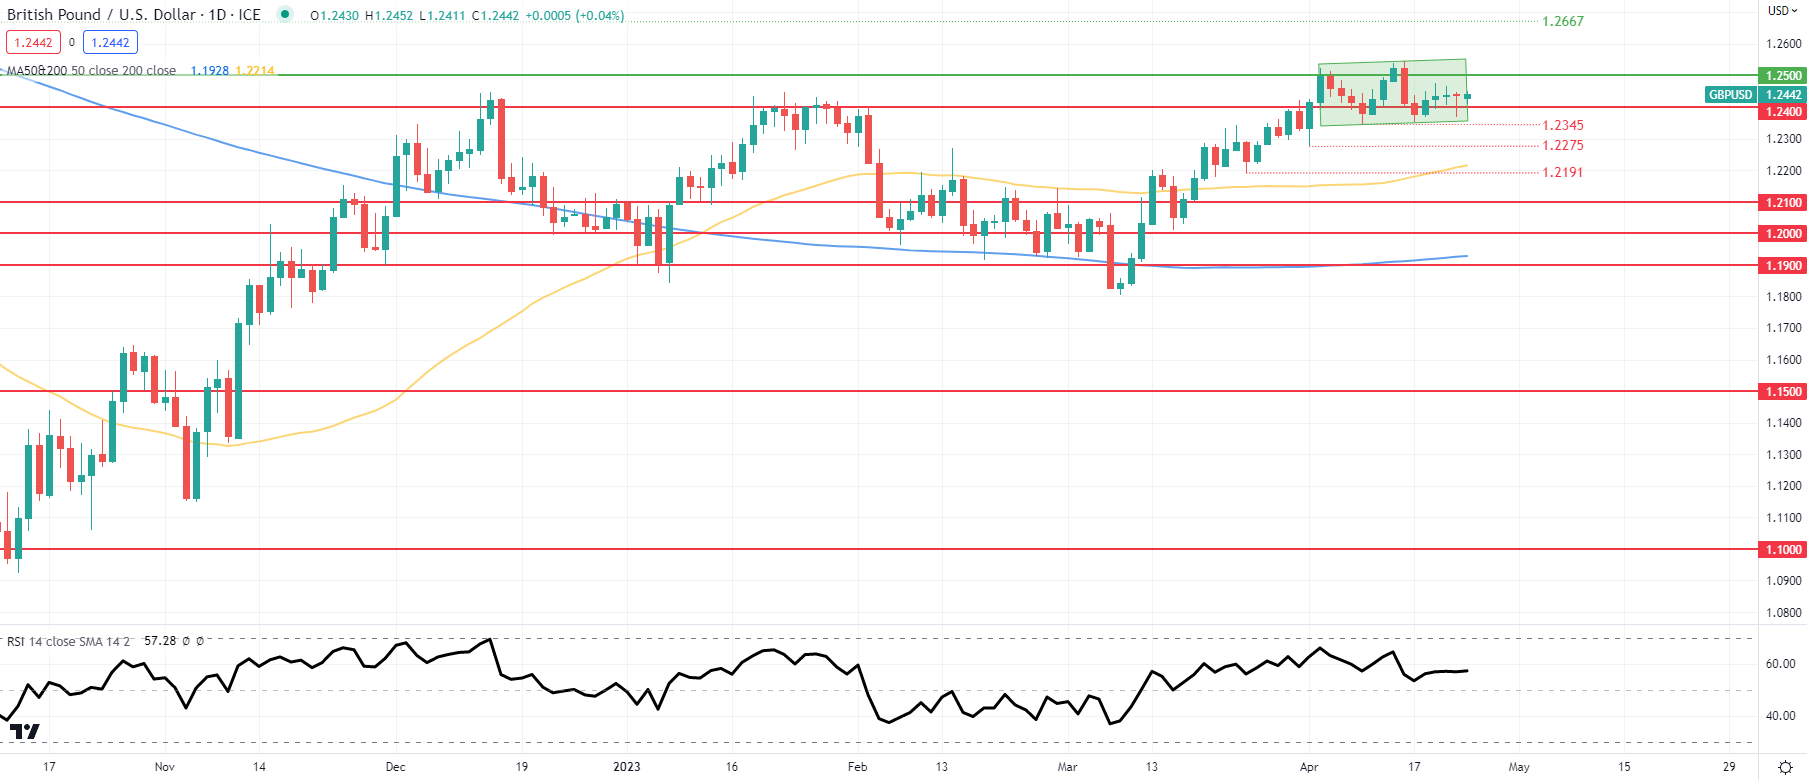
Daily GBP/USD price action continues to exhibit indecisiveness within the short-term consolidatory pattern (green). With no major releases today, I anticipate minimal price movement on the pair sandwiched between the 1.2400 and 1.2500 psychological levels respectively.

Key resistance levels:

  • 1.2667
  • 1.2500

Key support levels:

  • 1.2400
  • 1.2345

BEARISH IG CLIENT SENTIMENT

IG Client Sentiment Data (IGCS) shows retail traders are currently net SHORT on GBP/USD with 57% of traders net short (as of this writing). At DailyFX we typically take a contrarian view to crowd sentiment but due to recent changes in long and short-positioning, we arrive at a short-term downside bias.

Japanese Yen Q2 Technical Forecast: Yen Looks Set for Gains in Q2

Japanese Yen Q2 Technical Forecast: Yen Looks Set for Gains in Q2

Japanese Yen Q1 Recap

The Japanese Yen has had an interesting Q1 to say the least with the Yen starting the quarter looking vulnerable against the Greenback. The US Federal Reserve looked set to continue on an aggressive hiking cycle while the Bank of Japan looked set to continue down its easy monetary policy path.

February turned out to be a difficult month for the Yen as it posted steep losses against the US Dollar. The losses were compounded by the rising odds for a higher peak rate from the US Federal Reserve as US data came in better than expected for the majority of February. Late February was the start of the Yen’s recovery with March seeing the Banking sector woes accelerate the decline in USDJPY as the pair declined some 700-odd pips since February 28.

As we head into Q2 the Yen is basically flat against the Greenback with the early gains made in Q1 effectively wiped out. The question we have to ask is are we going to see a continuation of the Yen’s recent comeback over the coming months? While this article focuses on the JPY technical outlook, Q2 has a host of key fundamentals that could drive the Yens direction – download the full Q2 forecast below:

Technical Outlook – USD/JPY

USDJPY Monthly Chart

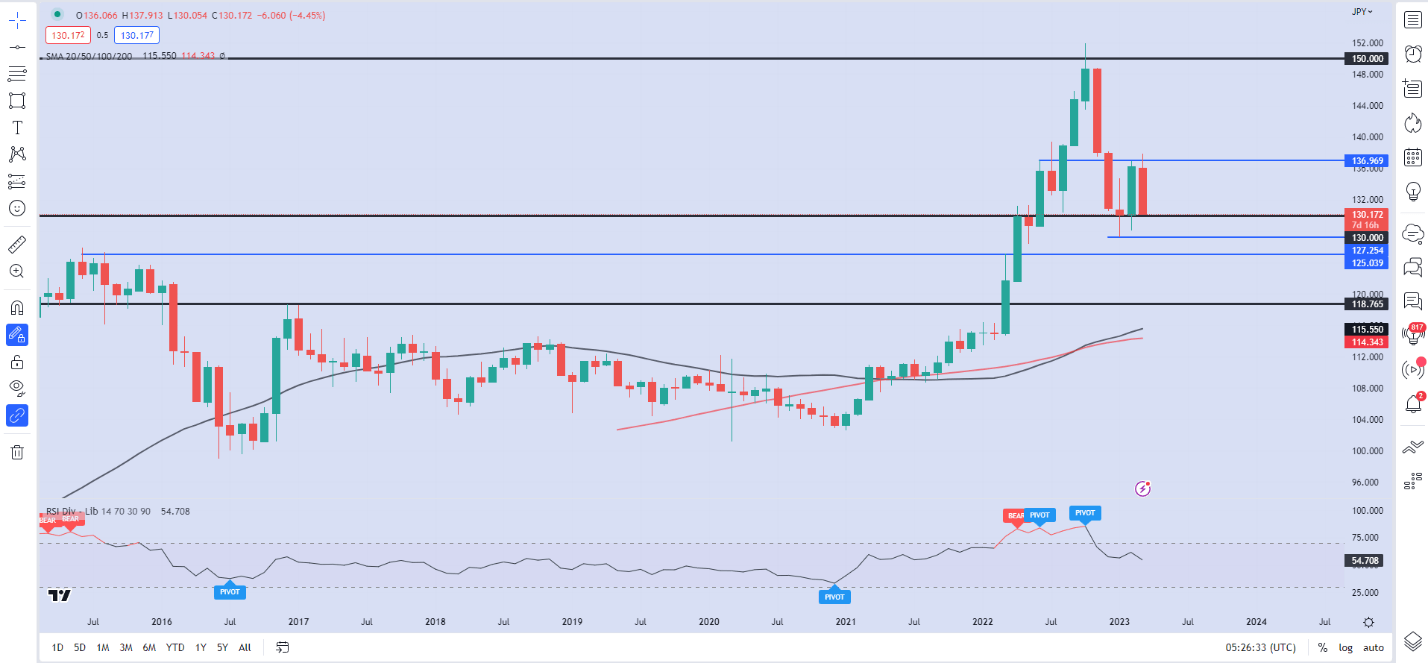
Graphical user interface  Description automatically generated with medium confidenceUSDJPY on the weekly timeframe has been on a steady decline since February 27, with four consecutive weeks of losses. Price is approaching the psychological 130.000 level (at the time of writing) with the monthly candle looking set to close as bearish engulfing candle. A monthly close below the 130.000 handle should lead to further downside for the pair as we haven’t seen a close below since breaking above the psychological 130.00 level in June 2022.

USDJPY Daily Chart

Chart  Description automatically generatedSource: TradingView, chart prepared by Zain Vawda

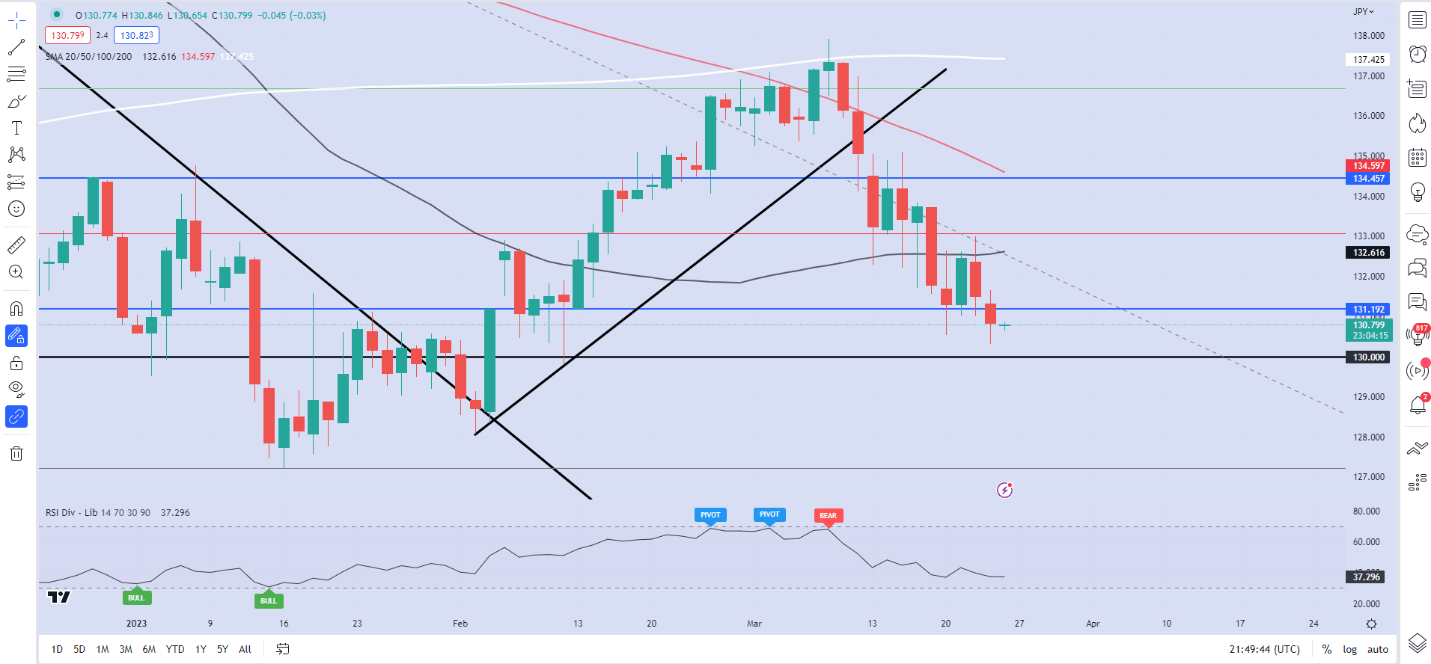
Price action on the daily timeframe has seen us print a fresh low with retracement now a possibility. Should a pullback materialize immediate resistance rests at 132.600 (50-day MA) with a break higher potentially leading to a retest of the 100-day MA around the 134.600 handle. The YTD high just above 137.000 has held firm so far in 2023 and holds the key to keep the bearish trend intact.

On the downside a break of the psychological level at 130.00 brings the YTD low of 127.250 back into focus. A candle close below this level could see a test of support resting at 125.000 (March 22 swing high).