Dow Jones, S&P 500 Plunge on Powell Testimony. Is a Larger Fed Rate Hike Next?

Dow Jones, S&P 500 Plunge on Powell Testimony. Is a Larger Fed Rate Hike Next?

Asia-Pacific Market Briefing – Markets Bracing After Wall Street Volatility

Wall Street received a reality check on Tuesday as the Dow Jones and S&P 500 sank 1.72% and 1.53%, respectively. The key culprit was what traders were anxiously anticipating, testimony from Federal Reserve Chair Jerome Powell before the Senate Banking Committee.

The key takeaway from Mr. Powell was that he noted that the central bank was prepared to speed up the pace of hikes again if warranted. Of course, this would continue to be influenced by incoming economic data. Furthermore, he noted that the Fed is likely looking at a higher rate peak than expected.

This testimony follows recent signs that inflation might be stickier than previously seen. The latest CPI and PCE report (the latter of which is the central bank’s preferred inflationary gauge) showed signs that the pace of disinflation slowed.

By the end of the day, market pricing started to favor a 50-basis point rate hike this month as opposed to 25. Treasury yields soared, sapping the appeal of stocks, inducing classic risk aversion. This leaves Asia-Pacific markets vulnerable heading into Wednesday’s trading session.

Dow Jones Technical Analysis

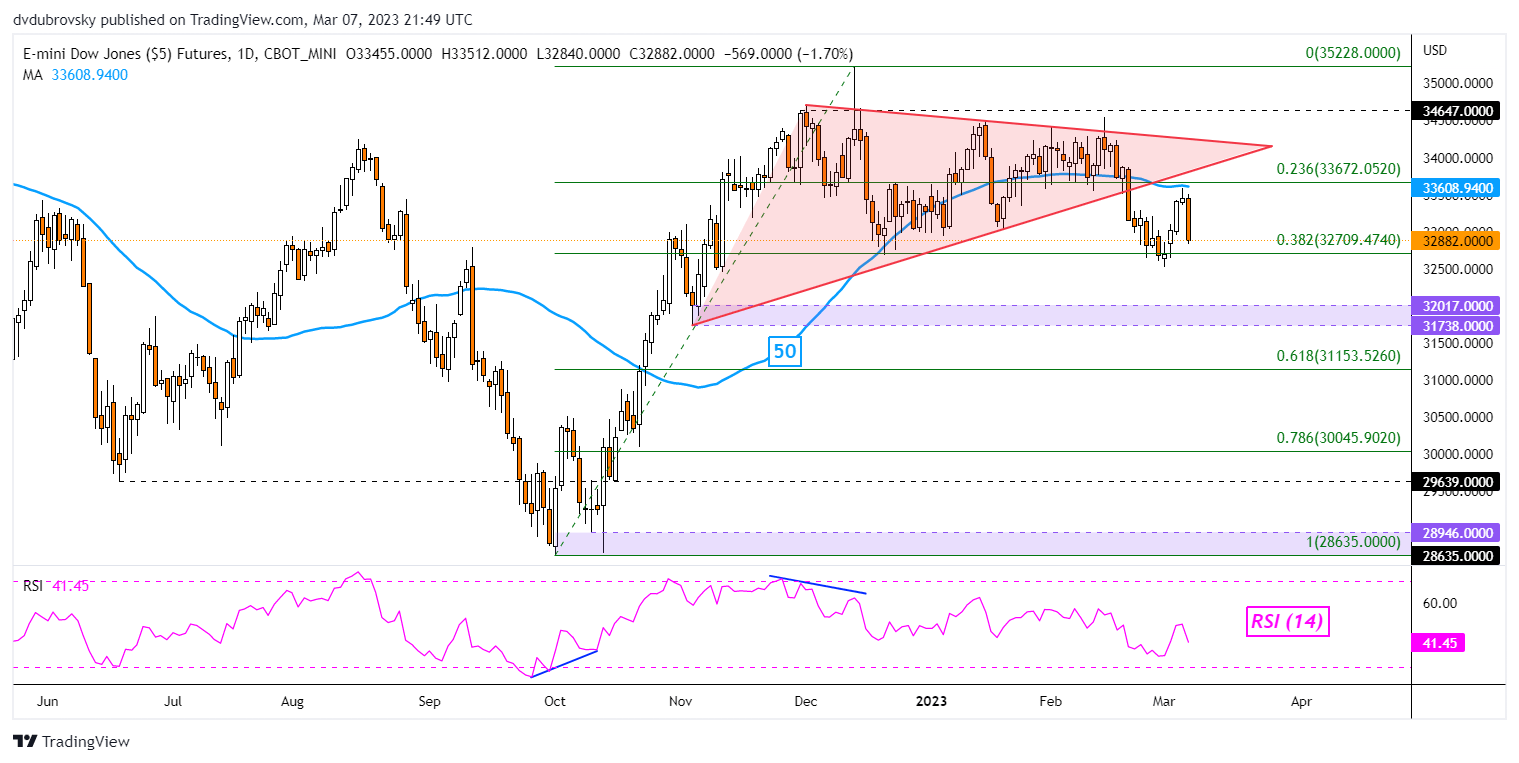
The Dow Jones turned lower after rejecting the 50-day Simple Moving Average (SMA). This also followed a breakout under a Symmetrical Triangle chart formation. This is placing the focus on immediate support, which is the 38.2% Fibonacci retracement level at 32709.

Daily Chart

Dow Jones Technical Analysis

S&P 500 Technical Analysis

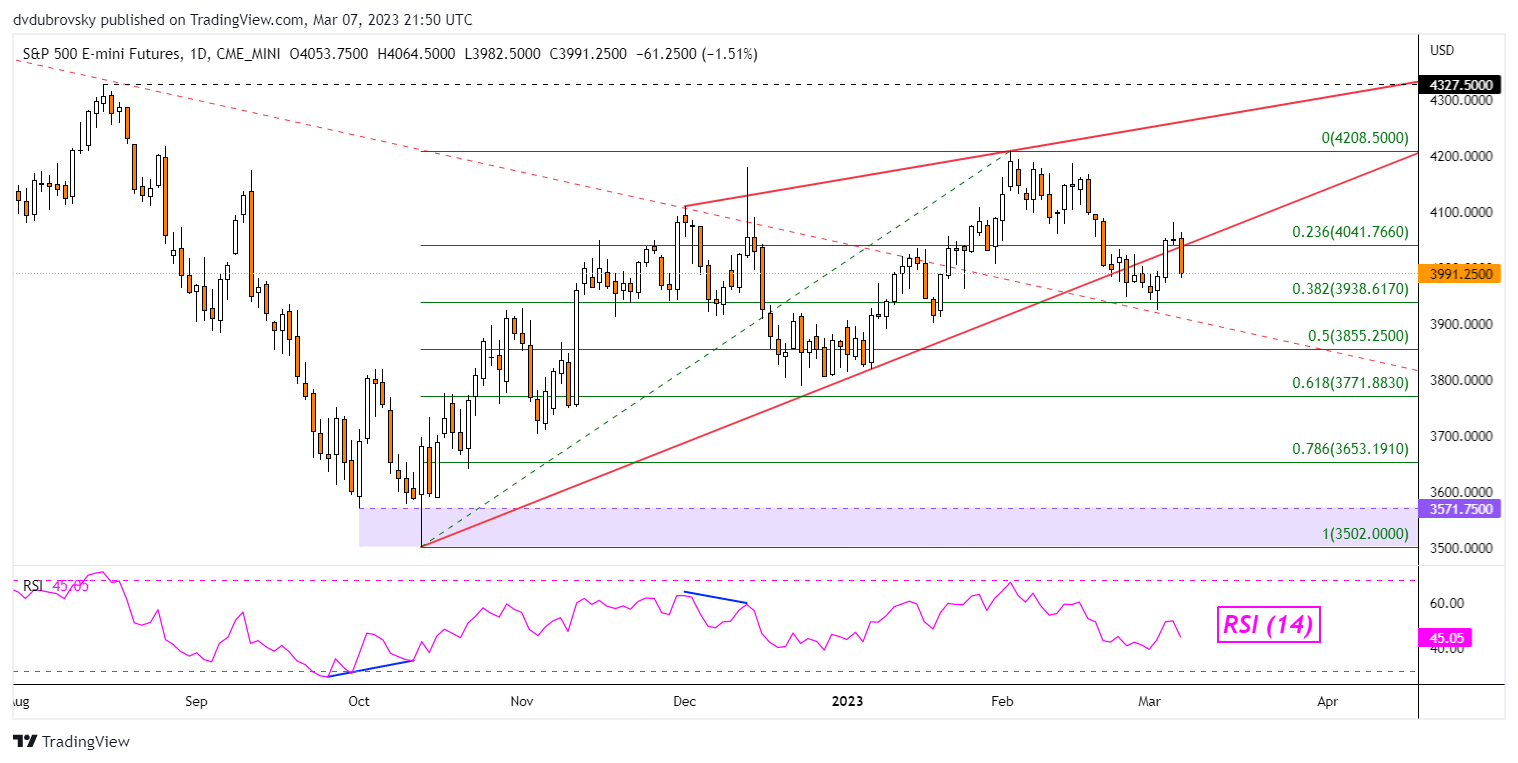
Meanwhile, the S&P 500 rejected the ceiling of a bearish Rising Wedge chart formation. This is leaving the index also facing the 38.2% Fibonacci retracement level, which here is sitting at 3938.61. Confirming a breakout under the latter would open the door to an increasingly bearish technical bias.

Daily Chart

S&P 500 Technical Analysis

Hawkish vs Dovish: How Monetary Policy Affects FX Trading

Hawkish vs Dovish: How Monetary Policy Affects FX Trading

You have probably heard a financial news presenter say something along the lines of “The central bank governor came out slightly hawkish today after bouts of strong economic data”. The terms Hawkish and Dovish refer to whether central banks are more likely to tighten (hawkish) or accommodate (dovish) their monetary policy.

Central bank policy makers determine whether to increase or decrease interest rates, which have significant impact on the forex market. Policy makers increase interest rates to prevent an economy from overheating (to prevent inflation from going too high) and they decrease interest rates to stimulate an economy (to prevent deflation and stimulate GDP growth).

Hawkish and dovish policies affect currency rates through a mechanism central bankers like to call “forward guidance”. This is policy makers trying to be as transparent as possible in their communications to the market about where monetary policy may be heading.

Keep reading to learn more about hawkish and dovish policies and how to apply this knowledge to your forex trades.

What does hawkish mean?

The term hawkish is used to describe contractionary monetary policy. Central bankers can be said to be hawkish if they talk about tightening monetary policy by increasing interest rates or reducing the central bank’s balance sheet. A monetary policy stance is said to be hawkish if it forecasts future interest rate increases. Central bankers can also be said to be hawkish when they are positive about the economic growth outlook and expect inflation to increase.

Currencies tend to move the most when central bankers shift tones from dovish to hawkish or vice versa. For example, if a central banker was recently dovish, stating that the economy still requires stimulus and then, in a later speech, stated that they have seen inflation pressures rising and strong economic growth, you could see the currency appreciate against other currencies.

Some words that could be used describing a hawkish monetary policy include:

  • Strong economic growth
  • Inflation increasing
  • Reducing the balance sheet
  • Tightening of monetary policy
  • Interest rate hikes

Generally, words used that indicate increasing inflation, higher interest rates and strong economic growth lean towards a more hawkish monetary policy outcome.

What does dovish mean?

Dovish refers to the opposite. When central bankers are talking about reducing interest rates or increasing quantitative easing to stimulate the economy they are said to be dovish. If central bankers are pessimistic about economic growth and expect inflation to decrease or become deflation and they signal this to the market through their projections or forward guidance, they are said to be dovish about the economy.

Some words that could be used to describe a dovish monetary policy, include:

  • Weak economic growth
  • Inflation decreasing/deflation (negative inflation)
  • Increasing the balance sheet
  • Loosening of monetary policy
  • Interest rate cuts

Hawkish vs Dovish Explained

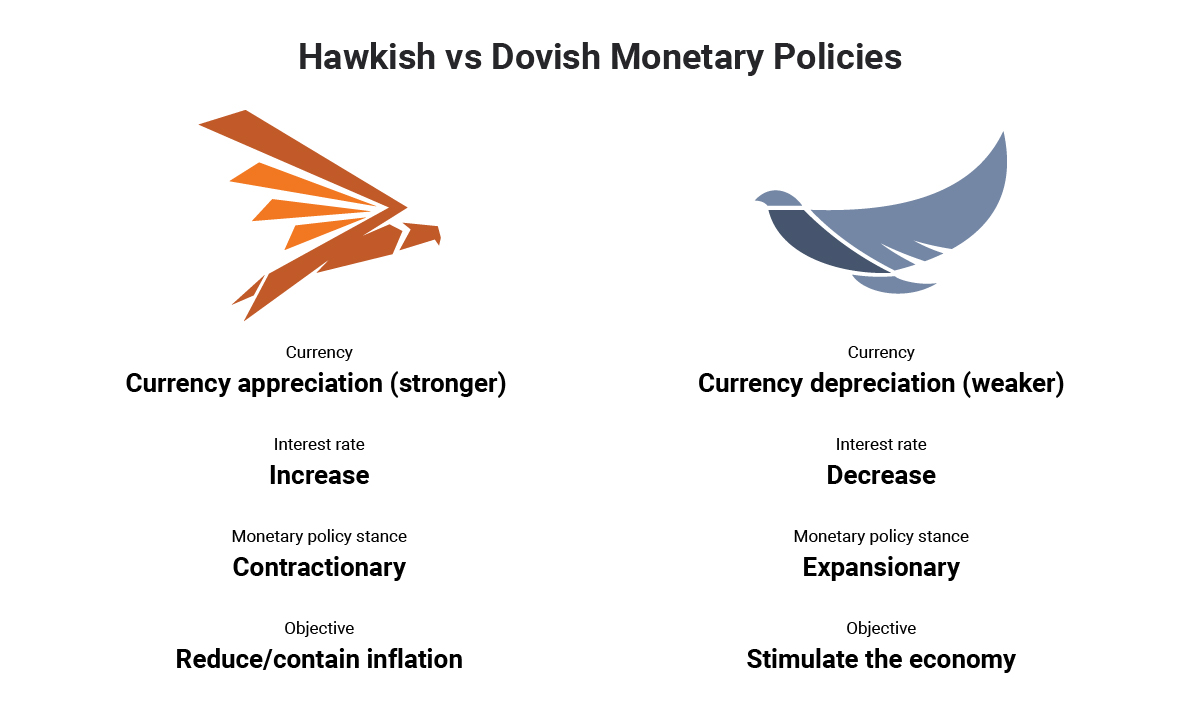
The below graphic provides a snapshot of the main differences between hawkish and dovish monetary policy:
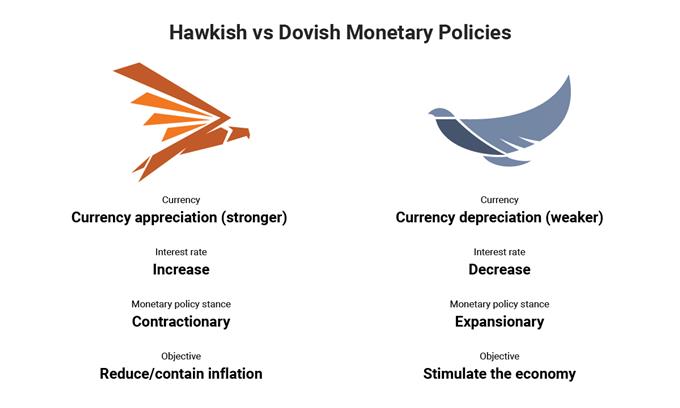
hawkish vs dovishThe table below provides a more in depth comparison on dovish vs hawkish monetary policies, highlighting the differences between the two and how they impact currencies.

Hawkish monetary policies Dovish monetary policies
Increasing interest rates to stem inflation pressures

→ Currency could appreciate as capital flows to higher interest rate currency

Decreasing interest rates to stimulate the economy

→ Currency could depreciate as capital flows to a lower interest rate currency

Reducing the Federal Reserve balance sheet by selling mortgaged backed securities (MBS) and treasuries

→ Currency could appreciate as selling of treasuries and MBS could increase interest rates

Increasing the Federal Reserve balance sheet through quantitative easing (QE). QE is the purchasing of MBS and treasuries that increase the money supply in the economy to stimulate it.

→ Currency could depreciate as an increase in money supply decreases demand for the currency

Forward guidance from central banks include positive statements about the economy, economic growth, and inflation outlook.

→ Currency could appreciate as investors forecast further interest rate hikes

Forward guidance from central banks include negative statements about the economy, economic growth, and signs of deflation.

→ Currency could depreciate as investors forecast interest rate cuts

How to trade a Hawkish or Dovish Central Bank

A slight shift in tone from a central banker could have drastic consequences for a currency. Traders often monitor Federal Open Market Committee meetings and minutes to look for slight changes in language that could suggest further rate hikes or cuts and attempt to take advantage of this.

Monetary policy leaning dovish to hawkishMonetary policy standing as at 1 January 2019

The image above shows the different central banks current monetary policy stance. When a central banks’ monetary policy stance moves more towards the left (dovish) their currency could depreciate against other currencies. If the monetary policy stance moves more towards the right (hawkish) their currency could appreciate.

Trading a hawkish or dovish central bank isn’t as easy as buying a hawkish central bank currency or selling a dovish central bank currency. It has to do with changing interest rate expectations. Let’s look at two scenarios:

Scenario 1:

If a central bank is currently in a rate hiking cycle, the market will have already forecasted future interest rate hikes. It is the job of the trader to watch for clues and economic data that could shift the tone of the central bank to either more hawkish than currently, or to dovish. Currencies could move a large amount when the monetary tones shift from what they are currently.

Scenario 2:

Likewise, if a central bank is currently cutting rates and economic data hasbeen negative, the market would have priced-in the current dovish monetary stance. Traders would have to watch the central bankers forward guidance and economic data, which you can find on an economic calendar, for clues to whether they may become more dovish than currently, or hawkish.

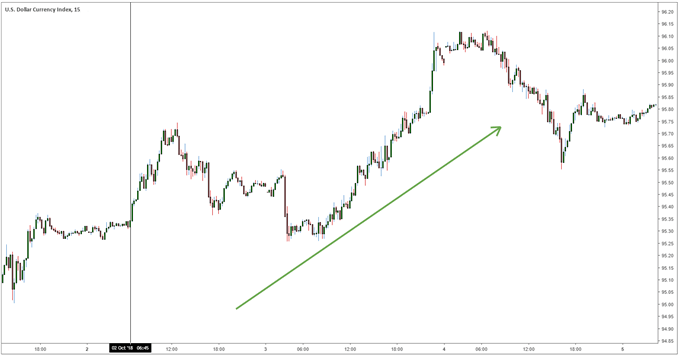
In late 2018 the federal reserve was quite hawkish. Federal Reserve Chairman, Jerome Powell, stated that “we’re a long way away from neutral at this point” which the market perceived as hawkish (2 Oct 2018). This implied that the Federal Reserve still had to hike rates many more times to get to the neutral rate. Then on the 28th of November, the FOMC released their statement of monetary policy in which Jerome Powell said he saw rates at “just below neutral”. This shift in tone is like scenario 1 above, where the central banks shifts tone from hawkish to slightly dovish. Leading to a depreciation of the currency- see the charts below that show what happened to the Dollar Index (DXY) on the October 2, 2018 and then on the November 28, 2018.

October 2, 2018 – Federal Reserve Chairman, Jerome Powell says “We’re a long way away from neutral at this point” leading to appreciation of the Dollar.

15min US Dollar index chart, vertical line indicating October 2, 2018.
2nd October Federal Reserve chairman states that rates are a far away from neutralNovember 28, 2018 Federal Reserve Chairman says that interest rates are “just below neutral” indicating a shift in tone from hawkish to dovish. Dollar depreciations.

15min USD Dollar index chart
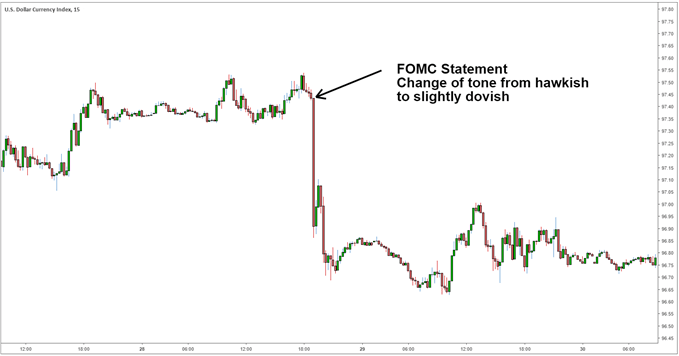
Federal reserve chairman Jerome Powell states that rates are just below neutralKeeping up to date with central banks can be difficult. At DailyFX we have a Central Bank Weekly Webinar where we analyze central bank decisions and keep you up to date with central bank activity.

If you are just starting out on your trading journey it is essential to understand the basics of forex trading in our New to Forex guide. We also offer a range of trading guides to supplement your forex knowledge and strategy development.

Senior Analyst, Tyler Yell of DailyFX sat down with former Federal Reserve Advisor, Danielle Dimartino Booth in a podcast that covered global central bank developments and Danielle’s biggest lesson she learned as a Fed insider.

Crude Oil Prices Sink the Most in 2 Months, Eyes on Key Economic Data Next

Crude Oil Prices Sink the Most in 2 Months, Eyes on Key Economic Data Next

WTI crude oil prices sank 4.08% on Tuesday, marking the worst single-day performance in 2 months. As was the case with most financial assets over the past 24 hours, oil was closely tracking the market reaction to testimony from Federal Reserve Chair Jerome Powell before the Senate Banking Committee.

Long story short, Mr. Powell offered an increasingly hawkish outlook and markets began pricing in a 50-basis point rate hike as the base scenario for this month’s policy announcement. With 14 days to go, the CME FedWatch Tool is showing an almost 75% probability of a 50-bps rate hike in March.

Oil prices can be quite sensitive to interest rate expectations. After all, higher interest rates would serve to slow down the economy to combat high inflation. If that opens the door to slower growth, then that could translate into less demand for WTI.

Focusing on the remaining 24 hours, oil prices are eyeing 2 key event risks. The first is weekly DOE oil inventories. Supply is seen rising by 0.119 million barrels. The second item will be JOLTS job openings data. The latter will offer further insight into the state of the labor market amid the data-dependent Fed.

Crude Oil Technical Analysis – Daily Chart

On the daily chart, WTI seems to be trading within the boundaries of a Bearish Rectangle chart formation. The floor seems to be around 72.27 with the ceiling around 82.13. While prices remain within this pattern, the near-term technical picture may remain neutral. But, a downside breakout opens the door to an increasingly bearish outlook.

Crude Oil Technical Analysis – Daily Chart

Crude Oil Sentiment Analysis – Bearish

Looking at IG Client Sentiment (IGCS), which is a contrarian indicator, about 77% of retail traders are net-long crude oil. Since most traders are net-long, this hints price may continue falling. This is as upside exposure increased by 26.08% and 2.33% compared to yesterday and last week, respectively. With that in mind, these figures seem to offer a stronger bearish contrarian trading bias.

Crude Oil Sentiment Analysis - Bearish


US Dollar Price Setup After Powell: EUR/USD, GBP/USD, USD/JPY

US Dollar Price Setup After Powell: EUR/USD, GBP/USD, USD/JPY

The US dollar looks set to gain further against some of its peers on relative outperformance of the US economy and monetary policy edge. In his semi-annual testimony to lawmakers, US Federal Reserve Chair Jerome Powell stepped up hawkishness, saying the ultimate rate peak likely to be higher than expected and the central bank is prepared to increase the pace of rate hikes if needed.

As a result, odds of a 50-bps rate hike at the March 21-22 FOMC meeting have increased, with US rate futures now pricing in a terminal fed funds rate at 5.63% by September from 5.48% before Powell’s testimony, and 5% at the end of January, close to 100 bps higher than the current Fed policy rate of 4.50%-4.75%.

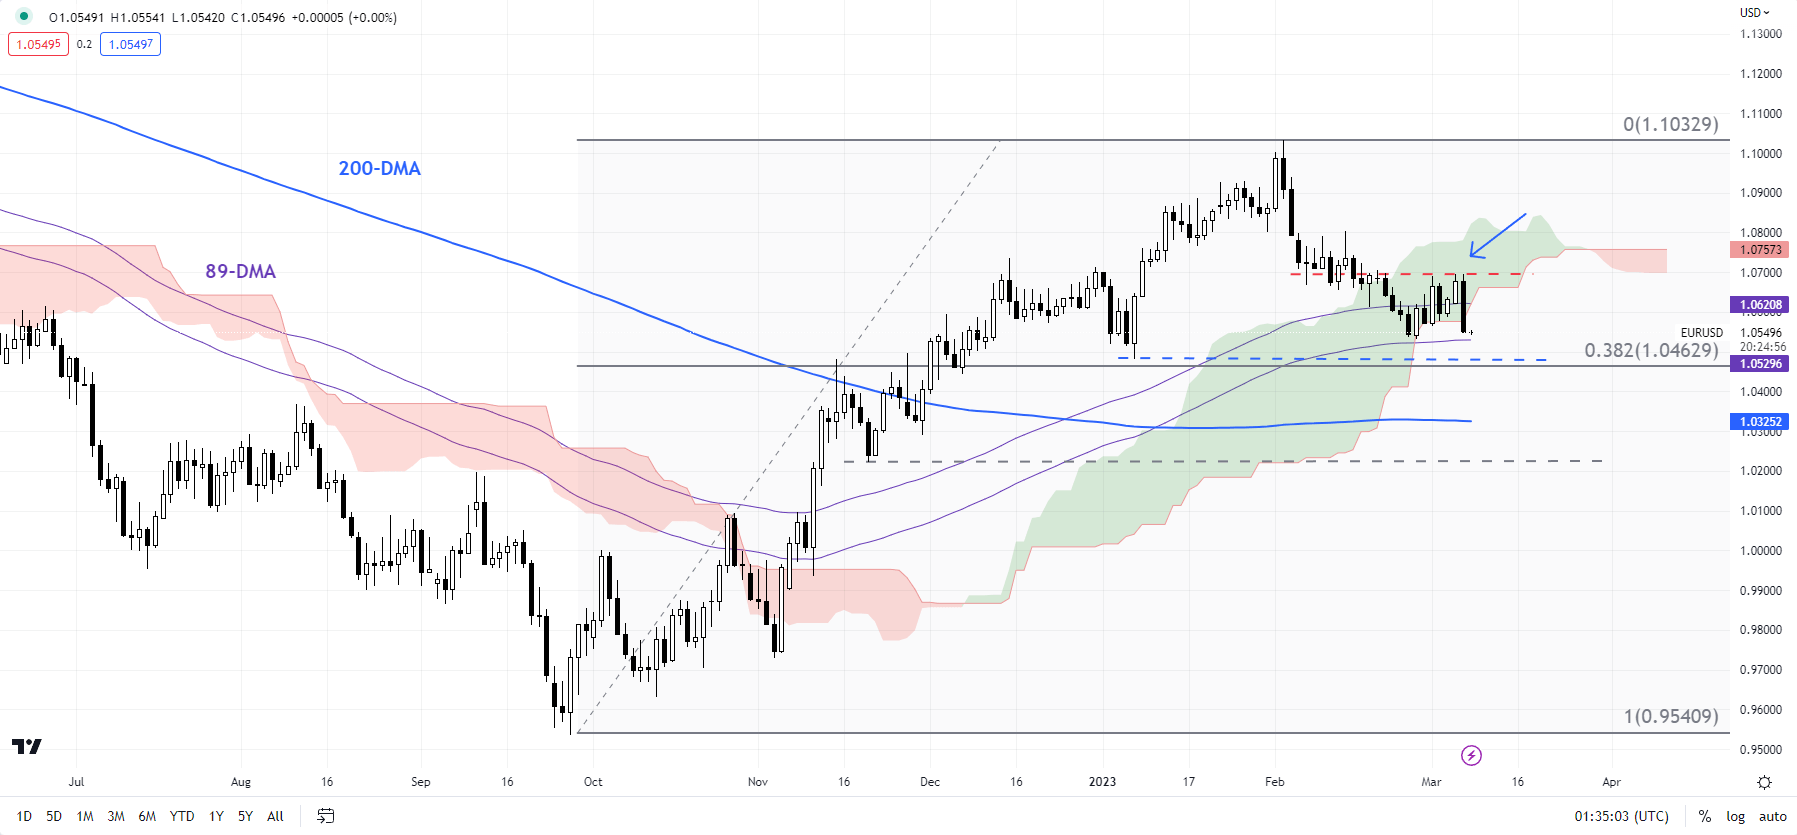
EUR/USD Daily Chart

image1.png

In contrast, other central banks, with the exclusion of the European Central Bank, appear to be turning less hawkish. The market pricing in the Reserve Bank of Australia’s terminal cash rate at 4.03% by August from 3.60% now; just one rate hike by the Bank of Canada to take the policy rate to 4.74% by July from 4.5% now; over 3 rate hikes by the Bank of England to take the terminal policy rate to 4.87% by September from 4% currently; and just one Bank of Japan rate hike by September. However, the market expects the European Central Bank to take its policy rate to 4.24% by early 2024 from 2.5% now.

Moreover, economic momentum since the beginning of February has been in favor of the US, with the US Economic Surprise Index around 10-month highs. In contrast, data in recent weeks have come in below expectations for its peers or just beginning to improve (UK). The exception is Japan where the Economic Surprise Index is at its highest level since mid-2021.

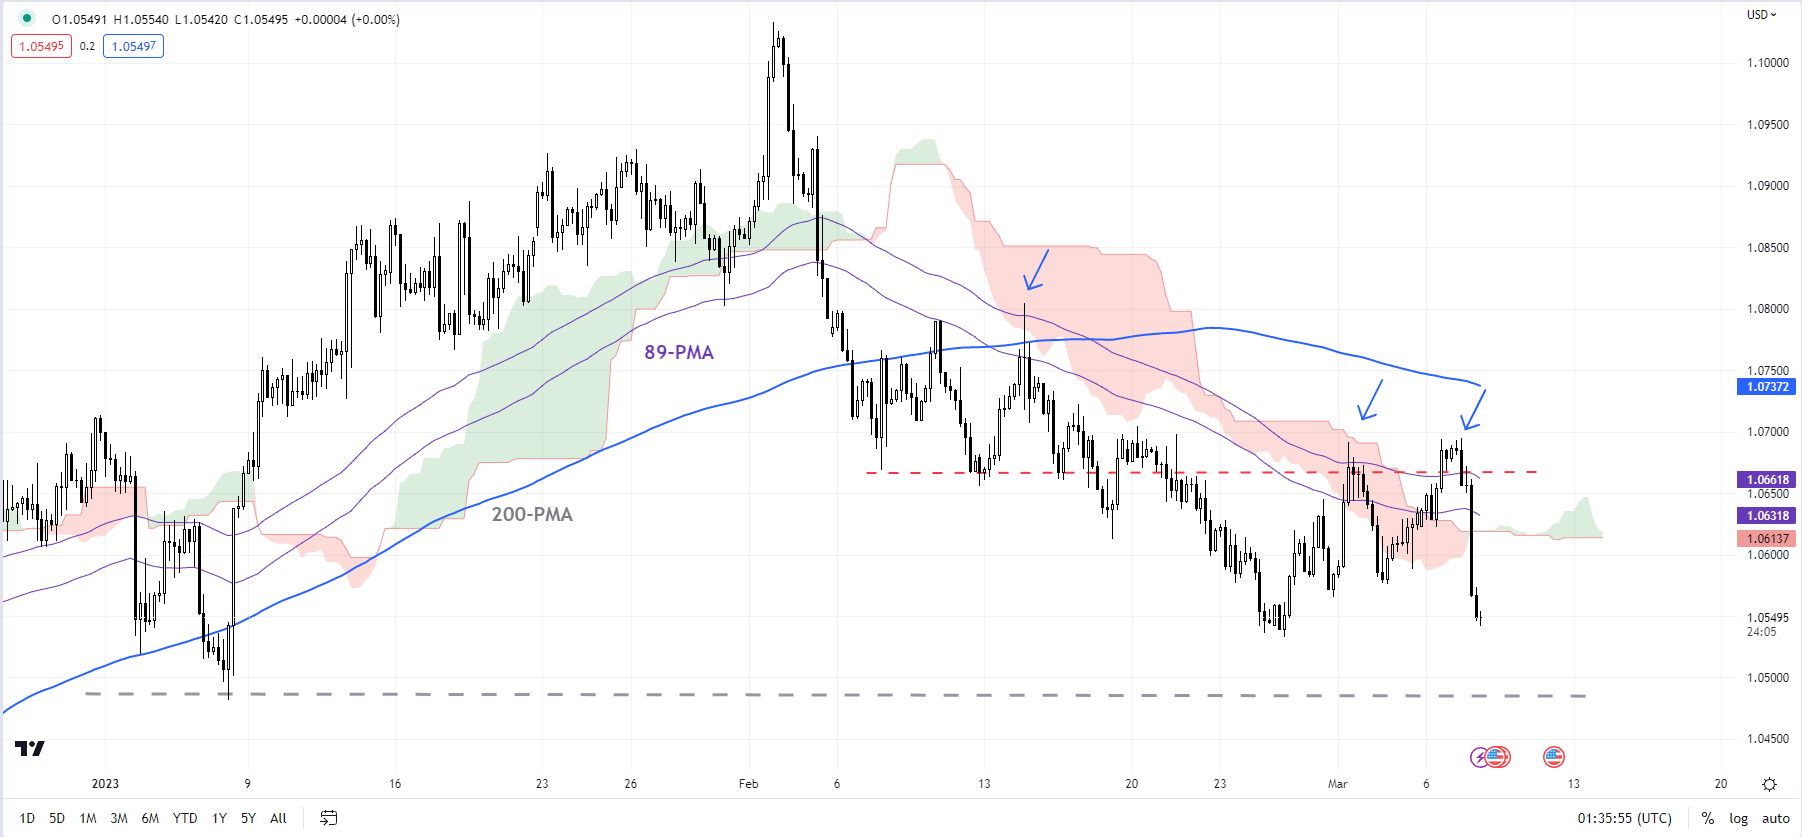
EUR/USD 240-minute Chart

image2.png

EUR/USD – Approaching crucial support

Despite the sharp fall overnight, EUR/USD continues to hold above a vital converged cushion at the January low of 1.0480, coinciding with the 89-day moving average. This support is crucial and any break below would terminate the higher-top-higher-bottom sequence since September, initially exposing the downside toward the 200-day moving average (now at 1.0325). Subsequent support is at the late-November low of 1.0221. On the upside, EUR/USD would need to clear a tough barrier at 1.0650-1.0700 for the immediate downward pressure to fade.

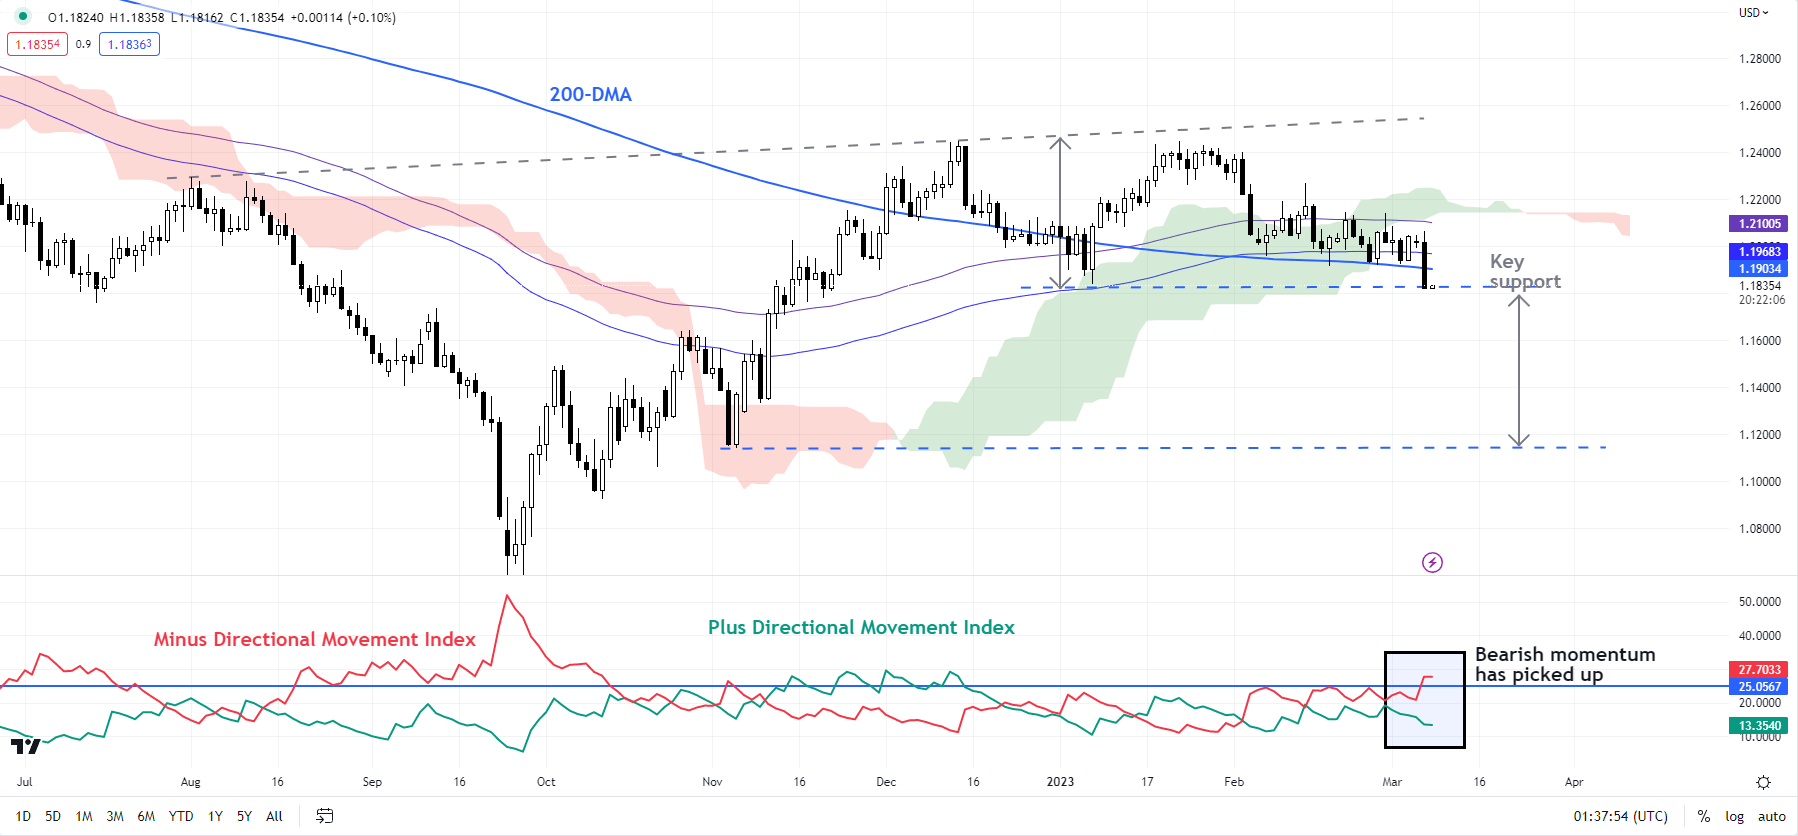
GBP/USD Daily Chart

image3.png

GBP/USD – Risks a double top

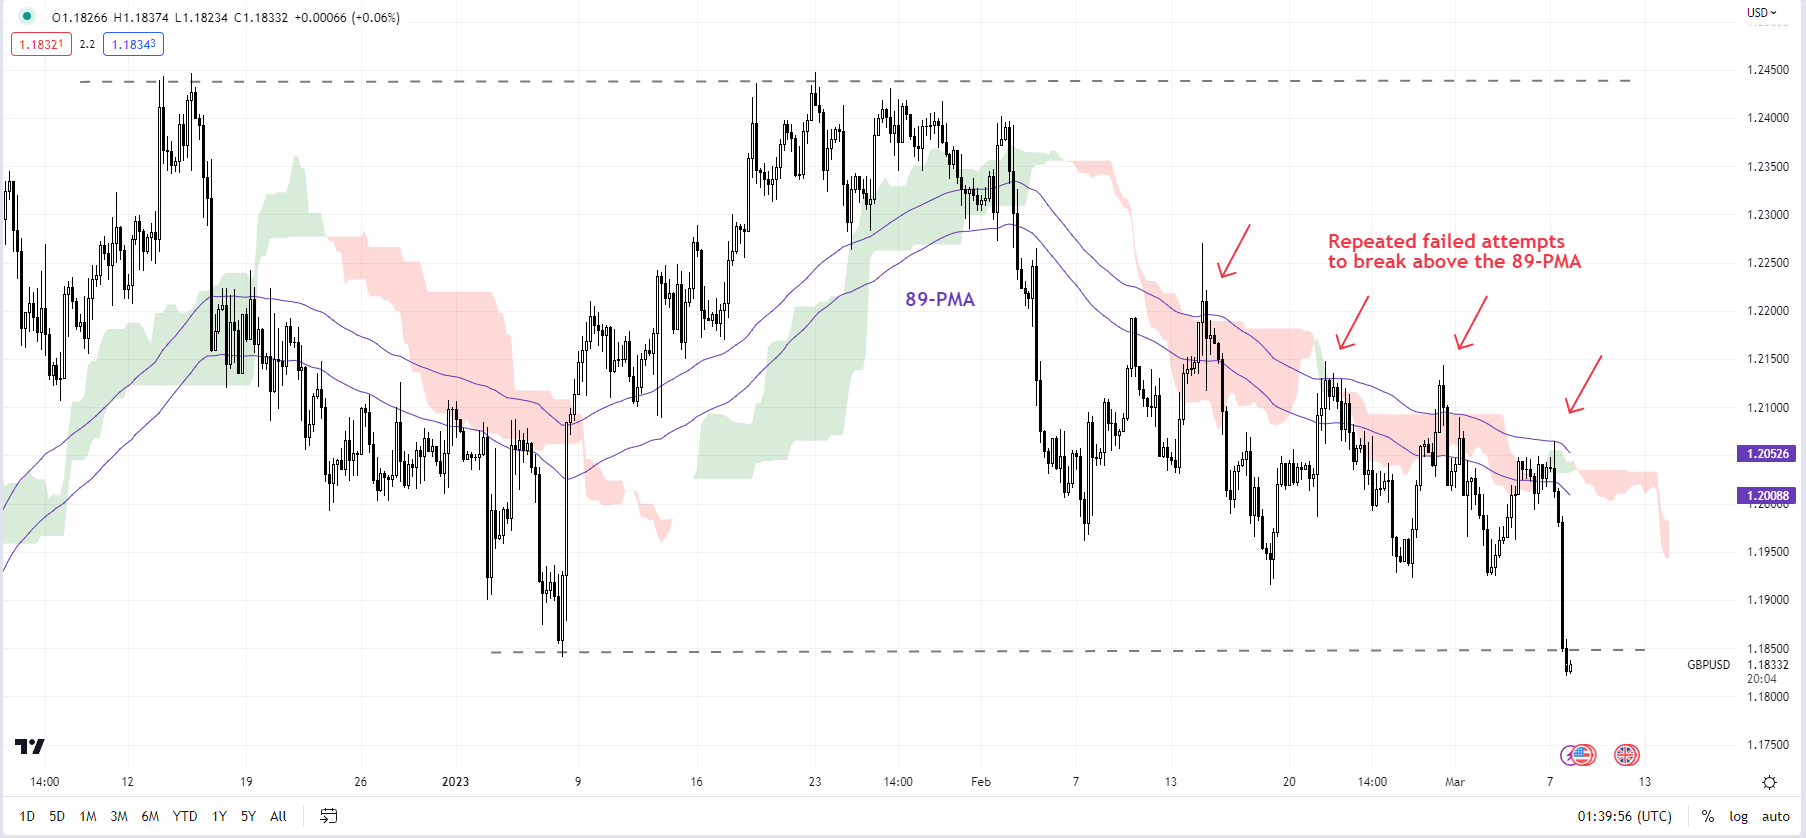
GBP/USD looks vulnerable as it attempts to fall below key converged support of around 1.1840, including the early-January low, the 89-day moving average, and the 200-day moving average. As highlighted in the previous update, a decisive break below would trigger a minor double top (the December and January highs), potentially opening the way toward 1.1250. Also, it would raise the odds that the uptrend since September had terminated. On the upside, at minimum, GBP/USD needs to clear the 89-period moving average on the 240-minute charts for the immediate weakness to begin easing.

GBP/USD 240-minute Chart

image4.png

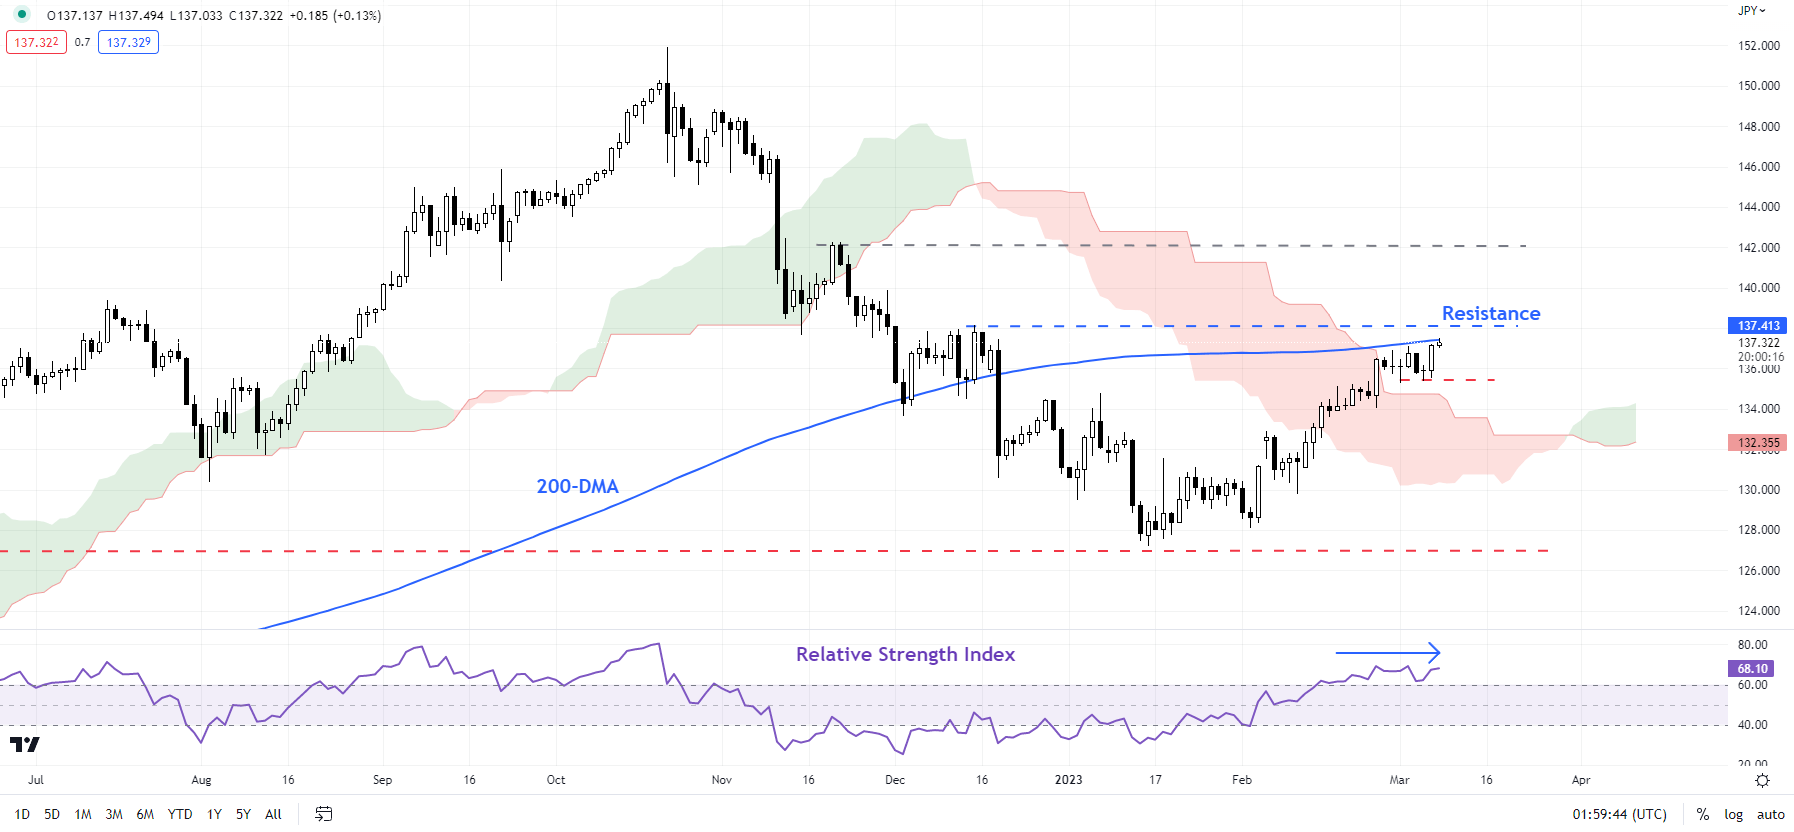
USD/JPY – Flirts with stiff resistance

USD/JPY has been flirting with stiff resistance on the 200-day moving average (at about 137.50), near the December high of 138.20. Momentum, though up, has flattened in recent days, potentially a sign of fatigue – see the 14-day Relative Strength Index on the daily chart. However, unless the USD/JPY breaks below immediate support at the March 1 low of 135.25, the imminent upward pressure is unlikely to fade. A decisive break above 137.50-138.20 could open the door toward the late-November high of 142.25.

USD/JPY Daily Chart

image5.png


Precious Metals Lose Shine After Powell; What’s Next for Gold and Silver?

Precious Metals Lose Shine After Powell; What’s Next for Gold and Silver?

GOLD TECHNICAL OUTLOOK – NEUTRAL

Precious metals appear to be losing shine after US Federal Reserve Chair Jerome Powell stepped up higher rates rhetoric in his semi-annual testimony to lawmakers on Tuesday.

Powell said the ultimate rate peak is likely to be higher than expected and the central bank is prepared to increase the pace of rate hikes if needed. In his previous appearance a month ago, Powell emphasized the ‘disinflation’ theme and stopped short of adopting an aggressive tone following a strong US jobs report. The increased hawkishness on Tuesday pushed the US Treasury 2-year yield to its highest level since 2007, weighing on precious metals.

The odds of a 50-bps rate hike at the March 21-22 FOMC meeting have increased, with US rate futures now pricing in a terminal fed funds rate at 5.63% by September from 5.48% before Powell’s testimony, and 5% at the end of January, close to 100 bps higher than the current Fed policy rate of 4.50%-4.75%.

XAU/USD Daily Chart

image1.png

Chart Created Using TradingView

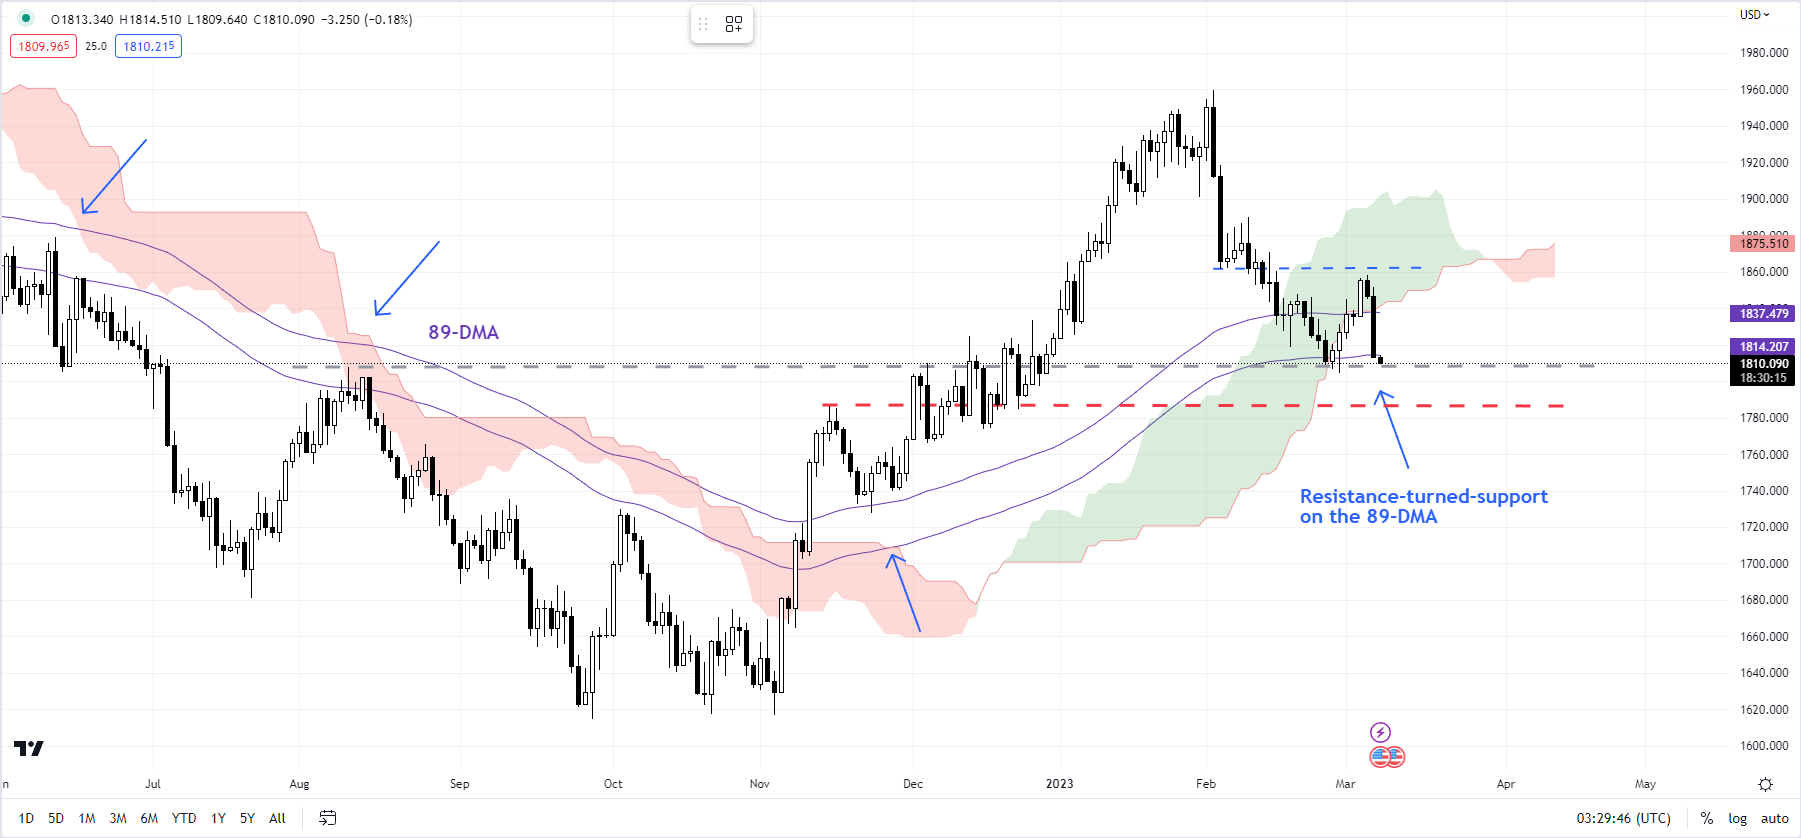
The key focus is now on US jobs data due Mar. 10 and US CPI due Mar. 14. Non-farm payrolls grew 224,000 in February, slower from 443,000 in January, while unemployment is expected to hold near the five-decade low of 3.4%. Consumer price inflation slowed to 6.0% on-year in February from 6.4% in January, but core CPI remained steady at 0.4% on-month. Stronger-than-expected US data could continue to weigh on precious metals.

XAU/USD 240-minute Chart

image2.png

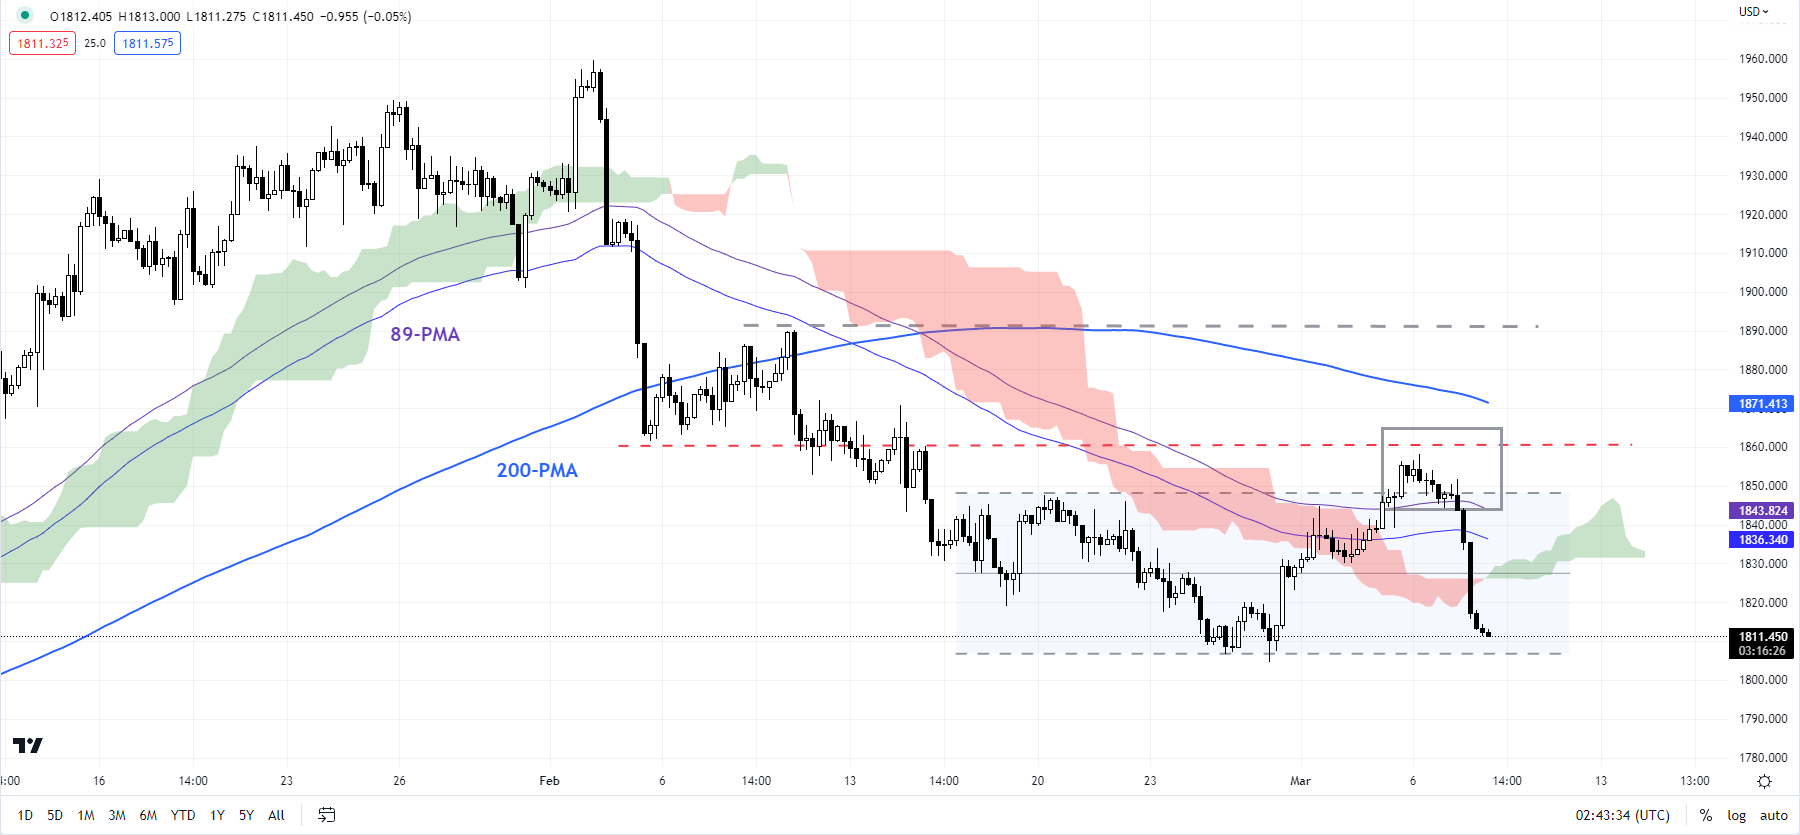
In recent days, XAU/USD has failed to decisively cross above a converged cap on a horizontal trendline from late February (at about 1847) and the early-February low of 1860. For more details see “Gold Looks to Powell for a Confirmation,” published March 6. This follows a rebound from near-strong support at the end-February low of 1804, coinciding with the 89-day moving average. See “Gold Technical Outlook: A Turnaround on the Cards?”, published March 1.

Unless XAU/USD falls the vital cushion zone of 1774-1786, the technical outlook continues to be neutral. The converged area includes the mid-November low of 1774, the 50% retracement of the November-February rise, and the 200-day moving average. Any fall below would derail the rally from the end of 2022.

XAG/USD Daily Chart

image3.png

SILVER TECHNICAL OUTLOOK – BEARISH

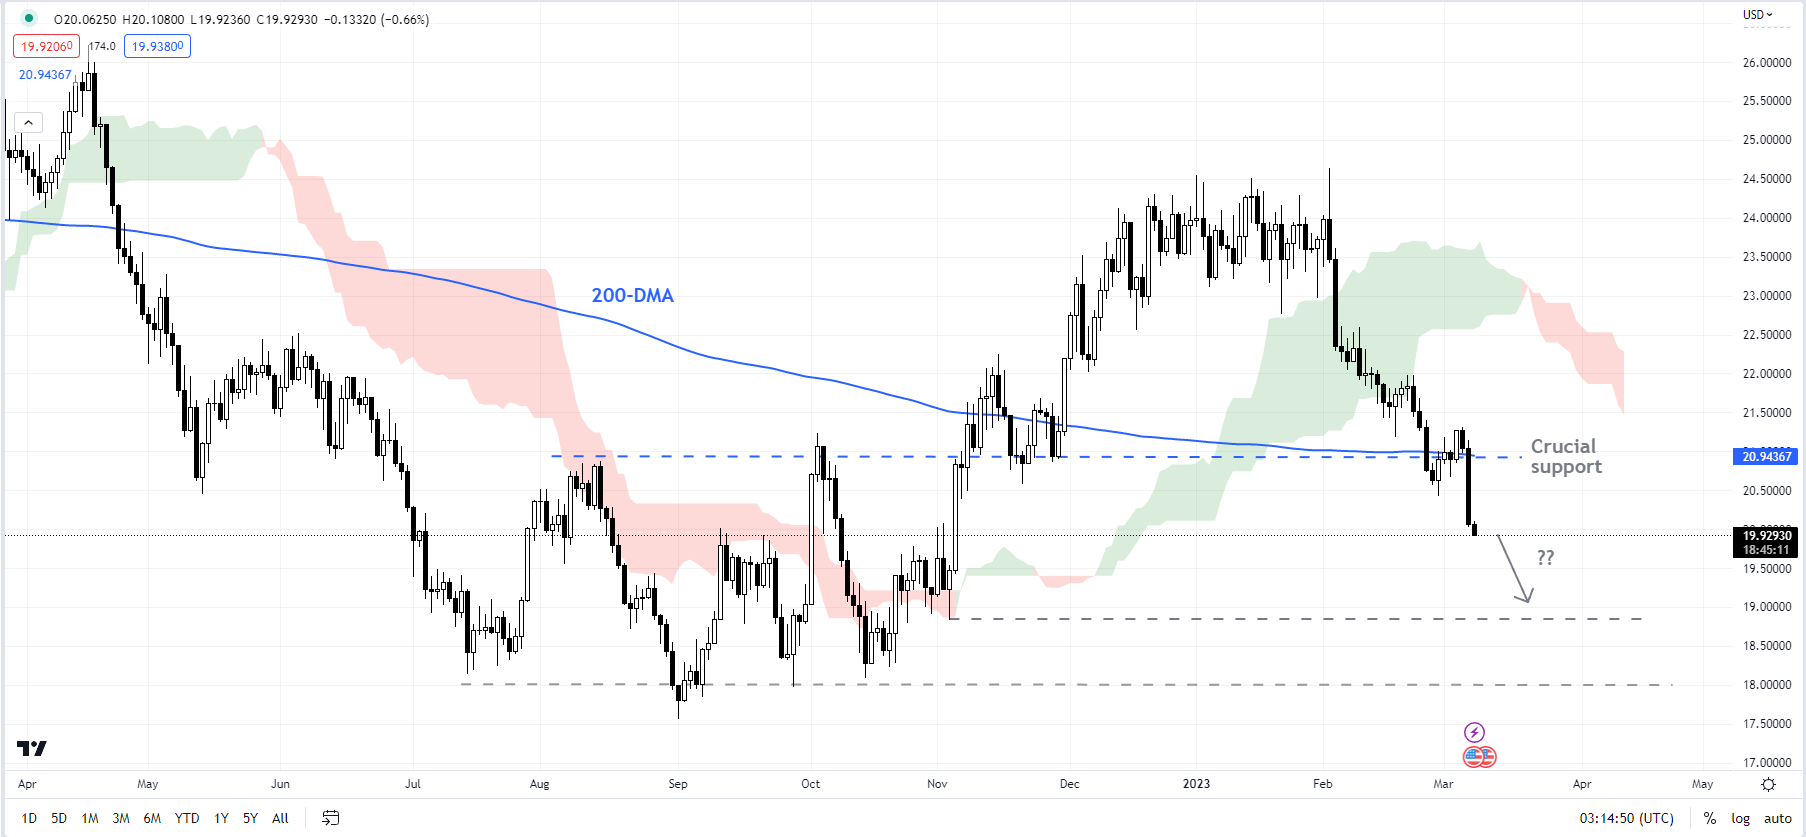
XAG/USD’s fall below a horizontal trendline from October at about 21.25 has confirmed that the four-month-long uptrend has ended. The bearish break has exposed downside risks toward the September low of 17.50. Unless XAG/USD can clear the immediate ceiling at Monday’s high of 21.30, the path of least resistance remains sideways to down.

Canada: strengthen productivity to boost living standards and prioritise the low-carbon transition, says OECD

Canada: strengthen productivity to boost living standards and prioritise the low-carbon transition, says OECD

The latest OECD Economic Survey of Canada says faster growth in living standards will require strengthening the business environment, to bring Canada’s weak productivity and investment growth back in line with leading OECD economies. Reforms to improve tax and spending efficiency would help federal and provincial governments to keep financing key commitments without putting pressure on budgets.

Canada’s economic output recovered to pre-pandemic levels by early 2022. Global price pressures have since driven up inflation, albeit by less than in many other OECD countries. As an open economy, Canada will be vulnerable going forward to any sudden slowing in global demand and to volatility in commodity and financial markets from the war in Ukraine.

“Like many economies, Canada faces the difficult challenge of tackling inflation without undermining economic activity,” OECD Acting Chief Economist Alvaro Pereira said, presenting the Survey at an event in Ottawa hosted by the Canadian Association of Business Economics and the Ottawa Economics Association. “Fiscal and monetary policy need to work in tandem to ease inflation pressures while governments shore up public finances. Meanwhile more needs to be done to strengthen productivity through removing barriers to internal trade and competition.”

The Survey welcomes action taken by the federal government to ease cost-of-living pressures, including through increased access to affordable childcare and reduced housing costs for low-income households. In the short term, as cost-of-living increases erode real incomes, it will also be vital to continue targeted support to vulnerable households, favouring use of income support over across-the-board energy cost measures.

The Survey presents updated projections of GDP growth of 1.3% for 2023 and 1.5% for 2024. Tight monetary policy over the past year will help drive down inflation towards 2% by the end of 2024. Public finances are also expected to have strengthened in 2022, helped in part by revenue boosts from higher commodity prices. The consolidated fiscal deficit across all levels of government is estimated to have shrunk to 0.6% of GDP in 2022 after peaking at 11.4% in 2020.

An ongoing review of competition legislation is a positive step towards bolstering the business climate. The Survey recommends prioritising the lightening of restrictions on foreign ownershipin relevant sectors and adapting competition law to handle challenges related to Big Tech. These include barriers to firm entry linked to data access, abusive and exclusionary practices, and lock-in of consumers and businesses to service providers. More can also be done to lower inter-provincial trade barriers and to ease regulatory burdens on businesses.

The Survey also underscores the challenges Canada faces in reaching its climate policy goals. As a major producer of heavy crude oil and natural gas, Canada emits more greenhouse gas emissions per person than most other OECD countries. Its weather and geography contribute to large energy requirements to heat homes, and transport people and goods across large distances, which also drives up the emission-intensity of its economic activity.

The government has put in place multiple policies to decarbonise the economy, but achieving its climate targets and reaching net zero by 2050 will require deep energy savings and widespread action to replace fossil fuels with clean energy. Federal and sub-national governments will need to work together to ensure complementary climate policies create strong incentives for greener production, without a large toll on the economy.

Oil Gains Despite China’s Soft GDP Target, Gold Mixed as Markets Await Powell

Oil Gains Despite China’s Soft GDP Target, Gold Mixed as Markets Await Powell

Major commodities were mixed at the start of the week as different narratives competed for dominance on Wall Street. First, gold (XAU/USD) wobbled, oscillating between small gains and losses around the $1,855 mark as traders avoided taking large directional positions as a precautionary measure ahead of Fed Chairman Powell’s testimony in Washington. Powell is expected to appear before Congress on Tuesday and Wednesday to deliver the central bank’s semiannual monetary policy report and comment on the broad outlook, an event that could spark volatility.

If Powell embraces a hawkish posture in response to sticky inflationary pressures, traders are likely to reprice higher the path of the ongoing tightening cycle, creating headwinds for rate-sensitive assets, including precious metals. This scenario could undermine gold prices in the near term.

Elsewhere, oil prices, as measured by one-month WTI futures contracts, managed to rise for the fifth consecutive day, up about 1% to $80.50 per barrel, but the advance was limited as news that China set a lower-than-forecast gross domestic product target for the year dented appetite for some commodities. For context, the Chinese government adopted a goal of around 5% GDP growth for 2023 versus 6.0% expected, the lowest in decades, as domestic and global challenges continue to pose risks to the Asian economy.

China’s disappointing economic growth objective indicates that the authorities are unlikely to ramp up aggressive stimulus measures in the near term to bolster the post-pandemic recovery, a situation that could cap the upside in energy markets considering that the country is the world’s second-largest consumer of fossil fuels. This suggests that any upward movement in oil will not follow a straight line despite supply and demand imbalances.

OIL PRICES TECHNICAL ANALYSIS

After recent gains, oil is trading near a key technical resistance in the $80.60 area, a ceiling created by February’s swing high. If bulls manage to drive prices above that barrier, buying interest could pick up momentum, setting the stage for a sprint toward the psychological $83.00 level. On the flip side, if sellers return and trigger a bearish reversal, initial support lies at $77.50. On further weakness, the focus shifts to a short-term rising trendline crossing the $73.60 region.

OIL PRICE (WTI FUTURES) TECHNICAL CHART

Chart, line chart, histogram  Description automatically generated


Natural Gas Prices Reverse on Milder Weather Outlook, Rising Wedge Breakout Eyed

Natural Gas Prices Reverse on Milder Weather Outlook, Rising Wedge Breakout Eyed

Daily Chart – Worst Day Since June 2022

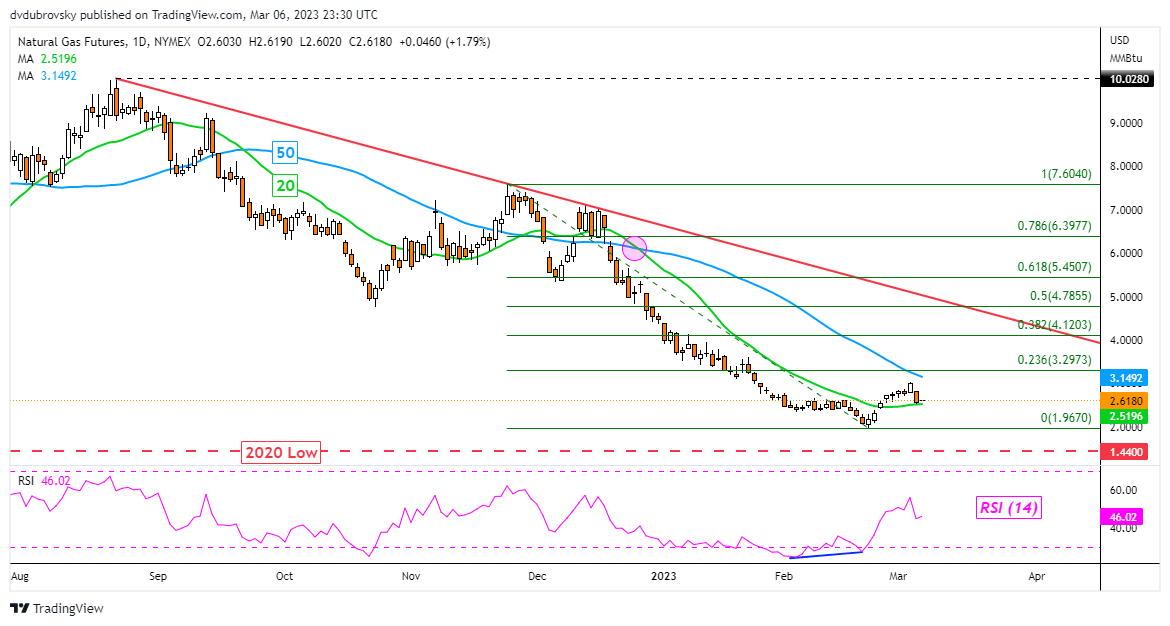
Natural gas prices abruptly turned lower on Monday after completing the best week since July. The 14.52% drop represented the worst 24-hour period since June 2022. From a fundamental standpoint, the weather was a key driver for the heating commodity. According to Bloomberg, US weather estimates shifted milder over the weekend. That would likely open the door to less demand amid still-elevated inventory levels.

Focusing on the daily chart below, natural gas is back to the 20-day Simple Moving Average (SMA). The latter is immediate support. A confirmatory breakout lower could open the door to revisiting the February low at 1.967. Beyond the latter is the 2020 bottom at 1.44. Meanwhile, immediate resistance is a combination of the 50-day SMA and the 23.6% Fibonacci retracement level at 3.297.

Daily Chart – Worst Day Since June 2022

4-Hour Chart – Rising Wedge Breakout in Focus

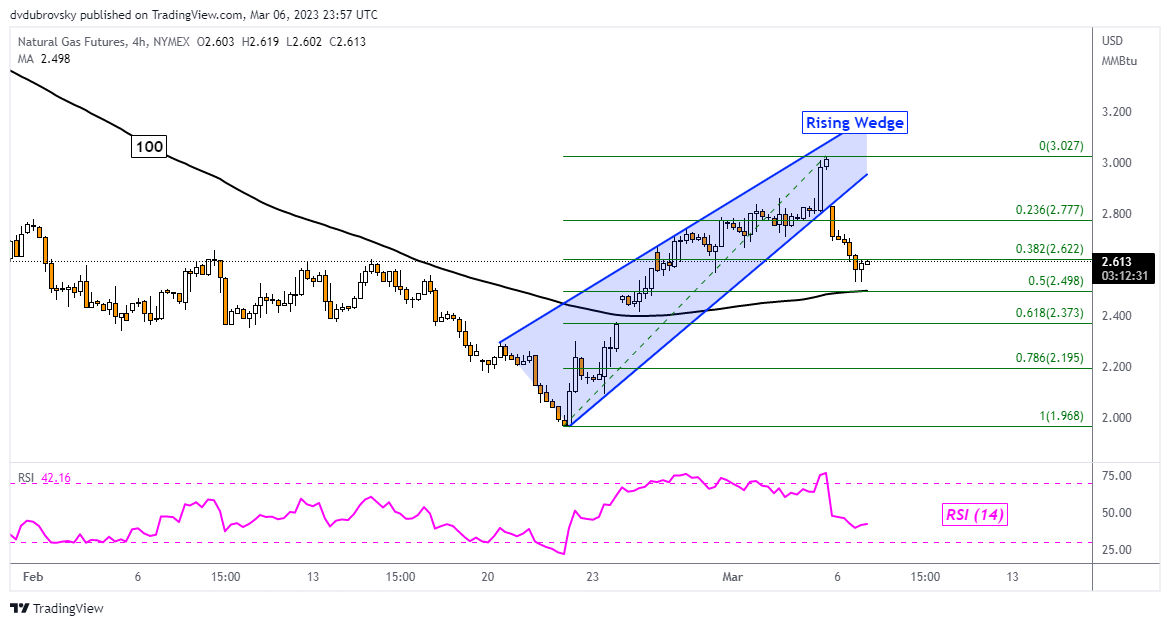
Things are starting to look bearish again in the near-term 4-hour timeframe. Since the end of February, I have been highlighting a bearish Rising Wedge chart formation that has been brewing. Overnight, natural gas has confirmed a breakout under this pattern. This is opening the door to resuming the downtrend that occurred from the end of December to the end of February.

Immediate support is a combination of the 100-period SMA as well as the midpoint of the Fibonacci retracement level at 2.498. Clearing these technical obstacles exposes the 61.8% and 78.6% levels at 2.373 and 2.195, respectively. On the other hand, immediate resistance is at the 38.2% level at 2.622 before the 23.6% point at 2.777 comes into focus.

4-Hour Chart – Rising Wedge Breakout in Focus

Euro Bounces on Hawkish ECB Ahead of Powell’s Testimony. Higher EUR/USD?

Euro Bounces on Hawkish ECB Ahead of Powell’s Testimony. Higher EUR/USD?

EUR/USD jumped higher to start this week ahead of Federal Reserve Chair Jerome Powell’s testimony to Senate Banking Committee in Washington on Tuesday and Wednesday.

Additional event risk may also lie in the Euro wide GDP figures that will be seen on Wednesday.

Overnight comments from Robert Holzmann boosted the Euro when he said that he could see a 50 basis point lift to rates at the next four European Central Bank (ECB) meetings. Mt Holzmann is a policy maker for the ECB and Governor of Austria’s central bank, the Oesterreichische Nationalbank (OeNB).

Looking forward, it seems that commentary from central bank officials could be the driver for EUR/USD alongside other currency markets and bond markets in general.

The ECB are due to convene on Thursday 16th March ahead of the Fed that will start their gathering the following week on March 22nd.

EUR/USD TECHNICAL ANALYSIS

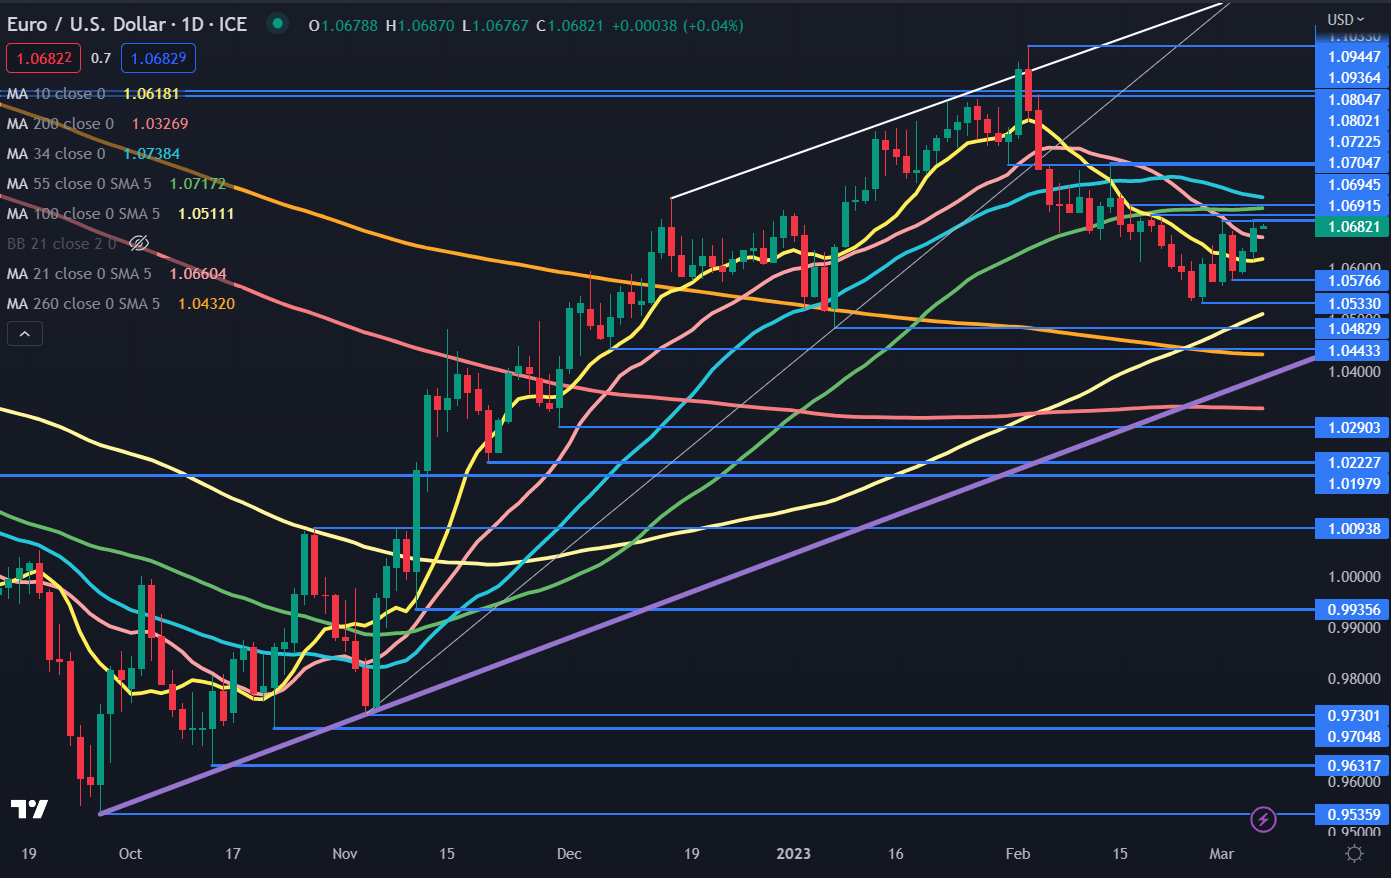
EUR/USD has been in a 1.0533 – 1.0722 range for three weeks despite several attempts to overcome the topside of this range. Those peaks have setup a potential resistance in the 1.0700 – 1.0720 area.

The 55-day simple moving averages (SMA) also currently resides at 1.0717 and may lend possible resistance. The 34-day SMA is also just above there at 1.0738.

The price is currently above the 10-, 100-, 200- and 260 day SMAs and the rally overnight went above the 21-day SMA. If it does move above the 34- and 55-day SMAs, it will be above all short, medium and long-term daily SMAs and might indicate that bullish momentum is evolving.

Resistance could be further up at the breakpoints and prior peaks of 1.0805, 1.0936, 1.0945 and 1.1030.

Overall, EUR/USD remains in an ascending trend channel and support could be at the lower bound of the channel, currently at 1.0390. Ahead of there, the previous lows of 1.0577, 1.0533, 1.0483 and 1.0443 may lend support.

image1.png

Australian Dollar Slides After RBA’s Widely Expected 25-Basis Point Hike

Australian Dollar Slides After RBA’s Widely Expected 25-Basis Point Hike

AUD/USD plunged after the Reserve Bank of Australia hiked the benchmark cash rate by 25 basis points in an attempt to control inflation running at three-decade highs and left the door open for further rate hikes, raising concerns that the central bank could overtighten.

The Reserve Bank of Australia raised the cash rate by a quarter percentage point to 3.60% and said further tightening of monetary policy will be needed. The move was widely expected after inflation rose to a three-decade high last quarter, well above the central bank’s target range of 2%-3%. Last month, the bank abandoned its previous plan to pause at 3.35% and signaled more hikes would be needed. The RBA is not an exception in warning of further tightening. Central bankers, including the US Fed and the European Central Bank, have said more work needs to be done to tackle inflation.

AUD/USD 5-minute Chart

image1.png

Meanwhile, China on Sunday set a growth target of around 5%, below last year’s target of around 5.5% at the annual session of its National People’s Congress. The target was at the lower end of the range expected by analysts, weighing on AUD/USD. However, stronger-than-expected China manufacturing and services activity data last week indicates that the economic reopening is beginning to show in activity data. Given that China is Australia’s biggest export market, any improvement in China’s growth outlook could boost Australia’s growth prospects.

For now, though, the focus is on US Fed Chair Powell’s semi-annual testimony to lawmakers later today and tomorrow. His remarks will be closely watched as financial markets look for further guidance on monetary policy given strong US data in recent weeks. In particular, markets will be watching for cues regarding the Fed’s hiking path, particularly if policymakers are contemplating resorting to aggressive rate hikes. In his previous appearance a month ago, Powell emphasized the ‘disinflation’ theme and stopped short of adopting an aggressive tone following a solid US jobs report. US rate futures are pricing in the Fed’s target rate to peak around 5.48% in September from the current 4.50-4.75%, compared with under 5% at the end of January.

Australia Rates Expectations

Chart, line chart  Description automatically generated

In contrast, Australia’s macro data since the beginning of March have been underwhelming, as reflected in the Economic Surprise Indices (ESI) – the Australian ESI is languishing around the 2020 lows, while its US counterpart is at the highest level in 10 months. The diverging growth outlook has weighed on AUD/USD in recent weeks.

AUD/USD Daily Chart

image3.png

On technical charts, AUD/USD has faced stiff resistance at last week’s high of 0.6780, roughly coinciding with the 89-period moving average and the upper edge of the Ichimoku cloud on the 240-minute charts. Since the decline began in February, AUD/USD hasn’t been able to cross the 89-PMA and the upper edge of the Ichimoku cloud, so a break above would raise the odds that the pair has found an interim floor. Such a break could pave the way toward the late-February high of 0.6920.

On the downside, AUD/USD has quite a strong cushion at the late-November low of 0.6585 – the pair needs to hold above the support for the four-month-long uptrend to remain intact.