EUR/USD Susceptible to Further Losses Below the 1.0665 Level

EUR/USD Susceptible to Further Losses Below the 1.0665 Level

EUR/USD FUNDAMENTAL OUTLOOK

EURUSD posted modest gains in the Asian session testing a key level of support turned resistance around the 1.06650 handle. The Euro has since struggled to hold onto gains against the greenback with rising geopolitical tensions seemingly keeping the Euro bulls at bay.

Yesterday’s data out of the Eurozone showed further improvement with flash PMIs beating estimates in the service sector while manufacturing was marginally down. The Zew sentiment survey reflected improving sentiment and optimism with expectations and current conditions beating estimates in both the Euro Area and Germany.

This morning brought German Inflation data for January which ticked higher from December backing up comments from ECB President Christine Lagarde for a 50bps hike at the ECB’s upcoming meeting. The Ifo Business Climate for February continued to tick higher with Ifo Economists stating that 45.4% of companies complained about supply chain bottlenecks in February (compared to 48.4% in January) while warning that a German recession will not be avoided but is expected to be mild. A further positive for the Euro Area but a sign that challenges remain.

image1.pngimage2.png

FOMC MEETING MINUTES

Later today we have the Federal Reserve meeting minutes release which will give further insights into how close we came to a 50bps hike in February. It should also provide market participants with an idea of how high Fed policymakers think rates will need to rise moving forward. Given the rise in rate hike expectations last week and the slew of positive data that came after the February meeting I do not think tonight’s release will have a huge impact on markets or be enough to keep the Dollar rally going. Markets are now pricing in the probability of a peak rate of 5.25% in June at 58.7%, up from 46% a week ago and 3.2% a month ago. Should this come to fruition there is every chance that the dollar rally loses steam allowing EURUSD to tick higher as the ECB ramps up its own hawkish rhetoric with a 50bps hike in March looking likely.

Chart, waterfall chart  Description automatically generated

TECHNICAL OUTLOOK AND FINAL THOUGHTS

Without any surprise from tonight’s Fed meeting the main risk for EURUSD to move higher rests with the geopolitical situation developing in Europe. Comments yesterday from both Russian President Vladimir Putin and US Secretary of State Anthony Blinken stoked the risk-off sentiment in markets with further comments today likely to be monitored closely.

From a technical perspective, EURUSD saw a daily candle close below the key 1.06650 level. This key support now resistance level holds the key from a technical standpoint with a push above likely to result in a positive end to the week for the pair.

A break above the 1.06650 handle is likely to result in a push toward the 1.0700 level and potentially higher. Alternatively, should we continue to trickle lower support rests around the 1.0600 handle and below that at 1.0550.

EUR/USD Daily Chart – February 22, 2023

Chart  Description automatically generated

Gold and Silver Forecast: XAU/USD, XAG/USD at Risk as Retail Traders Go Long

Gold and Silver Forecast: XAU/USD, XAG/USD at Risk as Retail Traders Go Long

In recent weeks, gold and silver prices have been aiming lower as traders began pricing out once-anticipated rate cuts from the Federal Reserve towards the end of this year. That has pushed up the US Dollar alongside Treasury yields, denting precious metals. Retail traders have responded by increasing net-long exposure in XAU/USD and XAG/USD. This can be seen by looking at IG Client Sentiment (IGCS), which tends to function as a contrarian indicator. Is more pain ahead?

Gold Sentiment Outlook – Bearish

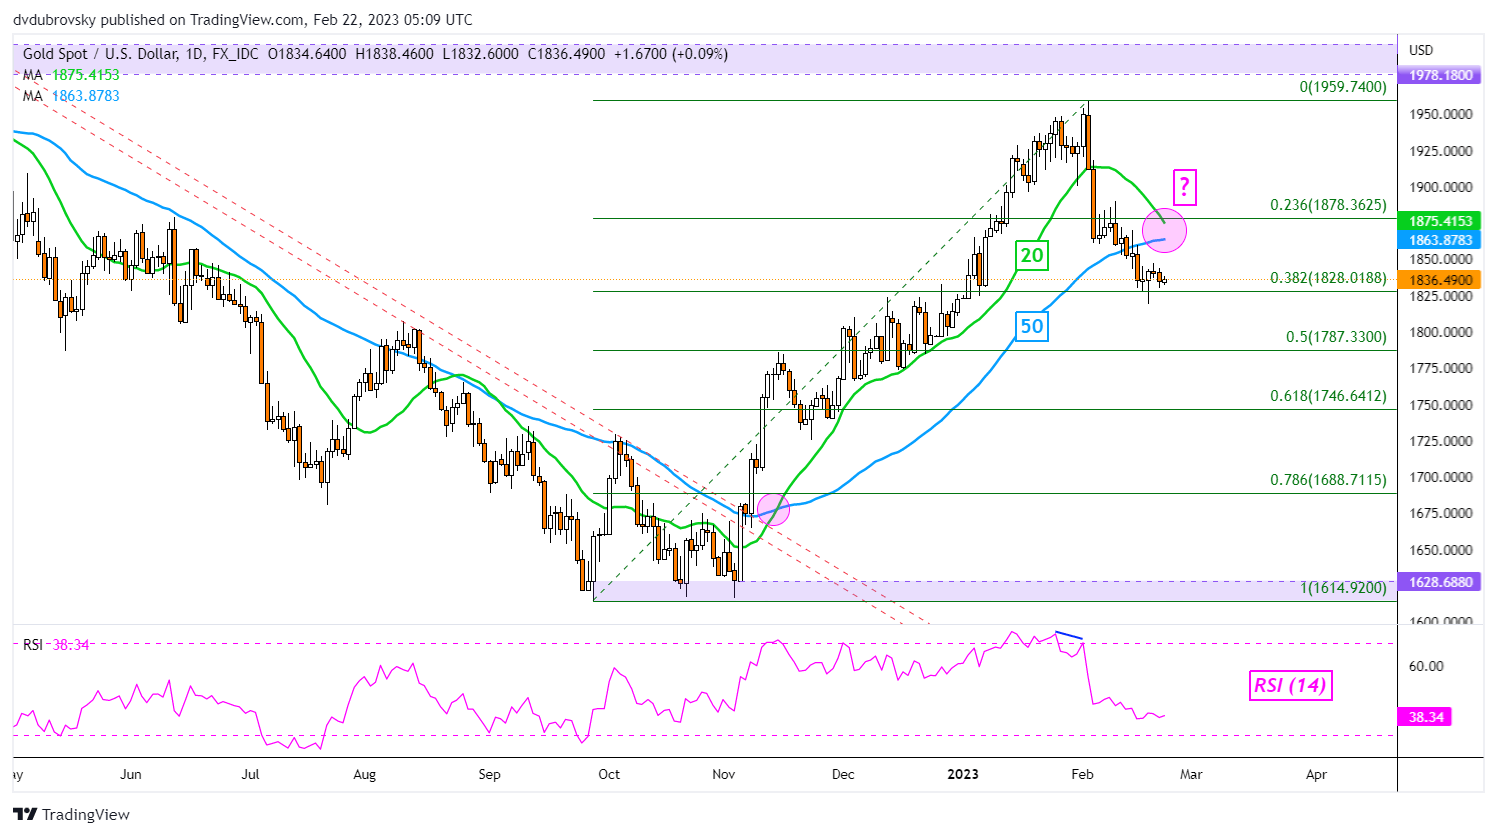
The IGCS gauge shows that about 72% of retail traders are net-long gold. Since most of them are biased to the upside, this suggests that prices may continue falling. Meanwhile, upside exposure has increased by 1.97% and 11.22% compared to yesterday and last week, respectively. With that in mind, the combination of current exposure and recent changes offers a stronger bearish contrarian trading bias.

Gold Sentiment Outlook - Bearish

XAU/USD Daily Chart

In the short-term, gold prices have been consolidating above the 38.2% Fibonacci retracement level at 1828. This followed a breakout under the 20- and 50-day Simple Moving Averages (SMAs), marking a reversal from the November – January uptrend. Now, a bearish Death Cross between the SMAs could be on the horizon – see chart. That may open the door to an increasingly downside technical bias. Breaking lower exposes the midpoint at 1787.

XAU/USD Daily Chart

Silver Sentiment Outlook – Bearish

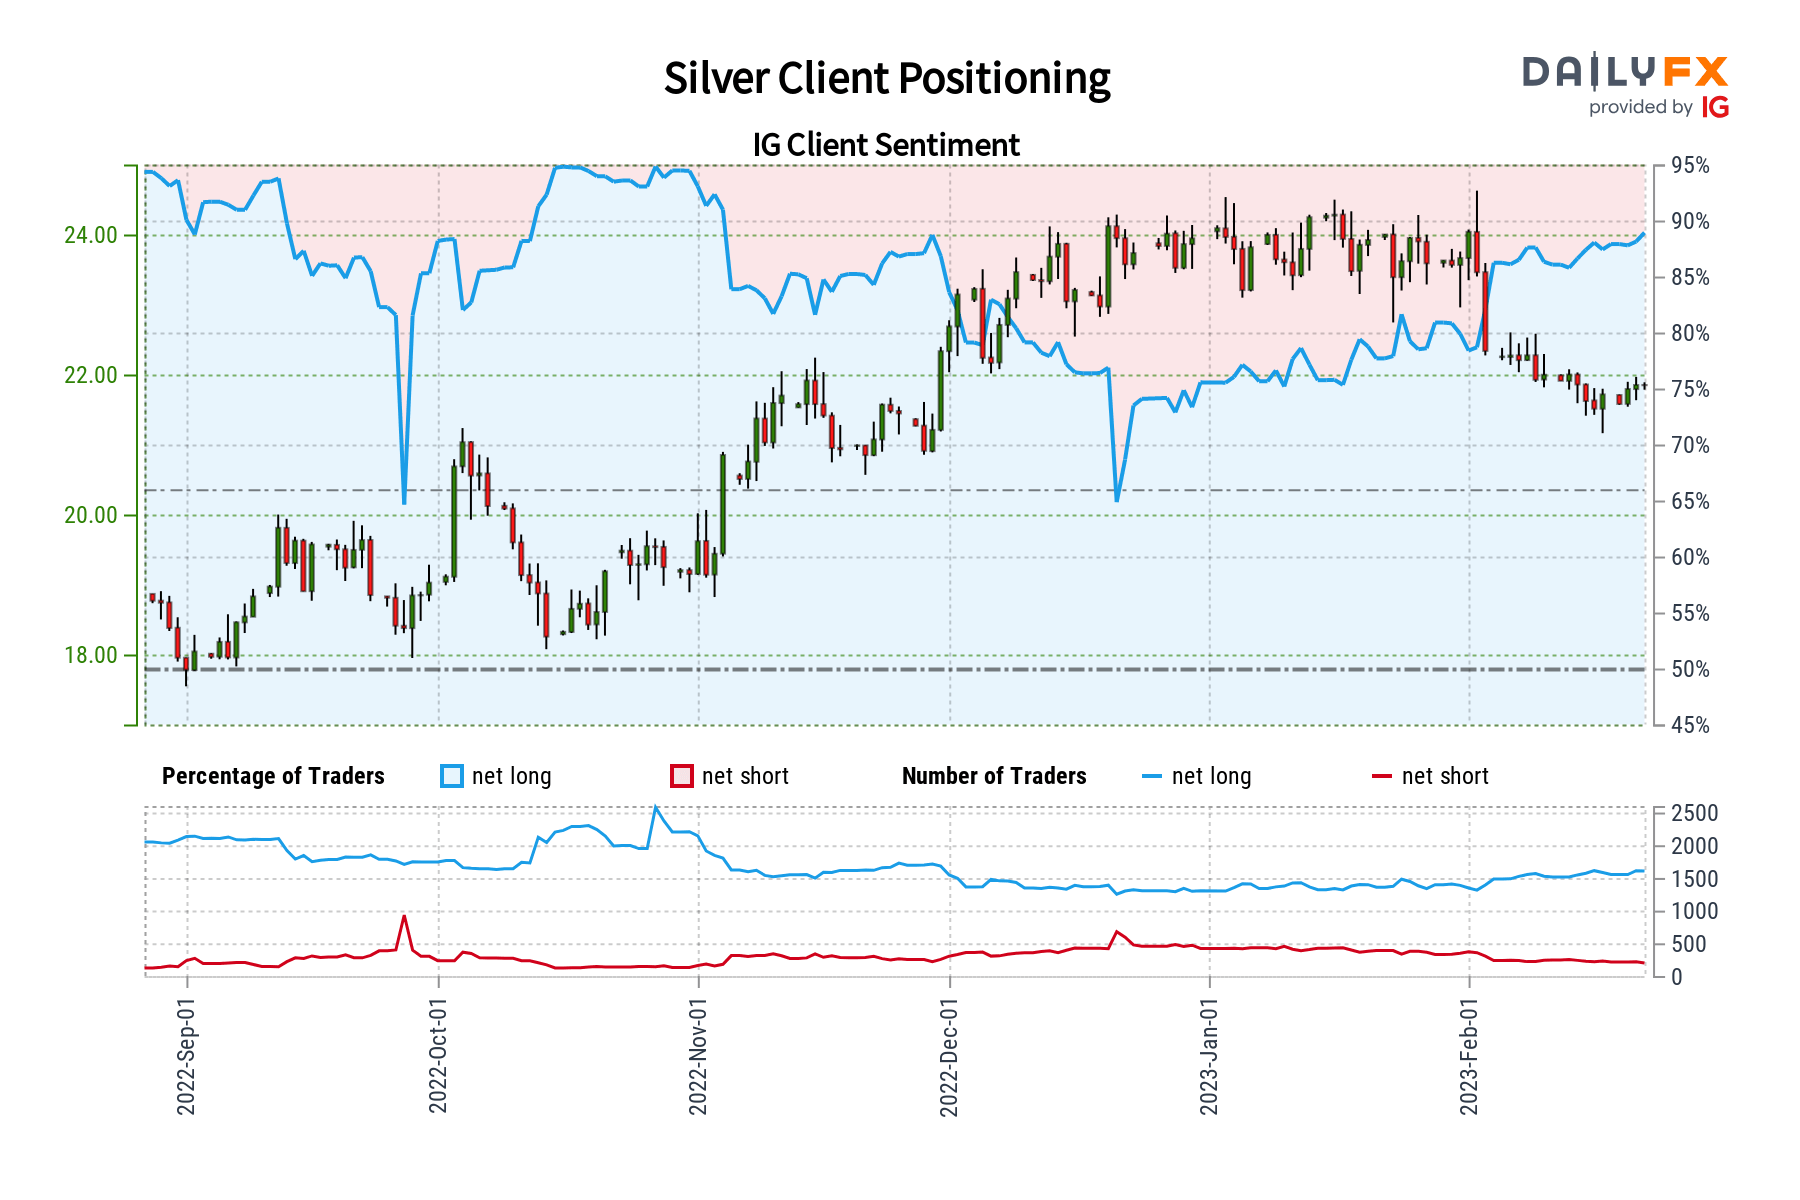
The IGCS gauge shows that about 89% of retail traders are net-long silver. Since most of them are biased to the upside, this hints prices may continue falling. Meanwhile, downside exposure has decreased by 8.72% and 13.1% compared to yesterday and last week, respectively. With that in mind, the combination of overall and recent changes in positioning offers a stronger bearish contrarian trading bias.

Silver Sentiment Outlook - Bearish

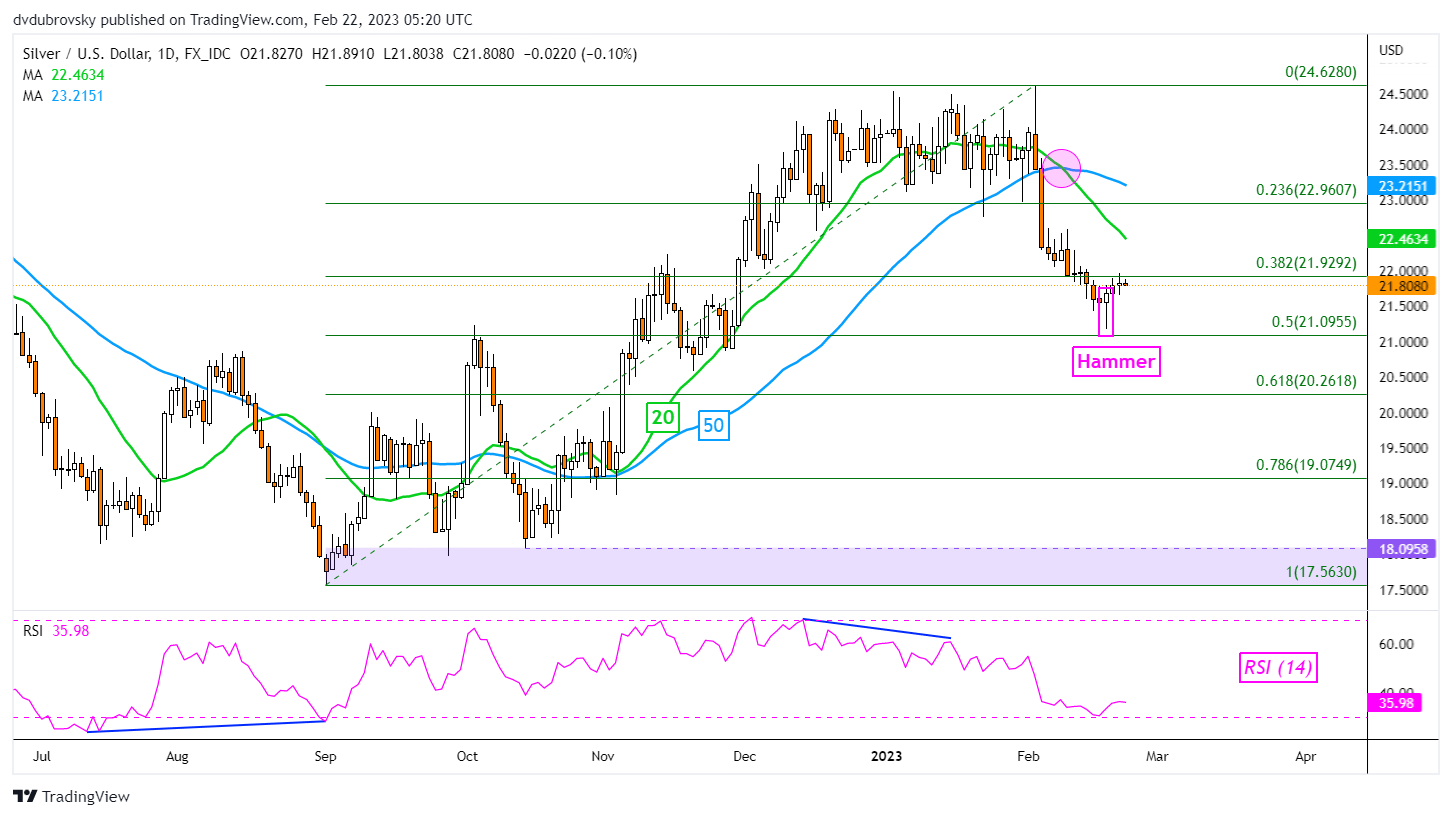
XAG/USD Daily Chart

Silver prices appear to have found the next key level of support just above the midpoint of the Fibonacci retracement at 21.095 – see chart. A Hammer candlestick pattern was left behind recently, which is a sign of indecision relative to the near-term downtrend since late January. Still, a bearish Death Cross between the 20- and 50-day SMAs remains. The latter is offering a downside technical bias. Immediate resistance is the 38.2% level at 21.929. Clearing higher exposes, the 20-day SMA. Otherwise, extending losses places the focus on the 61.8% level at 20.261.

XAG/USD Daily Chart

EUR/GBP prints three-day downtrend below 0.8900 ahead of key EU/UK data

EUR/GBP prints three-day downtrend below 0.8900 ahead of key EU/UK data

EUR/GBP holds lower ground around 0.8870, after recently reversing from the daily top, as bears keep the reins for the third consecutive day to early Tuesday in Europe. In doing so, the cross-currency pair portrays the broad retreat in the Euro, as well as the recovery in the British Pound (GBP), ahead of the key data for the bloc and Britain.

That said, a fresh run-up in the US Treasury bond yields, and the fears emanating from China, North Korea and Russia seemed to have underpinned the market’s rush for the US Dollar as traders from Washington return after a long weekend. As a result, the Euro witnesses a pullback in the demand due to its contrast with the greenback.

It’s worth noting that the recent statistics from the Euro area have been firmer while those from the UK have been mixed, which in turn keeps the pair buyers hopeful ahead of the key numbers. Additionally teasing the EUR/GBP buyers are the hawkish comments from the European Central Bank (ECB) official. That said, ECB governing council member and Finnish central bank Chief Olli Rehn recently said, per Reuters, “ECB should keep raising interest rates beyond March and the rate peak, which should be stuck to for some time, could be reached over the summer.”

On the same line, upbeat prints of Eurozone Consumer Confidence matched the market forecasts of -19 versus -20.9 prior. Further, Germany’s Bundesbank released its monthly report and noted that the economic outlook was somewhat brighter with the short-term outlook turning more favorable than seen just a few months ago.

Alternatively, fears of no imminent Brexit deal should have weighed on the British Pound (GBP) as the UK’s Conservative Members of the Parliament (MPs) dislike the deal with the European Union (EU) on Northern Ireland (NI). Some of them are threatening to resign, per The Times, amid fears of the compromised deal. The news also mentioned that UK Prime Minister Rishi Sunak spent notable time in the House of Commons to convince the MPs that no deal had yet been agreed and talks were continuing. “He was told he ‘hasn’t got a hope’ of succeeding without the support of the Democratic Unionist Party,” per The Times.

Amid these plays, stock futures are down and the Treasury bond yields, as well as the US Dollar, are firmer, which in turn weigh on the Euro amid a sluggish start to the key day.

Looking forward, Eurozone ZEW sentiment figures for February will precede the preliminary readings of the bloc’s, as well as the UK’s, Purchasing Managers Index (PMI) data for the said month to direct short-term pair moves. Given the cross-currency pair’s latest retreat, backed by the market speculations that the Euro rally is about to end amid the European Central Bank’s (ECB) inability to offer higher rates, the sellers may keep the reins unless the scheduled data mark any surprise.

Technical analysis

EUR/GBP fades bounce off the 50-day Exponential Moving Average (EMA), around 0.8815 by the press time, which in turn joins bearish MACD signals and failure to cross the 0.8915-10 horizontal hurdle to keep bears hopeful.

EUR/USD: Downward momentum loses traction – UOB

EUR/USD: Downward momentum loses traction – UOB

Markets Strategist Quek Ser Leang and Senior FX Strategist Peter Chia at UOB Group suggest a sustained decline in EUR/USD has lost impulse as of late.

Key Quotes

24-hour view: “We highlighted yesterday that EUR ‘is unlikely to weaken further’ and we expected it to ‘consolidate within a range of 1.0650/1.0720’. Our view was not wrong even though EUR traded within a narrower range than expected (1.0669/1.0704). The muted price actions offer no fresh clues and EUR could continue to consolidate, likely between 1.0660 and 1.0710.”

Next 1-3 weeks: “We have held a negative view in EUR since last Thursday. After EUR dropped to 1.0611 and rebounded strongly, we indicated yesterday (20 Feb, spot at 1.0685) that that downward momentum has waned somewhat and the likelihood of a sustained decline in EUR below 1.0615 is not high. We continue to hold the same view. Overall, only a breach of 1.0740 (no change in ‘strong resistance’ level from yesterday) would indicate that the current downward pressure has eased. To put it another, a breach of 1.0740 would indicate that EUR could consolidate and range trade for a period of time.”

Asia’s Easing Economic Headwinds Make Way for Stronger Recovery

Asia’s Easing Economic Headwinds Make Way for Stronger Recovery

The economic headwinds that faced Asia and the Pacific last year have started to fade. Global financial conditions have eased, food and oil prices are down, and China’s economy is rebounding.

These developments are helping improve prospects across the region, with growth set to accelerate to 4.7 percent this year from 3.8 percent in 2022. This will make it by far the most dynamic of the world’s major regions and a bright spot in a slowing global economy.

The region’s emerging and developing economies, poised to expand by 5.3 percent this year, drive this dynamism. These economies are hitting their stride as pandemic supply-chain disruptions fade and the service sector booms. China and India alone are expected to contribute more than half of global growth this year, with the rest of Asia contributing an additional quarter. Cambodia, Indonesia, Malaysia, the Philippines, Thailand, and Vietnam are all back to their robust pre-pandemic growth.

The most significant revision since we last published forecasts in October has been to China, where a sudden re-opening has paved the way for a faster-than-expected rebound in activity. China has strong trade and tourism linkages, so this is positive news for Asia, as half of the region’s trade takes place between its economies.
Our analysis in the latest Regional Economic Outlook for Asia and the Pacific shows that, for every percentage point of higher growth in China, output in the rest of Asia rises by around 0.3 percent.

While benefiting from these developments, prospects for Asia’s advanced economies are more mixed. The near-term outlook for Japan is stronger, supported by accommodative policies, border reopening and supply chain improvements while growth would fall back in 2024 as conditions normalize and policy support eases.

The strong performance of manufacturing exports has also started to cool under the weight of slowing global trading partners. For Korea, Singapore, and Taiwan Province of China, the technology cycle—visible in the sagging price of microchips—is a drag on exports that’s likely to last through year-end. But with growth thought to be bottoming out in the rest of the world, external demand should firm heading into next year.

Easing inflation

Asia’s inflation—which rose worryingly above central bank targets last year—is poised to moderate. There are now encouraging signs that headline inflation peaked during the second half of last year, though core inflation is proving more persistent and has yet to ease definitively. We expect inflation to return to central bank targets sometime next year amid an easing of financial and commodity headwinds.

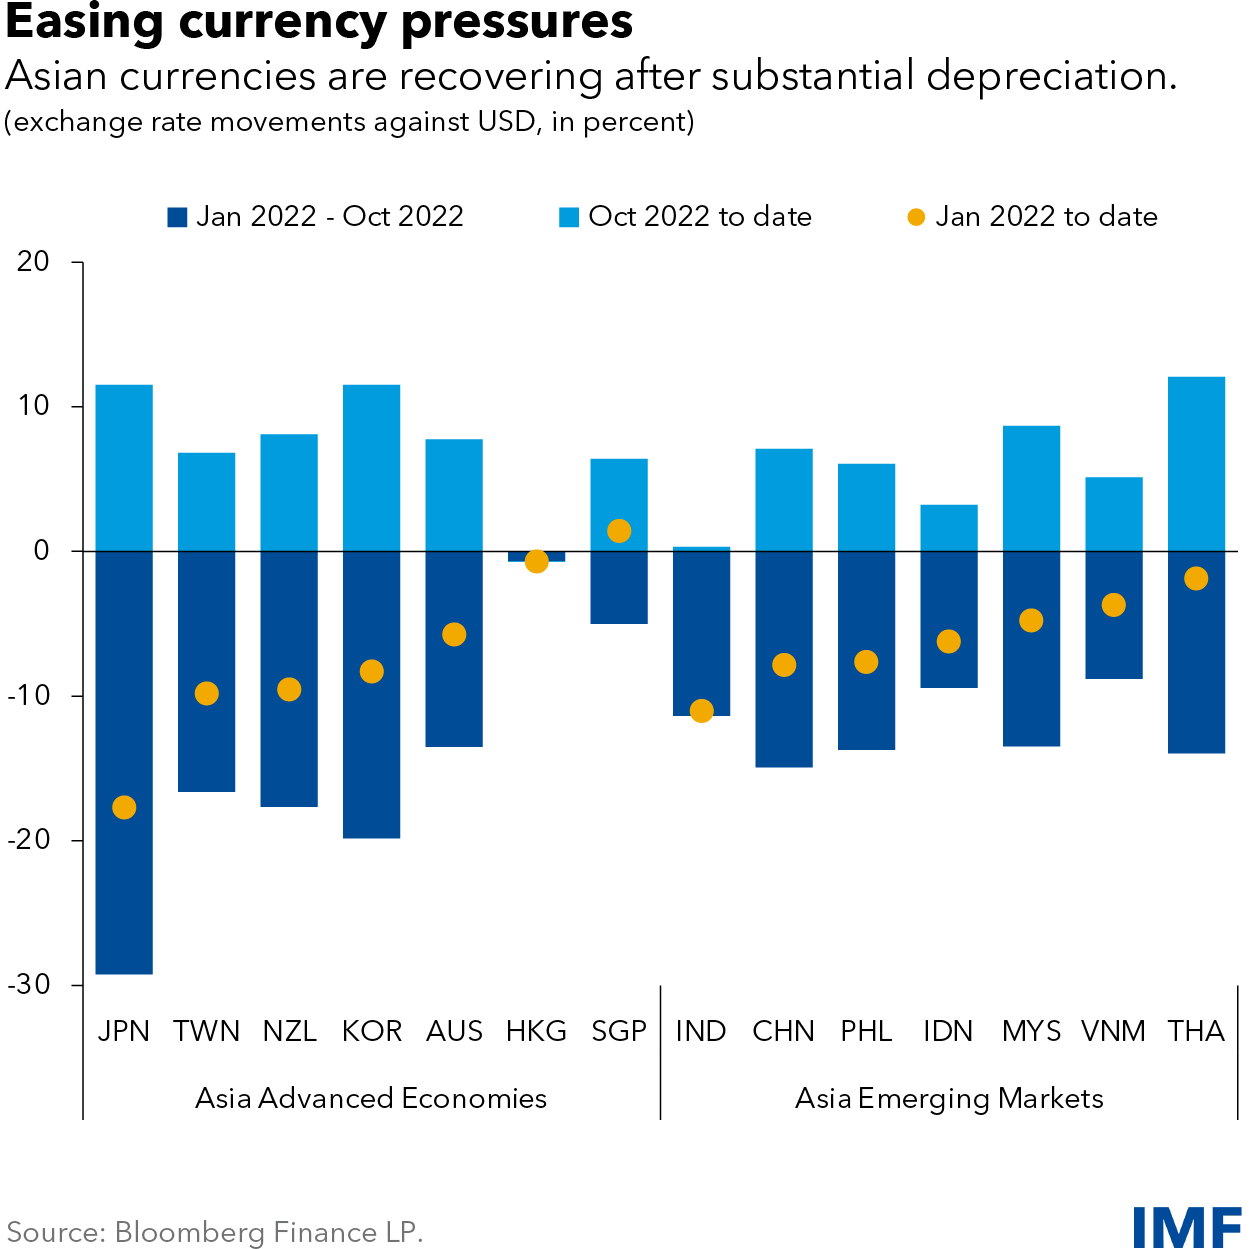
Global financial conditions have eased somewhat, and with them the US dollar has lost some strength. Central banks in Asia have been hiking interest rates as they tackle above-target inflation. These factors have helped Asian currencies rebound, with most erasing about half of last year’s losses, which has eased pressure on domestic prices.

Commodity prices soared following Russia’s invasion of Ukraine, squeezing Asia’s energy importers early last year. At the same time, soaring shipping costs raised the cost of imported goods, with particularly strong impacts on the Pacific Island Countries. But more recently, steady declines in both these factors have taken pressure off current accounts and inflation.

While inflation is moving in the right direction, central banks need to stay alert. Core inflation is still running above target. The big supply shocks and permanent structural realignments associated with the pandemic have made calibrating monetary policy particularly challenging. Signals in the data about second-round effects are mixed, further heightening uncertainty for policy makers. Given the two-sided risks to inflation in Japan, more flexibility in long-term yields would help to avoid abrupt changes later.

And finally, the renewed dynamism of the Chinese economy may put upward pressure on global commodity and service prices, particularly in countries expecting resurgent tourism. This means that central banks should tread carefully by reaffirming their commitment to price stability. Indeed, they may need to hike rates further if core inflation does not show clear signs of returning to target.

Elevated debt, financial risk

While the short-term outlook has brightened, important longer-term challenges remain.

Another important revision to the outlook for China is our downgrade of its medium-term prospects. Just like the near-term acceleration in growth in China is expected to generate positive spillovers, the slowdown in coming years will weigh on growth prospects across Asia’s highly integrated supply chains and around the world. This will make reforms to boost productivity and long-term growth more urgent across Asia.

Fiscal deficits during the pandemic and higher long-term interest rates over the past year added to public debt burdens. With several Asian countries facing debt distress, authorities must continue with their plans for gradual fiscal consolidation. Doing so will also ensure that monetary and fiscal policies are not acting at cross purposes.

Finally, many Asian countries face elevated financial vulnerabilities, with high leverage across household and corporate sectors, and significant bank exposure to real estate downturns. This suggests subtle policy trade-offs between controlling inflation and ensuring financial stability, and a need to strengthen resolution frameworks.


Recent
Asian Markets Mostly Lower Amid Worries Over Policy Tightening

Asian Markets Mostly Lower Amid Worries Over Policy Tightening

U.S. markets were closed Monday for the Presidents Day holiday.

European stocks traded mixed in closing trade after earlier gains as U.S. markets were closed for a public holiday. The Stoxx Europe 600 and the FTSE 100 rose 0.1%, the DAX traded flat and the CAC 40 fell 0.16%. “Earlier gains for European indexes have been chipped away this afternoon, as concerns about interest rates and the ongoing Ukraine conflict sapped risk appetite,” IG analyst Chris Beauchamp wrote. Previously, markets were cautiously optimistic that central banks could be nearing the end of their interest-rate rise cycles but stronger data has reversed that view, he said.

 ASIAN STOCKS

Japanese stocks were lower, dragged by falls in electronics stocks, as uncertainty persisted over policy tightening by central banks and its implications for the global economy. Investors were focusing on the yen, bond yields and any-policy related developments. USD/JPY was at 134.33, compared with 134.09 as of Monday’s Tokyo stock market close. The Nikkei Stock Average was down 0.2% at 27472.59.

South Korea’s benchmark Kospi fell 0.3% to 2447.78 in morning trade as electronics and internet stocks retreated. Preliminary trade data for the first 20 days of February show that the country is set to post another monthly trade deficit on sluggish exports of semiconductors and smartphones. Foreign and institutional investors were net sellers.

Hong Kong’s benchmark Hang Seng Index opened 0.1% lower, ahead of another busy stretch of U.S. economic data releases, which could give investors signals on the Fed’s next move. Property stocks extended Monday’s gains, leading advances on the HSI.

Chinese stocks were mixed, extending the market’s rangebound pattern in recent weeks. The benchmark Shanghai Composite Index rose 0.3% to 3301.30 and the Shenzhen Composite Index was up 0.4% at 2169.88. The ChiNext Price Index edged down 0.1% to 2478.98. Huaxi Securities analysts said the market is likely to continue consolidating and trading sideways in the near term, as investors slow buying activities after aggressively adding positions at the beginning of the year. But in the longer run, the trend of China’s macroeconomic improvement and equity-valuation rebound likely remains on track, Huaxi said. The recent downward correction could present buying opportunities, Huaxi added.

FOREX

Asian currencies consolidated against the USD in the Asian morning session, but may weaken on continued concerns over Fed tightening. These worries haven’t gone away, said Philip Wee, senior FX strategist at DBS Group Research, in an email. After the strong U.S. nonfarm payrolls and CPI readings recently, markets are bracing for another surprise in this Friday’s U.S. PCE data, Wee said. The PCE Price Index is the Fed’s preferred measure of inflation. USD/KRW was little changed at 1,296.25 while USD/SGD edged 0.1% higher to 1.3370 and AUD/USD was down 0.1% at 0.6901.

METALS

Gold edged higher in early Asian trade with focus on the FOMC minutes due later this week. The market is now pricing in a 25 basis point rate hike at each of the next three FOMC meetings, DailyFX’s senior strategist Nick Cawley said in a note. “If the FOMC minutes show that there was support for a 50bp hike at the last meeting, these market expectations may move higher still, boosting bond yields and the US dollar and weighing on the price of gold,” he added. Spot gold was 0.1% higher at $1,842.40/oz.

OIL SUMMARY

Oil prices were mixed in early Asian trade, as traders continue to weigh worries over geopolitical tensions against hopes of a reopening-driven recovery from China supporting demand. “The geopolitical backdrop is adding uncertainty,” ANZ analysts said in a note, adding that Israel’s prime minister has blamed Iran for an attack on an oil tanker in the Persian Gulf. “The U.S. is also planning new export controls and a fresh round of sanctions on Russia, targeting the defense and energy sectors,” they added. Relations between Washington and Beijing have also been increasingly tense lately after the U.S. shot down a Chinese balloon in its territory earlier this month. Front-month WTI rose 0.7% to $77.07/bbl; front-month Brent fell 0.6% to $83.26/bbl.


Australian Dollar Steadies as Trends Get Tested. Where to for AUD/USD?

Australian Dollar Steadies as Trends Get Tested. Where to for AUD/USD?

The Australian Dollar has started this week consolidating with firming PMI data and RBA meeting minutes being released today.

The Jibun Bank composite PMI came in at 49.2 for February against 48.2 prior and although it shows an improvement, it remains on the contractionary side of 50.

The RBA meeting minutes revealed most things that were already known by the market. They said, “Based on a technical assumption that the cash rate rises to 3¾ per cent over time, headline inflation was expected to decline to 4¾ per cent by the end of 2023.”

The futures market is pricing in a cash rate peak of 4.20% later this year.

There are many sunny aspects to the outlook for the Australian economy, but a potential problem could lie in the fact that CPI is outstripping both PPI and wage-price inflation.

Year-on-year CPI to the end of 2023 was 7.8% and PPI for the same period was 5.8%. Tomorrow will see the Australian Bureau of Statistics (ABS) release the Wage Price Index. A Bloomberg survey of economists is forecasting an increase of 3.5% over the year to the end of December.

While the sharpest part of the monetary policy axe is in housing mortgages, businesses also face higher funding costs when policy is being tightened.

Looking at the aforementioned inflation gauges, it could suggest that businesses are currently able to pass on increasing input costs at a faster rate than they are experiencing.

This might be a concern for the RBA when entrenched/embedded inflation expectations have been highlighted as an issue.

If consumers can bear the brunt of higher input costs and expanding profit margins for companies, it may suggest that consumer price pressures are still building.

If the first quarter CPI comes in hot, again, the RBA might have to re-assess its outlook for rates and this may have consequences for AUD/USD.

AUD/USD TECHNICAL ANALYSIS

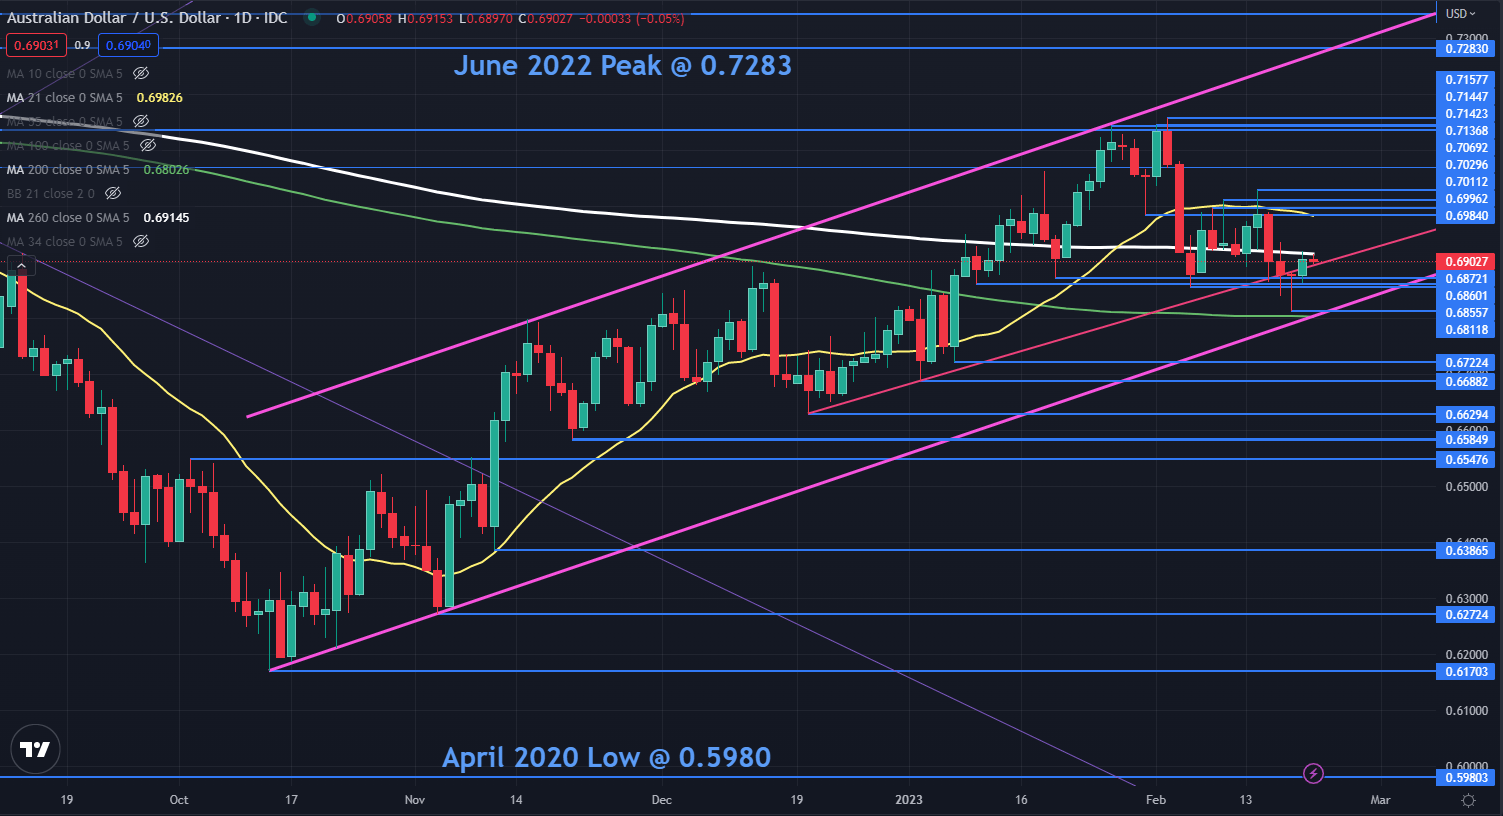
The Australian Dollar has steadied this week and it remains within an ascending trend channel.

AUD/USD had a look lower last Friday as it briefly dipped below a short-term ascending trend line It found support before a longer-term ascending trend line that forms the lower band of the ascending trend channel.

The 200-day simple moving average (SMA) currently lies near that trend line and may continue to provide support around 0.6800. The low seen last week at 0.6812 might also lend support.

A series of breakpoints and prior lows in the 0.6855 – 0.6877 area could also be a support zone.

The rally this week has struggled to overcome the 260-day SMA currently at 0.6915. A clean break above the 260-day SMA or below the 200-day SMA, might see momentum evolve in that direction.

On the topside, resistance could be offered at the breakpoints and previous peaks of 0.6984, 0.6996, 0.7011 and 0.7030. The 21-day SMA is currently near 0.6984 and may offer resistance.

The RBA meeting minutes can be read here.

AUD/USD DAILY CHART

image1.png


Japanese Yen Price Action Setups: USD/JPY, EUR/JPY, AUD/JPY, GBP/JPY

Japanese Yen Price Action Setups: USD/JPY, EUR/JPY, AUD/JPY, GBP/JPY

Short-term downward momentum in the Japanese yen remains intact ahead of Friday’s US core PCE price index data. Recent strong US data have triggered a dramatic repricing higher in Fed rate expectations and the market will be watching for cues on the US Federal Reserve’s preferred inflation gauge. Still, technical charts suggest it may be too soon to conclude if the Japanese currency has embarked on a depreciation trajectory beyond intraday timeframes, at least against the US dollar.

USD/JPY – Plenty of resistance

USD/JPY is hovering around the vital resistance area at 135.00-138.00, including the early-January high, the 200-day moving average, coinciding with the upper edge of the Ichimoku cloud on the daily charts, not too far from the December high of 138.20.As highlighted in last week’s update, the trend on intraday charts is still up and there is no sign of reversal just yet. However, the trend on the daily chart (relevant for swing/positional traders) is down and the most recent rebound is a consolidation within the broader weakness. USD/JPY would need to clear the above resistance area for the multi-week downward pressure to fade.

USD/JPY Daily Chart

image1.png

EUR/JPY – Flirting with the 200-DMA

EUR/JPY has been flirting with the 200-day moving average recently and is now at the top end of the past two months’ range. The cross faces stiff resistance at the end-December high of 143.00, the mid-2022 highs of 144.25 followed by the December high of 146.75. While the price action since mid-2022 has been quite choppy, zooming out to higher timeframes (beyond the daily timeframe), the broader trend for EUR/JPY has been up. However, given the tough barrier the cross currently faces, it is unclear if EUR/JPY is ripe to resume the broader bullish bias or continue within the range for a prolonged period.

EUR/JPY Daily Chart

image2.png

AUD/JPY – At a major intersection

AUD/JPY’s drop in December below a slightly upward-sloping trendline from August triggered a break from a bearish topping pattern. However, the cross failed to extend losses subsequently, finding support at the May low of 87.45. The price action since then has been choppy with a slight upward bias. AUD/JPY now faces a strong ceiling on the 200-day moving average, the mid-December high of 93.35, roughly coinciding with the upper edge of a rising channel from December. The cross would need to break above the converged cap to resume the uptrend from 2020.

AUD/JPY Daily Chart

image3.png

GBP/JPY – At the lower end of the well-established range

GBP/JPY has been around the lower end of the range since early 2022. In recent weeks, GBP/JPY has struggled to break past a stiff converged barrier, including the January high of 161.80, coinciding with the upper edge of the Ichimoku cloud on the daily charts, the 200-day moving average, near the November low of 163.10. The November low coincides roughly with a 50% retracement of the bearish candle created on Dec. 20, which can offer major resistance. The cross needs to clear the converged resistance of 161.50-163.50 for the multi-month range to continue.

GBP/JPY Daily Chart

image4.png

Swedish Krona Holds the High Ground as US Return from Holidays. Lower EUR/SEK?

Swedish Krona Holds the High Ground as US Return from Holidays. Lower EUR/SEK?

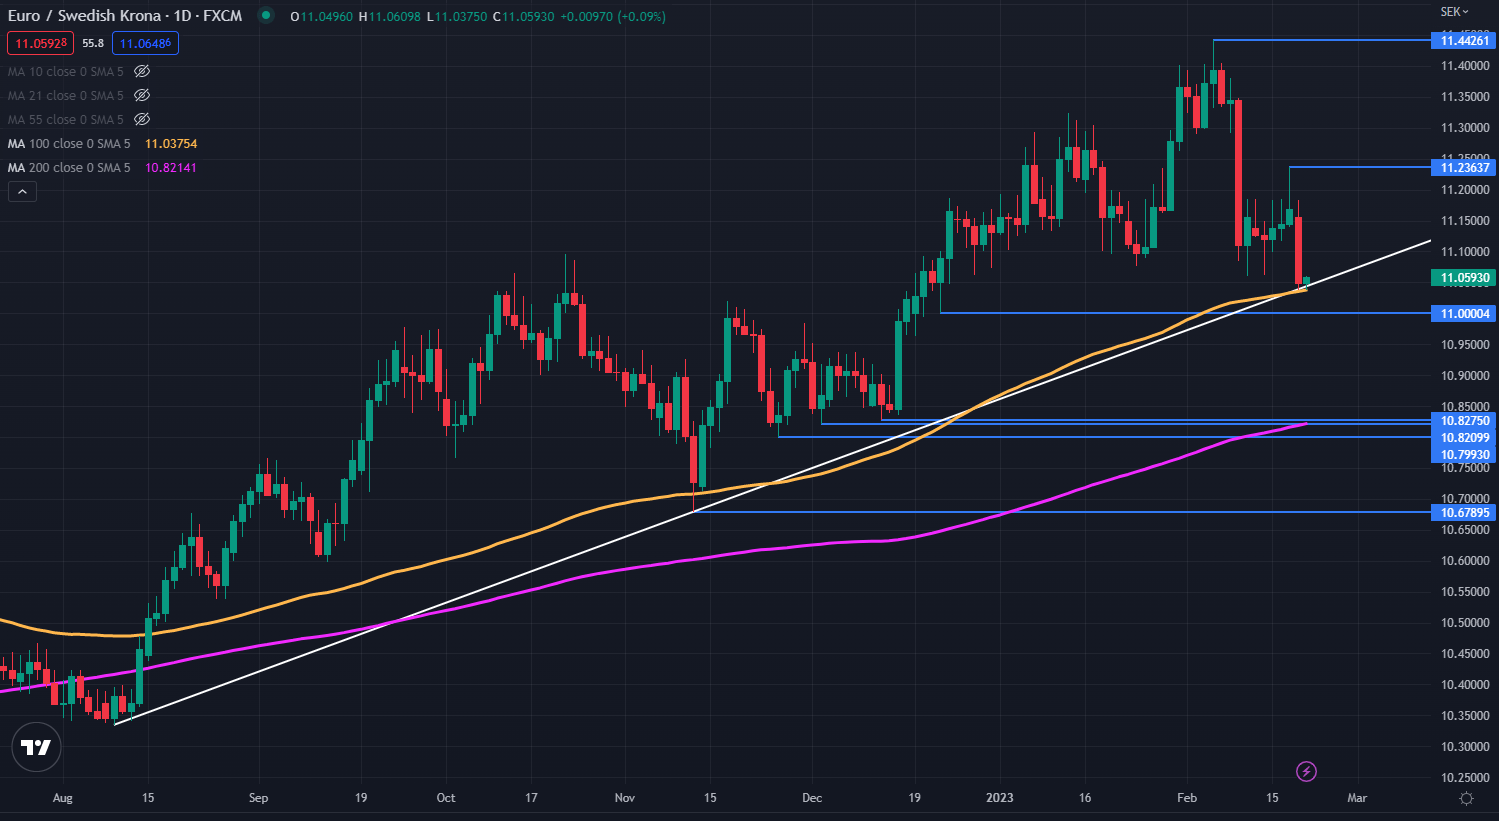
The Swedish Krona eased slightly today after having a blistering rally yesterday with EUR/SEK hitting a 2-month low.

The Riksbank monetary policy meeting minutes revealed a very hawkish tone and core CPI data was higher than anticipated for January, coming in at 0.4% m/m rather than -0.2% anticipated.

The central bank raised rates by 50 basis points at the last meeting and many economists are now taking aim at the next meeting on April 26th to be another 50 bp lift. The overnight index swap (OIS) is somewhat undecided, with around 35 bp priced in.

The move in SEK dragged the Norwegian Krone higher although to a lesser extent, with crude oil slipping before steadying in Asian trade. The WTI futures contract is near US$ 76.50 bbl while the Brent contract is a touch above US$ 83 bbl.

The US Dollar is firmer through the day so far in fairly lacklustre trade in the aftermath of the US holiday. Gold has had a small range and is sitting near US$ 1,840 an ounce.

RBA meeting minutes revealed that the board considered a 50 bp hike. Futures markets are pricing in around an 80% chance of a further 25 bp lift at the March and April meetings. AUSD/USD is slightly lower on the day, near 69 cents against the US Dollar.

APAC equities were mostly flat with Hong Kong’s Hang Seng Index (HSI) the notable exception, sliding over 1% at one stage. Futures are pointing toward a soft start for Wall Street later.

Looking ahead, European and US PMIs will be the focus alongside Canadian CPI.

Later in the week, FOMC meeting minutes will be released on Wednesday and the Fed’s preferred inflation gauge of Core PCE will be out on Thursday as well as some 4Q US GDP figures.

EURSEK TECHNICAL ANALYSIS

EUR/SEK is currently sitting on an ascending trend line and the 100-day simple moving average (SMA).

While they appear to be lending support at the moment, a clean break below them could see bearish momentum unfold.

Support might be at the prior lows of 11.0000, 108275, 10.8210 and 10.6790. On the topside, the 13-year high of 11.4426 might offer resistance.

image1.png


China central bank asks banks to slow lending in February – sources

China central bank asks banks to slow lending in February – sources

BEIJING: China’s central bank has told some banks to slow the pace of lending to contain risks after new bank loans jumped to a record in January, three bankers with knowledge of the matter said.

The People’s Bank of China (PBOC) sent the informal instructions, or the so-called window guidance, earlier this month to some lenders that asked them to issue loans “under an appropriate growth rate”, the bankers said.

The banks were told to control the scale of new loans in February to avoid issuing new loans at a too-rapid pace, the sources said.

Chinese banks are under pressure to accelerate credit support to prop up a slowing economy after harsh COVID-19 measures and a crisis in the property sector dragged China’s 2022 GDP growth down to one of its worst rates in nearly half a century.

New bank loans in China jumped more than expected to a record 4.9 trillion yuan (US$713.51 billion) in January.

However, the loan growth was mainly underpinned by state-backed infrastructure projects, while actual business demand remained weak.

“If banks are blindly pursuing the increase in the scale of loans, that may not be sustainable,” one of the bankers said.

In addition, the pressure on banks to extend more loans to boost consumption has led to the misuse of such funds. Some homebuyers, for instance, borrowed cheaper consumer loans to repay their mortgages, a practice that is banned by regulators.

China’s banking regulator on Friday imposed fines on five financial institutions over irregularities, including illegal property loans and misuse of consumer loans.

The PBOC did not immediately respond to requests for comment.

The central bank also issued guidance to headquarters of some major state-owned banks in January asking them to book some of their loans made that month to later months for accounting purposes, a fourth banker with knowledge of the matter said.

The move aimed to avoid an abrupt surge in bank lending figures, the source said.