EUR/USD Bounces Off Confluence Support as Bulls Reemerge to Assert Market Control

EUR/USD Bounces Off Confluence Support as Bulls Reemerge to Assert Market Control

EUR/USD resumed its northward path on Tuesday after losing ground in the last two regular sessions, bouncing from confluence support near the psychological 1.0900 level, where two major trendlines seem to converge, as shown on the daily chart below.

In late trading, the pair was up 0.42% to 1.0972, supported by relatively benign market sentiment and broad-based U.S. dollar weakness, with daily and weekly RSI pointing upwards in unison and prices above key moving averages, a sign of intact bullish impetus.

Looking ahead, technical signals continue to be favorable for the common currency, suggesting that the path of least resistance may be higher, especially as bulls remain determined to push for a decisive break on the upside.

If EUR/USD manages to extend its advance in the coming days, initial resistance appears at 1.1075. Bears defended this region last week and drove the exchange rate lower shortly after, so traders should be on the lookout for how prices react in case of a retest.

On a topside breakout, strong buying interest could be elicited, setting the stage for a possible move toward 1.1170, the next resistance in play. On the flip side, if sellers regain the upper hand and spark a bearish reversal, support appears at 1.0900, followed by 1.0730.

EUR/USD TECHNICAL CHART

Chart, histogram  Description automatically generated


Breaking News: UK Inflation Holds Above 10% for the 7th Consecutive Month

Breaking News: UK Inflation Holds Above 10% for the 7th Consecutive Month

GBPUSD FUNDAMENTAL BACKDROP

UK’s Chancellor Hunt: “The CPI figures reaffirm exactly why we must continue with our efforts to drive down inflation.”

The British pound is marginally weaker against the USD this morning despite UK inflation (see economic calendar below) surprised to the upside. Hawkish commentary from the Fed’s Bostic and Bullard seem to be carrying over from the US trading session but I feel as Europe comes online, the pound could claw back some lost gains.

ECONOMIC CALENDAR

image1.png

Looking at the CPI graphic, the main sector contributors to the inflation print came from food and non-alcoholic beverages and recreation and culture. Both core and headline figures surpassed estimates while PPI followed suit (albeit lower than the February print). The UK now remains the nation with the highest inflation rate in western Europe placing additional pressure on the Bank of England (BoE).

image2.png

UK INFLATION TO CEMENT ANOTHER RATE HIKE IN MAY?

Looking at money market pricing below, the BoE is expected to increase interest rates by another 25bps next month with an almost 100% probability! This week has been of particular importance for the UK economy and it’s input data beginning with yesterday’s jobs report that reiterated the tight labor market environment in the UK. If we couple these two data points, the BoE may still need to do more in terms of monetary policy tightening to quell inflationary pressures. The first signs of which have come from the UK’s Chancellor Hunt in the quote above. Later today, the BoE’s Catherine Mann is scheduled to speak and may well echo these hawkish sentiments.

BANK OF ENGLAND INTEREST RATE PROBABILTIEIS

image3.png

TECHNICAL ANALYSIS

GBP/USD DAILY CHART

image4.png

Daily GBP/USD price action remains centered around the 1.2400 psychological level as markets mull over the recent data. I expect further upside throughout the rest of the trading day as Fed speak/guidance has been losing its effectiveness of recent, leaving room for GBP strength.

Gold Prices Gain as US Dollar Falls, Keep a Close Eye on Bearish Engulfing Follow-Through

Gold Prices Gain as US Dollar Falls, Keep a Close Eye on Bearish Engulfing Follow-Through

Gold prices gained slightly over the past 24 hours after the worst 2-day loss since early February. The anti-fiat yellow metal benefited from a cautiously weaker US Dollar as traders continued to fine-tune their expectations of where the Federal Reserve might take interest rates later this year.

During Tuesday’s Wall Street trading session, Atlanta Fed President Raphael Bostic spoke and noted that he favors one rate hike before “going on hold”. He added that a recession is not in his baseline outlook and that the central bank “will do what it takes” to bring down inflation to 2%.

This commentary might have kept the US Dollar restrained and thus offered XAU/USD some lift. Focusing on Wednesday’s Asia-Pacific trading session, the economic docket is lacking notable economic event risk. That may keep traders focused on general risk appetite, which is fairly quiet for the time being.

XAU/USD Daily Chart

On the daily chart, gold continues to face the downside risk of the aftermath of a Bearish Engulfing. Downside follow-through has been lacking, with prices being supported by the 20-day Simple Moving Average. Positive RSI divergence was present before the Bearish Engulfing formed, hinting that upside momentum was fading. For the time being, watch the moving average for key support. In the event of a turn higher, the 2022 high at 2070.42 remains a key level to watch.

XAU/USD Daily Chart

Gold Sentiment Analysis – Bullish

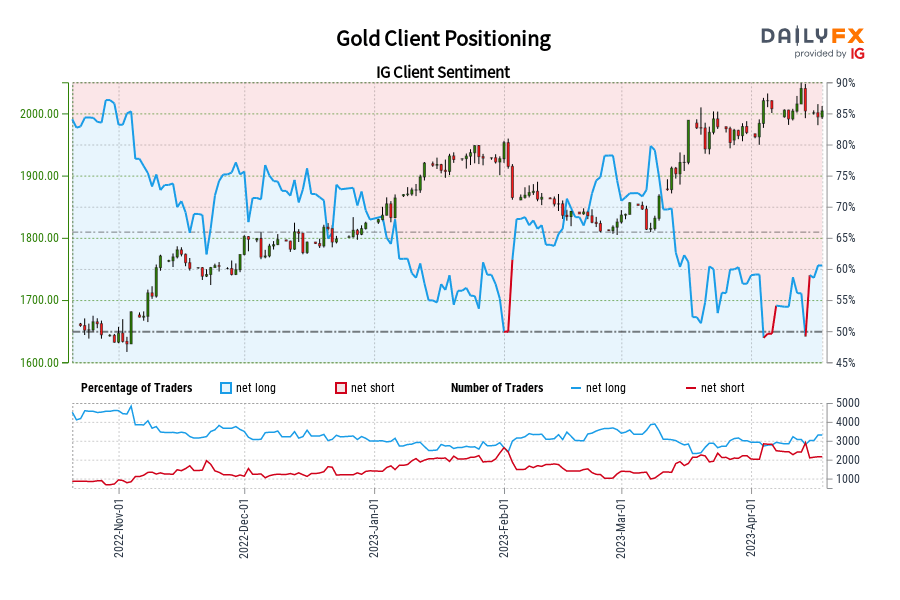
According to IG Client Sentiment (IGCS), about 58% of retail traders are net-long gold. IGCS tends to function as a contrarian indicator. Since most traders are net-long, this hints prices may fall. But, upside exposure has decreased by 5.14% and 5.45% compared to yesterday and last week, respectively. With that in mind, recent changes in exposure warn that prices may soon reverse higher once more.

Gold Sentiment Analysis - Bullish

GBP/USD climbs toward 1.2450 on hot UK CPI

GBP/USD climbs toward 1.2450 on hot UK CPI

GBP/USD has gathered bullish momentum and advanced toward 1.2450 area early Wednesday. The data from the UK revealed that the annual core CPI stayed unchanged at 6.2% in March, compared to the market expectation of 6%, and provided a boost to Pound Sterling.

GBP/USD was last seen trading in the 1.2440/50 area, where the 50 and the 20-period Simple Moving Averages (SMA) on the four-hour chart are located. Once the pair start using that area as support, it could face strong resistance at 1.2500 (lower limit of the broken ascending regression channel). With a four-hour close above this level, it could target 1.2550 (static level) next.

On the downside, 1.2400 (100-period SMA) forms first support before 1.2370 (Fibonacci 23.6% retracement of the latest uptrend) and 1.2300 (psychological level).

Following Monday’s extended downward correction, GBP/USD has gathered recovery momentum and advanced beyond 1.2400 early Tuesday. The pair’s technical outlook is yet to show a convincing bullish shift in the short term.

The data published by the UK’s Office for National Statistics revealed on Tuesday that the ILO Unemployment Rate ticked up to 3.8% in February (3 months/YoY) from 3.7%. More importantly, wage inflation, as measure by the Average Earnings Excluding Bonus, stayed unchanged at 6.6% in the same period, surpassing the market expectation of 6.2%.

On the back of strong wage inflation print, markets are pricing in 82.5% probability of one more 25 basis points (bps) Bank of England (BoE) rate increase in May, per Reuters.

On the other hand, the US Dollar has lost its strength with the US Treasury bond yields struggling to build on Monday’s gains. Moreover, the positive shift witnessed in risk mood is putting additional weight on the currency’s shoulders.

Later in the day, Building Permits and Housing Starts data for March from the US will be looked upon for fresh impetus. In case these figures fall significantly short of analysts’ estimates, the USD could continue to weaken against its rivals and vice versa. Investors, however, are unlikely to change their opinion regarding one more Federal Reserve (Fed) rate increase at the upcoming meeting based on these data.

It’s also worth noting that US stock index futures are up between 0.2% and 0.4% in the European session on the back of upbeat growth and retail sales figures from China. In case risk flows continue to drive the market action in the second half of the day, GBP/USD should be able to continue to stretch higher.

US Dollar weakens as risk flows start to drive markets

US Dollar weakens as risk flows start to drive markets

The US Dollar (USD) has lost its footing after having registered strong gains against its major rivals for two straight trading days. The upbeat macroeconomic data releases from China seem to have eased fears over a global economic slowdown. Hence, the USD is having a difficult time attractions investors as a safe haven.

The US Dollar Index, which tracks the USD performance against a basket of six major currencies, turned south and declined toward 101.50 despite having closed above 102.00 on Monday.

Technical analysis: US Dollar unable to gather further strength vs Euro

Following the two-day slide that saw the pair come within a touching distance of 1.0900, EUR/USD has regained its traction early Tuesday. The Relative Strength Index (RSI) indicator on the daily chart has returned to the 60 area, reflecting the lack of seller interest. Furthermore, the pair continues to trade within the ascending regression channel coming from late September.

EUR/USD faces immediate resistance at 1.1000 (psychological level, static level). Once the pair reaffirms that level as support, it could target 1.1100 (psychological level, static level), 1.1160 (static level from April 2022) and 1.1200 (psychological level).

On the downside, 1.0900 (20-day Simple Moving Average (SMA) stays intact as support ahead of 1.0800 (psychological level), 1.0760 (50-day SMA) and 1.0720 (100-day SMA).

US Dollar struggles to extend rebound amid improving risk mood

US Dollar struggles to extend rebound amid improving risk mood

The US Dollar (USD) has lost its footing after having registered strong gains against its major rivals for two straight trading days. The upbeat macroeconomic data releases from China seem to have eased fears over a global economic slowdown. Hence, the USD is having a difficult time attractions investors as a safe haven.

The US Dollar Index, which tracks the USD performance against a basket of six major currencies, turned south and declined toward 101.50 despite having closed above 102.00 on Monday.

Daily digest market movers: US Dollar reverses direction following Monday’s climb

  • US stock index futures trade in positive territory early Tuesday, pointing to a higher opening in Wall Street following Monday’s choppy action.
  • The data from China showed that the world’s second-largest economy expanded by an annualized rate of 4.5% in the first quarter, much stronger than the 2.9% growth recorded in the last quarter of 2022. This reading also came in better than analysts’ estimate for an expansion of 4%. Other data revealed that Industrial Production expanded by 3.9% and Retail Sales rose by 10.6% on a yearly basis, compared to analysts’ estimate of 7.4%.
  • 10-year US Treasury bond yield holds steady above 3.5% after having gained nearly 6% in the last three trading day.
  • Richmond Fed President Thomas Barkin said on Monday that he wants to see more evidence of inflation settling back to target.
  • The US Census Bureau will release Housing Starts and Building Permits data for March on Tuesday.
  • The data published by the US Census Bureau revealed on Friday that Retail Sales declined by 1% on a monthly basis in March. On a positive note, March’s reading of -0.4% got revised higher to -0.2%.
  • The University of Michigan’s (UoM) Consumer Confidence Index improved modestly to 63.5 in April’s flash estimate from 62 in March.
  • The one-year consumer inflation expectation component of the UoM’s survey climbed to 4.6% from 3.6% in March, providing a boost to the USD.
  • “Monetary policy will need to remain tight for a substantial period and longer than markets anticipate,” Federal Reserve Governor Christopher Waller said on Friday. Waller further argued that the recent data show that the Fed hasn’t made much progress on its inflation goal.
  • In an interview with Reuters on Friday, Atlanta Fed President Raphael Bostic noted that recent developments in the US economy were consistent with one more rate hike.
  • According to the CME Group’s FedWatch Tool, markets are currently pricing in a more-than-80% probability of a 25 basis points (bps) Fed rate hike in May.
  • NY Fed Empire State Manufacturing Index improved sharply to 10.8 in April from -24.6 in March, compared to the market expectation of -18.
  • On Wednesday, the Fed will release the Beige Book. Existing Home Sales and Initial Jobless Claims data will be featured in the US economic docket on Thursday ahead of S&P Global’s Manufacturing and Services PMI surveys on Friday.
  • Previewing the Fed’s publication, “since the March 21-22 meeting, the data suggest that activity is slowing, the labor market is softening, and price pressures are easing,” said analysts at BBH. “Notably, supply chains continue to improve. We believe the Beige Book will highlight these trends that support a pause after what is widely expected to be another 25 bps hike whilst leaving the door open for further tightening if needed.”

Technical analysis: US Dollar struggles to continue to outperform Euro

Following the two-day slide that saw the pair come within a touching distance of 1.0900, EUR/USD has regained its traction early Tuesday. The Relative Strength Index (RSI) indicator on the daily chart has returned to the 60 area, reflecting the lack of seller interest. Furthermore, the pair continues to trade within the ascending regression channel coming from late September.

EUR/USD faces immediate resistance at 1.1000 (psychological level, static level). Once the pair reaffirms that level as support, it could target 1.1100 (psychological level, static level), 1.1160 (static level from April 2022) and 1.1200 (psychological level).

On the downside, 1.0900 (20-day Simple Moving Average (SMA) stays intact as support ahead of 1.0800 (psychological level), 1.0760 (50-day SMA) and 1.0720 (100-day SMA).

How does Fed’s policy impact US Dollar?

The US Federal Reserve (Fed) has two mandates: maximum employment and price stability. The Fed uses interest rates as the primary tool to reach its goals but has to find the right balance. If the Fed is concerned about inflation, it tightens its policy by raising the interest rate to increase the cost of borrowing and encourage saving. In that scenario, the US Dollar (USD) is likely to gain value due to decreasing money supply. On the other hand, the Fed could decide to loosen its policy via rate cuts if it’s concerned about a rising unemployment rate due to a slowdown in economic activity. Lower interest rates are likely to lead to a growth in investment and allow companies to hire more people. In that case, the USD is expected to lose value.

The Fed also uses quantitative tightening (QT) or quantitative easing (QE) to adjust the size of its balance sheet and steer the economy in the desired direction. QE refers to the Fed buying assets, such as government bonds, in the open market to spur growth and QT is exactly the opposite. QE is widely seen as a USD-negative central bank policy action and vice versa.

German ZEW Economic Sentiment Index worsens to 4.1 in April vs. 15.1 expected

German ZEW Economic Sentiment Index worsens to 4.1 in April vs. 15.1 expected

The German ZEW headline number showed that the Economic Sentiment Index unexpectedly worsened in April, arriving at 4.1 from 13.0 in March, missing the market expectation of 15.1 by a wide margin.

Meanwhile, the Current Situation Index came in at -32.5 from -46.5, better than the market expectation of -40.0.

During the same period, the Eurozone ZEW Economic Sentiment Index worsened to 6.4 from 10.0, compared to the estimates of 19.8.

Key points

The financial market experts are still uncertain.

Experts expect banks to be more cautious in granting loans.

Still high inflation rates and the internationally restrictive monetary policy are also weighing on the economy.

On the positive side, the danger of an acute international financial market crisis seems to have been averted.

Earnings expectations for banks and insurance companies have improved compared to the previous month and are once again clearly in positive territory.

Market reaction

The EUR/USD pair has ignored the mixed data, holding the higher ground near 1.0980, up 0.47% on the day.

Gold Prices Slip as US Dollar Regains Vigor, Oil Repelled by Cluster Resistance

Gold Prices Slip as US Dollar Regains Vigor, Oil Repelled by Cluster Resistance

GOLD PRICE ANALYSIS

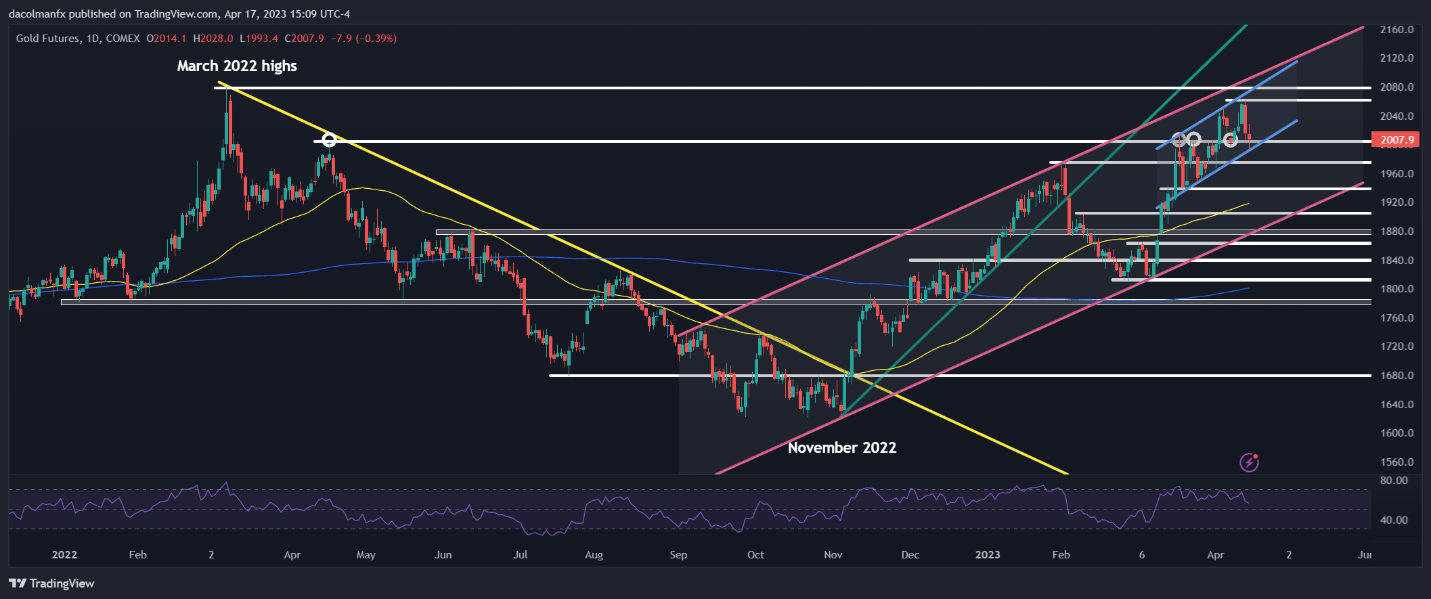
Gold prices (XAU/USD) retreated on Monday, losing ground for the second consecutive trading session and coming within a hair’s breadth of breaking below the psychological $2,000 level, undermined by the solid rally in the U.S. dollar seen in the FX space.

By way of context, the greenback managed to strengthen across the board, supported by rising U.S. Treasury yields, with the 10-year note breaking above its 200-day simple moving average and hitting 3.60%, its highest level in nearly three weeks.

Precious metals, which are priced in U.S. dollars and offer no yield, tend to weaken when the U.S. currency and rates rise, so underperformance is not surprising when these dynamics play out. In any case, gold’s bullish bias remains in place despite Monday’s small pullback.

From a price action perspective, XAU/USD has been trading within the confines of an ascending channel since the middle of last month, with bullion testing the lower limit of that pattern near $2,000 on Monday, a region that represents technical support.

If bulls manage to defend the $2000 floor and spark a rebound off of that zone, initial resistance lies at $2,060. On further strength, attention shifts to $2,075, followed by $2,095. Conversely, if selling pressure intensifies and support is breached, $1,975 is the first downside focus, followed by $1,940.

GOLD TECHNICAL CHART
Graphical user interface, chart, line chart, histogram Description automatically generated

OIL PRICE ANALYSIS

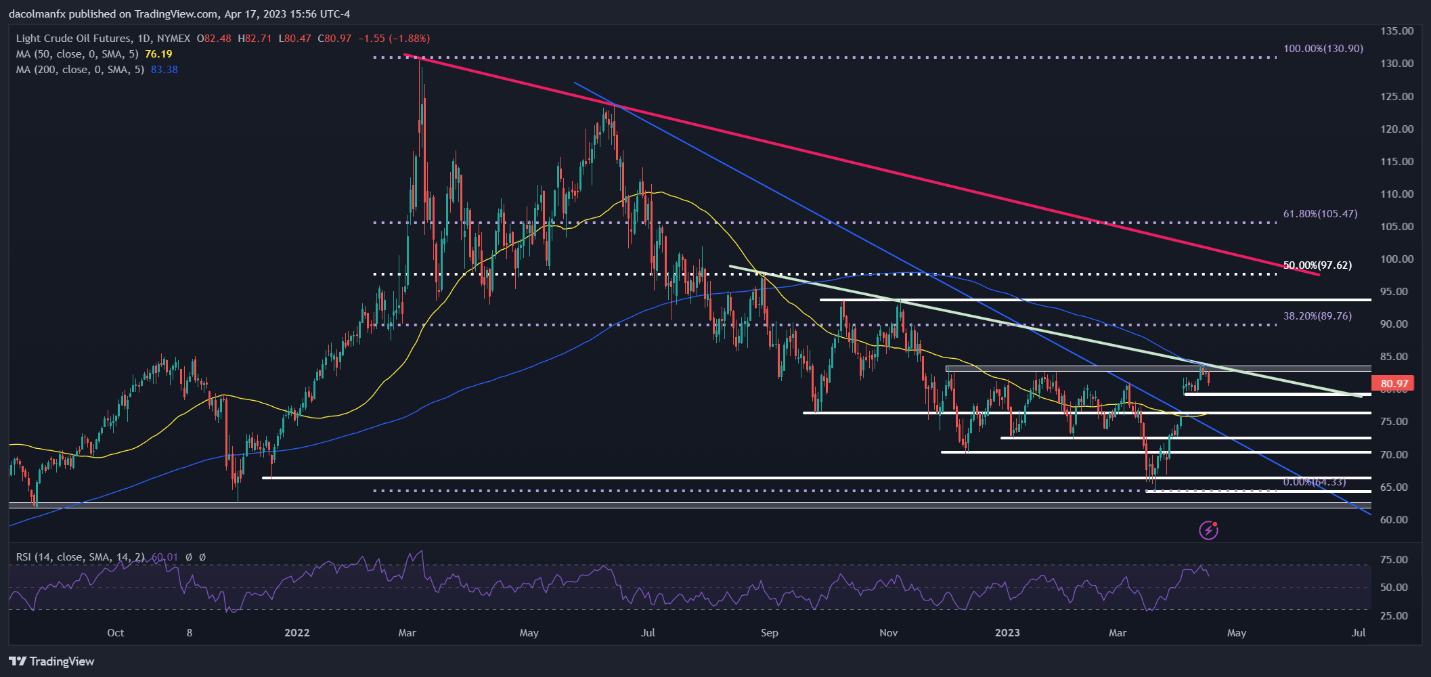
Oil prices sank on Monday, falling as much as 2% to $80.50 at some point during the trading session, hit by U.S. dollar strength and recession anxiety. While the U.S. economy has remained resilient over the past year, activity could decelerate sharply later in the year, especially if interest rates continue to rise. This scenario will dampen demand for energy commodities, weighing on fossil fuels.

In terms of technical analysis, oil has begun to reverse course after rallying more than 30% from its March lows, a sign that bullish momentum is fading. The daily chart below shows that the recent pullback has taken place after prices failed to clear cluster resistance in the $82.60/$83.40 area, where December 2022 and January 2023 highs align with the 200-day simple moving average.

If losses accelerate in the coming days, initial support rests at $79.00, followed by $76.50, just a touch above the 50-day simple moving average. On the flip side, if bulls regain the upper hand and manage to push prices above $82.60/$83.40, buying interest could regain impetus, setting the stage for a rally toward $89.76, the 38.5 Fib retracement of the March 2022/March 2023 correction.

OIL PRICE TECHNICAL CHART
Chart, histogram Description automatically generated


US Dollar Outperforms Again, but Key Resistance Holds. USD/JPY Looks More Interesting

US Dollar Outperforms Again, but Key Resistance Holds. USD/JPY Looks More Interesting

The DXY Dollar Index rose 0.51% on Monday after a solid 0.57% rally on Friday. This made the 1.08% rise over the past 2 trading days the most over 48 hours since early March. As highlighted in my weekly outlook, the USD’s performance from a technical standpoint does not seem like it was out of the blue.

Last week, the dollar fell to the critical 100.82 – 101.29 support zone that was reinforced back in February. At the same time, positive RSI divergence was showing that downside momentum was fading. This can at times precede a turn higher. Over the past 2 days, the currency was unable to clear this zone and instead, reversed higher. Could this be the starting point of an extended bullish move?

At this stage, it seems too early to tell. A Bullish Engulfing emerged at the close of last week looking at the daily chart below. Since then, there has been cautious upside follow-through. But, the near-term falling trendline from March remains in play and is holding as resistance. Confirming a breakout above that could offer an increasingly upside technical bias.

That would place the focus on the 100-day Simple Moving Average (SMA). This line held as key resistance in early March, maintaining the broader downside bias. It could very well do so again if prices continue higher in the coming days.

DXY Daily Chart – Watch the Trendline

DXY Daily Chart – Watch the Trendline

USD/JPY Daily Chart – Watch the 100-Day SMA

Focusing on USD/JPY, the US Dollar has made upside progress beyond the 100-day SMA. That has exposed the March high, which is just below 138.17. Not only that but also prices have closed at the highest in over a month. Meanwhile, a rising trendline from the beginning of this year is slowly guiding the exchange rate higher. In the event of a turn lower, this line could maintain the near-term upside bias.

USD/JPY Daily Chart – Watch the 100-Day SMA

USD/JPY Sentiment Analysis (IGCS) – Bearish

We can look at IG Client Sentiment (IGCS) to see how retail traders have been positioning themselves in USD/JPY. At the time of publishing, about 38% of them were net-long the exchange rate. IGCS typically functions as a contrarian indicator. As such, since most people are net-short, this hints prices may continue rising. But, upside exposure increased by 7.79% and 11.02% compared to yesterday and last week, respectively. As such, recent changes in exposure warn that prices may turn lower instead.

USD/JPY Sentiment Analysis (IGCS) - Bearish

US Dollar Outperforms Again, but Key Resistance Holds. USD/JPY Looks More Interesting

US Dollar Outperforms Again, but Key Resistance Holds. USD/JPY Looks More Interesting

The DXY Dollar Index rose 0.51% on Monday after a solid 0.57% rally on Friday. This made the 1.08% rise over the past 2 trading days the most over 48 hours since early March. As highlighted in my weekly outlook, the USD’s performance from a technical standpoint does not seem like it was out of the blue.

Last week, the dollar fell to the critical 100.82 – 101.29 support zone that was reinforced back in February. At the same time, positive RSI divergence was showing that downside momentum was fading. This can at times precede a turn higher. Over the past 2 days, the currency was unable to clear this zone and instead, reversed higher. Could this be the starting point of an extended bullish move?

At this stage, it seems too early to tell. A Bullish Engulfing emerged at the close of last week looking at the daily chart below. Since then, there has been cautious upside follow-through. But, the near-term falling trendline from March remains in play and is holding as resistance. Confirming a breakout above that could offer an increasingly upside technical bias.

That would place the focus on the 100-day Simple Moving Average (SMA). This line held as key resistance in early March, maintaining the broader downside bias. It could very well do so again if prices continue higher in the coming days.

DXY Daily Chart – Watch the Trendline

DXY Daily Chart – Watch the Trendline

USD/JPY Daily Chart – Watch the 100-Day SMA

Focusing on USD/JPY, the US Dollar has made upside progress beyond the 100-day SMA. That has exposed the March high, which is just below 138.17. Not only that but also prices have closed at the highest in over a month. Meanwhile, a rising trendline from the beginning of this year is slowly guiding the exchange rate higher. In the event of a turn lower, this line could maintain the near-term upside bias.

USD/JPY Daily Chart – Watch the 100-Day SMA

USD/JPY Sentiment Analysis (IGCS) – Bearish

We can look at IG Client Sentiment (IGCS) to see how retail traders have been positioning themselves in USD/JPY. At the time of publishing, about 38% of them were net-long the exchange rate. IGCS typically functions as a contrarian indicator. As such, since most people are net-short, this hints prices may continue rising. But, upside exposure increased by 7.79% and 11.02% compared to yesterday and last week, respectively. As such, recent changes in exposure warn that prices may turn lower instead.

USD/JPY Sentiment Analysis (IGCS) - Bearish