GBP/USD Price Analysis: Keeps the red around mid-1.2200s, downside remains cushioned

GBP/USD Price Analysis: Keeps the red around mid-1.2200s, downside remains cushioned

The GBP/USD pair stalls a three-day-old uptrend on Tuesday and retreats from its highest level since early February touched the previous day. The pair maintains its offered tone through the early North American session and is currently placed just below the mid-1.2200s, though lacks follow-through.

The pullback could be attributed to some repositioning trade ahead of this week’s key central bank event risks – the crucial FOMC policy decision on Wednesday, followed by the Bank of England (BoE) meeting on Thursday. In the meantime, the prospects for a less hawkish Federal Reserve (Fed), along with a strong follow-through rally in the equity markets, drag the safe-haven US Dollar (USD) to a fresh five-week low and lends support to the GBP/USD pair.

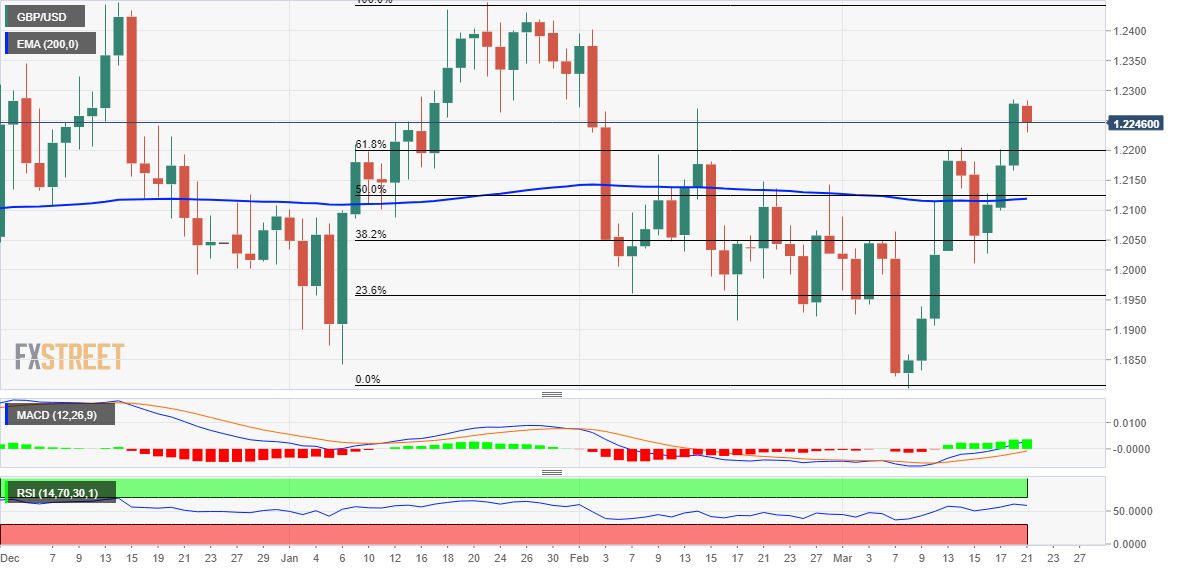
From a technical perspective, the overnight breakout through the 1.2200 mark, or the 61.8% Fibonacci retracement level of the January-March downfall was seen as a fresh trigger for bulls. Moreover, oscillators on the daily chart are holding in positive territory and are still far from being in the overbought zone. This suggests that the path of least resistance for the GBP/USD pair is to the upside and supports prospects for the emergence of some dip-buying at lower levels.

That said, it will still be prudent to wait for some follow-through buying beyond the monthly top, around the 1.2285 region set on Monday, before positioning for any further gains. The GBP/USD pair might then climb to test the next relevant hurdle near the 1.2320 region before eventually aiming to reclaim the 1.2400 round-figure mark. The momentum could get extended further towards the double-top resistance near the 1.2450 region, or the YTD peak touched in January.

On the flip side, 61.8% Fibo. level, around the 1.2200 mark, now seems to protect the immediate downside. Sustained weakness below might prompt some technical selling and drag the GBP/USD pair towards the 1.2125 confluence support. The latter comprises 50% Fibo. level and the 200-day Exponential Moving Average (SMA), which if broken decisively might shift the near-term bias back in favour of bearish traders and pave the way for deeper losses.

GBP/USD daily chart

fxsoriginal

EUR/USD continues to push higher toward 1.0800 on broad USD weakness

EUR/USD continues to push higher toward 1.0800 on broad USD weakness

EUR/USD preserves its bullish momentum and continues to push higher toward 1.0800 on Tuesday. The positive shift witnessed in risk sentiment doesn’t allow the US Dollar to find demand and helps the pair push higher. Existing Home Sales will be featured in the US economic docket.

The Relative Strength Index (RSI) indicator on the four-hour chart holds comfortably above 50, suggesting that buyers remain in control. On the upside, 1.0750 (static level) aligns as key resistance. In case the pair manages to flip that level into support, it could target 1.0770 (static level) and 1.0800 (static level, psychological level) next.

First support is located at 1.0700 (psychological level, static level, ascending trend line) before 1.0660 (200-period Simple Moving Average (SMA)) and 1.0640 (100-period SMA).

Following a consolidation phase at around 1.0700 in the Asian session, EUR/USD has regained its traction and climbed to a weekly highs above 1.0730 in the European morning. Although the positive shift witnessed in risk sentiment could help the pair keep its footing, investors could refrain from betting on a steady uptrend ahead of the US Federal Reserve’s (Fed) policy announcements.

While testifying before the European Parliament on Monday, European Central Bank (ECB) President Christine Lagarde noted that they would have indicated that further rate hikes will be needed if there were no tensions in markets. She also repeated that inflation in the Eurozone is projected to remain too high for too long. These comments failed to trigger a noticeable market reaction but allowed the Euro to stay resilient against its major rivals.

Reflecting the upbeat market mood, Euro Stoxx 50 is up more than 1.5% in the early European session. Moreover, US stock index futures are up around 0.3%.

ZEW Survey’s Economic Sentiment Index for Germany and the Eurozone will be featured in the European economic docket. The survey is forecast to reveal a deterioration in sentiment in March due to the Silicon Valley Bank and Credit Suisse turmoil. In case the decline is more severe than expected, the Euro could lose some interest with the immediate reaction.

In the second half of the day, Existing Home Sales from the US will be looked upon for fresh impetus. As mentioned above, however, markets are unlikely to take large positions before the Fed’s rate decision on Wednesday.

AUD/USD Drops as RBA Minutes Reveal Likelihood of an April Pause

AUD/USD Drops as RBA Minutes Reveal Likelihood of an April Pause

Aussie Dollar Dips on Rate Pause Discussion set for April

Markets are inherently forward-looking and so it was of little surprise to witness the AUD/USD ease off in the moments that followed the release of the Reserve Bank of Australia’s (RBA) March minutes.

The minutes revealed a step down in hawkishness as the Bank only considered a 25-basis point hike after considering 25 and 50-bps hikes in February. Admitting that the economic outlook remained uncertain, members agreed to revisit the case for a pause at the April meeting, which, if implemented, would allow more time to respond to incoming economic data.

The minutes also communicated that further tightening of monetary policy would likely be required given the high level of inflation, with labor markets still extremely tight and business surveys showing decent activity.

However, the nervousness and volatility of the last two weeks is likely to influence the Bank to err on the side of caution, where the possibility of a pause on interest rate hikes is likely to feature more prominently.

AUD/USD Technical Considerations and Levels of Interest

The AUD/USD daily chart shows a pullback after the bullish run that ensued after a solid rejection of lower prices at the April 2020 level of 0.6580. After trading above the significant longer-term 0.6680 level, the pair finds near-term resistance at the 200 day simple moving average (SMA) before the 0.6780 level. If the pullback is to extend into a larger move, a close below 0.6680 would be needed, with further support coming in at that important 0.6580.

AUD/USD Daily Chart

image1.png

The monthly chart shows how far the pair has fallen from a historical point of view and if prices are to break and hold below the dotted 0.6680 level, it would highlight the 0.64 level. With the longevity of global rate hikes now in doubt, we could start to see more muted responses stemming from hike/no hike scenarios as the attention shifts to economic activity and a possible growth/credit slow down possibly taking hold of the narrative.

AUD/USD Monthly Chart

image2.png

Major Risk Events Ahead

With the RBA minutes out the way there is very little Aussie-related data of real prominence for the rest of the week. Instead, the calendar is dominated with high importance US-related data and events like the crucial FOMC rate decision and accompanying economic projections – which may already be out of date given the rout in the global banking sector.

The Fed is believed to be considering a 25-bps hike or no hike at all. The decision comes down to whether the Fed believes that it, along with the US treasury and major players in the banking sector, have done enough to stem a widespread banking crisis. If the answer is yes, then we are likely to see a 25-basis point hike and if the committee decides to take a cautious approach, we may be looking at a pause for now. Of course, there are other possibilities but these appear as the outcomes with the greatest likelihood. US durable goods orders round up the week.

Gold Price Gallops North on Weaker US Dollar Ahead of Fed. Where to for XAU/USD?

Gold Price Gallops North on Weaker US Dollar Ahead of Fed. Where to for XAU/USD?

Gold made a one-year high just shy of US$ 2,010 an ounce overnight as markets continue to digest the impacts of the Credit Suisse – UBS deal and broader concerns for banks with weak balance sheets.

The Wall Street cash session saw large-cap banks make notable gains while First Republic Bank collapsed again. The price action could be suggestive of the market seeking quality assets amid the uncertainty of potential contagion.

Credit Suisse’s AT1 bond is trading near zero and other European bank AT1 bonds have also been hit hard, despite the terms of those notes being significantly different to the Credit Suisse bonds.

AT1 (additional tier 1) bonds do not have a maturity date (perpetual) and are subordinate to all other debt instruments but rank above equity.

With all this mayhem, the perceived haven status of the precious metal appears to have added to its lustre.

The US Dollar also collapsed to a four-week low yesterday further lifting XAU/USD. Treasury yields have steadied after the rout last week and real yields have recovered some lost ground ahead of the Federal Open Market Committee (FOMC) meeting on Wednesday.

Futures and swaps markets are leaning toward a 25 basis point lift but it is not fully priced in. The quandary for the Fed is the unknown number of other banks and corporates that could be vulnerable to the tightening monetary conditions that they have created in order to rein in sky-high inflation.

Since the collapse of SVB Financial, gold has moved higher, while the US Dollar and real yields have slipped lower. The unpredictability of the current circumstances has also seen volatility tick higher in equities and gold as represented by the VIX and GVZ indices respectively.

If these conditions continue to prevail, they might be supportive of the yellow metal and the all-time high of US$ 2,075 an ounce may come into view.

GOLD AGAINST US DOLLAR (DXY), US 10-YEAR REAL YIELDS AND VOLATILITY (GVZ)

image1.png


Crude Oil Crumbles as Markets Assess Banks Ahead of Fed. Will WTI Go Lower?

Crude Oil Crumbles as Markets Assess Banks Ahead of Fed. Will WTI Go Lower?

Crude oil remains on the back foot today after visiting lows not seen since late 2021 as markets appraise the efforts of authorities to shore up confidence in the banking sector.

The WTI futures contract is near US$ 67 bbl while the Brent contract is a touch above US$ 73 bbl.

At the same time that the Swiss National Bank orchestrated the Credit Suisse – UBS deal, US authorities are weighing up the possibility of all deposits with banks being guaranteed. Currently, the Federal Deposit Insurance Commission (FDIC) covers deposits with recognised institutions up to US$ 250,000.

While concerns continue to permeate market perceptions of balance sheet vulnerability among small and regional banks, the Federal Open Market Committee (FOMC) meeting on Wednesday moves into sharp focus.

Interest rate markets are tilting toward a 25 basis point hike but the pricing isn’t entirely complicit with around a 70% probability priced in.

Wall Street finished its cash session in the green with hopes of a less hawkish Fed providing some relief and futures are indicating a potential flat start to their trading day at the time of going to print.

APAC equities kept the buoyant mood going with all the major indices moving higher, although Japan was closed today for an equinox holiday. Treasury yields have barely moved in the Asian session with Japan away.

Currency markets have been fairly quiet so far today, with the exception of a dip in the Aussie Dollar. It softened after the Reserve Bank of Australia (RBA) meeting minutes revealed a shift toward a pause in its rate hike cycle. They have lifted rates ten times since May last year. The Kiwi also

After trading above US$ 2,000 yesterday for the first time since April last year, the gold price has steadied today at around US$ 1,980.

After Germany’s ZEW survey, Canadian CPI will be closely watched.

WTI CRUDE OIL TECHNICAL ANALYSIS

In the days prior to the collapse of SVB Financial, WTI had broken below all daily simple moving averages (SMA).

A bearish triple moving average (TMA) formation requires the price to be below the short term SMA, the latter to be below the medium term SMA and the medium term SMA to be below the long term SMA. All SMAs also need to have a negative gradient.

In the days following the SVB collapse, the criteria for a TMA were met. If these conditions prevail, bearish momentum might linger. A break above any SMA could suggest an end to this momentum.

Support may lie at the prior lows of 64.36, 62.43, 61.74 and 61.56. On the topside, nearby resistance might be at the recent peak of 69.83, just ahead of the breakpoint of 70.08.

image1.png


3 Types of Forex Analysis

3 Types of Forex Analysis

Forex analysis techniques talking points:

  • There are three general types of forex analysis traders use to anticipate market movements and analyse trends.
  • Traders tend to use one or a combination of FX analysis methods to fit their personality and/or trading style.
  • It can be useful to identify trades using the analytical approach in a forex practise account

There are several different ways to analyze the FX market in anticipation of trading. Although categories of analysis may be plentiful, traders should keep the analysis simple enough to identify good trading opportunities.

This article explores the three most common forex analysis techniques: Fundamental, technical and sentiment analysis, and how they help to shape a trading strategy. Thereafter, it is up to the individual trader to try find out what type of analysis suits there trading style.

3 types of forex analysis techniques

The 3 Most Common Types of Forex Market Analysis:

1) Fundamental

Forex fundamentals center mostly around the currency’s interest rate. This is due to the fact that interest rates have a sizeable effect on the forex market. Other fundamental factors are included such as gross domestic product, inflation, manufacturing, economic growth activity. However, whether those other fundamental releases are good or bad is of less importance than how those releases affect that country’s interest rate.

Traders reviewing the fundamental releases should keep in mind how they might affect the future movement of interest rates. When investors are in a risk-seeking mode, money follows yield (currencies that offer a higher interest rate), and higher rates could mean more investment. When investors are in a risk adverse mentality, then money leaves yield for safe-haven currencies.

The DailyFX website offers a lot of assistance on identifying how a fundamental release could affect the value of the currency. Check out the economic calendar for events coming up this week.

2) Technical

Forex technical analysis involves looking at patterns in price history to determine the higher probability time and place to enter a trade and exit a trade. As a result, technical analysis in forex is one of the most widely used types of analysis.

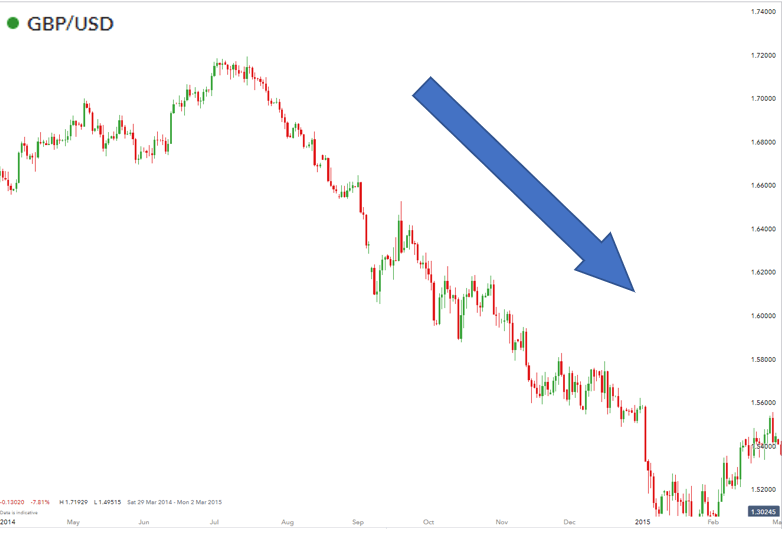
Since FX is one of the largest and most liquid markets, the movements on a chart from the price action generally gives clues about hidden levels of supply and demand. Other patterned behavior such as which currencies are trending the strongest can be obtained by reviewing the price chart. An example of this can be seen below in the GBP/USD chart where the US dollar is strengthening against the Pound Sterling.

GBPUSD chart in forex analysis techniques

Other technical studies can be conducted through the use of indicators. Many traders prefer using indicators because the signals are easy to read, and it makes forex trading simpler.

Technical versus fundamental analysis in forex is a widely debated topic. There is no right answer to the question of which type of analysis is better and traders tend to adopt one, or a combination of the two, in their analysis.

3) Sentiment

Forex sentiment is another widely popular form of analysis. When you see sentiment overwhelmingly positioned to one direction, this means the vast majority of traders are already committed to that position.

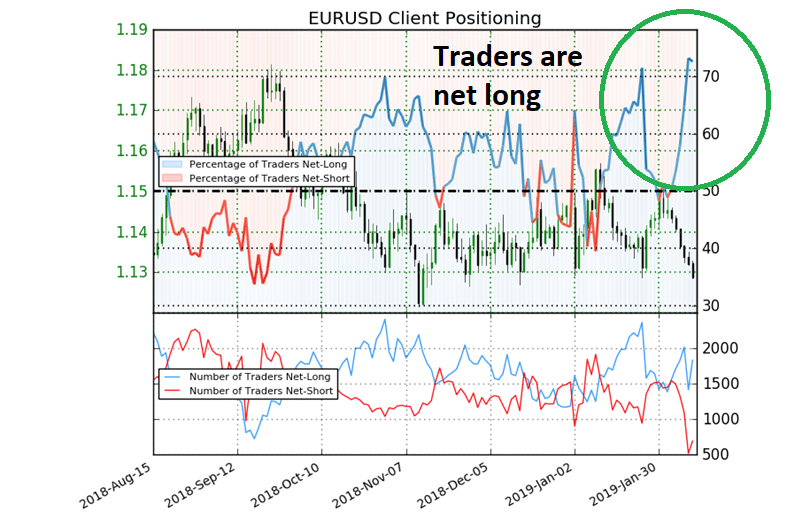
Perhaps this can be better explained with an example. Let’s assume that an overwhelming number of traders and investors are bullish the Euro. They think the Euro is going higher. Since people vote with their trades, we can assess through DailyFX (which uses IG Client Sentiment) that the EUR/USD sentiment shows a majority of traders are buyers in the currency pair.

sentiment forex analysis techniques

Since we know there is a large pool of traders who have already BOUGHT, then these buyers become a future supply of sellers. We know that because eventually, they are going to want to close out the trade. That makes the EUR to USD vulnerable to a sharp pull back if these buyers turn around and sell to close out there trades.

More astute traders will analyze retail sentiment alongside sentiment at the institutional level. Senior Analyst at DailyFX, Tyler Yell explains how traders can analyze the Commitment of Traders (CoT) report for clues on how the institutional market is positioned and how to implement this analysis into their trading analysis.

Learn more about sentiment trading through DailyFX to provide trading opportunities based on IGCS.

How to apply forex techniques to your trades

Traders can utilize a mix of all three types of forex market analysis. This can be done by:

  • Identifying long term trends with the use of fundamental analysis
  • Pin-pointing ideal entry points using technical analysis and accompanying indicators
  • Making use of client sentiment as the last check box before entering the trade.

Keep reading for in-depth examples of how to analyse forex market trends with the three analysis techniques:

1) Use fundamentals to assist in identifying a long-term trend:

Analyzing a country’s GDP, interest rate and inflation rate provides insight on the strength of that country’s economy and by extension, their currency. For example, if the US begins an interest rate hiking cycle, the US dollar will look attractive. If enough investors/traders buy US dollars this will prop up the value of the USD.

2) Apply sound technical analysis to spot entries into the market:

Using multiple time frame analysis and an indicator like the MACD or Relative Strength Index, traders can spot ideal entries into the market.

3) Consider client sentiment:

Traders can analyze client sentiment either by observing the net number of traders long or short, or by trading the difference in net short/long movements. The main takeaway however, is that retail clients tend to trade against prevailing trends therefore, making client sentiment a contrarian indicator.

GBP/USD rallies to over one-month peak, eyes mid-1.2200s amid notable USD weakness

GBP/USD rallies to over one-month peak, eyes mid-1.2200s amid notable USD weakness

The GBP/USD pair builds on last week’s rally from the vicinity of the 1.2000 psychological mark and gains positive traction for the third successive day on Monday. The momentum remains uninterrupted through the early North American session and lifts spot prices to over a one-month high, around the 1.2240 region in the last hour.

An intraday turnaround in the global risk sentiment – as depicted by a solid recovery in the US equity futures – drags the safe-haven US Dollar (USD) to its lowest level since February 14, which, in turn, acts as a tailwind for the GBP/USD pair. The USD is further pressured by diminishing odds for a more aggressive policy tightening by the Federal Reserve (Fed), especially after the recent collapse of two mid-size US banks – Silicon Valley Bank and Signature Bank.

In fact, the markets are now pricing in a smaller 25 bps lift-off at the end of a two-day FOMC monetary policy meeting, starting this Tuesday. The US central bank is also expected to start cutting interest rates during the second half of the year, which had led to the recent sharp downfall in the US Treasury bond yields. It is worth recalling that the rate-sensitive 2-year US government bond last week recorded its biggest three-day slump since Black Monday in October 1987.

That said, some repositioning trade ahead of the key central bank event risk pushes the US bond yields high, albeit does little to impress the USD bulls. This, along with the possibility of some short-term trading stops being triggered above the 1.2200 mark, further contributes to the bid tone surrounding the GBP/USD pair. It, however, remains to be seen if the intraday positive move is backed by genuine buying or turns out to be a stop run, warranting some caution for bulls.

In the absence of any major market-moving economic data on Monday, the focus will remain glued to the FOMC decision on Wednesday and the Bank of England policy meeting on Thursday. Apart from this, traders, this week will confront the release of the latest consumer inflation figures from the UK on Wednesday. The crucial macro data, along with the highly-anticipated central bank meetings, will help to determine the near-term trajectory for the GBP/USD pair.

EUR/USD Forecast: Market jitters to limit Euro’s upside

EUR/USD Forecast: Market jitters to limit Euro’s upside

EUR/USD has lost its traction and declined below 1.0700 despite having opened the week with a bullish gap. As investors try to understand whether major central banks will be able to contain the global financial crisis, risk flows struggle to gain traction.

Over the weekend, UBS Group AG has agreed to buy Credit Suisse Group AG. UBS will reportedly pay $3.23 billion for Credit Suisse and assume up to $5.4 billion in losses in a deal that is expected to close by the end of 2023. Moreover, the Federal Reserve (Fed) announced that it will restart offering daily swaps to the Bank of Canada (BoC), the Bank of Japan (BoJ), the Swiss National Bank (SNB) and the European Central Bank (ECB) to assist those banks with additional liquidity needs.

Although these developments helped the market mood improve at the beginning of the week, safe-haven flows seem to have returned in the European morning. As of writing, US stock index futures were down between 0.6% and 1.1% while the Euro Stoxx 50 Futures were down 1.2%.

Investors might be assessing the latest action taken by the major central banks as a sign that the liquidity issues could be deeper than initially thought. In fact, the benchmark 10-year US Treasury bond yield is already down 3% on the day and the CME Group FedWatch Tool shows that markets are pricing in a more than 50% probability of the Fed leaving its policy rate unchanged following its March meeting on Wednesday.

In the current market environment, dovish Fed bets are forcing the US Dollar to stay on the back foot. Nevertheless, EUR/USD could have a difficult time benefiting from the broad USD weakness in case investors continue to seek refuge.

EUR/USD Technical Analysis

With the latest pullback, the Relative Strength Index (RSI) indicator on the four-hour chart declined toward 50, pointing to a loss of bullish momentum in the near term. On the upside, 1.0670 (200-period Simple Moving Average(SMA)) aligns as initial resistance ahead of 1.0700 (psychological level, static level). If the pair rises above that latter resistance and starts using it as support, it could target 1.0750 (static level).

On the downside, first support is located at 1.0640 (static level, 50-period SMA) before 1.0620 (100-period SMA) and 1.0600 (psychological level, static level).

Annual inflation down to 8.5% in the euro area

Annual inflation down to 8.5% in the euro area

The euro area annual inflation rate was 8.5% in February 2023, down from 8.6% in January. A year earlier, the rate was 5.9%. European Union annual inflation was 9.9% in February 2023, down from 10.0% in January. A year earlier, the rate was 6.2%. These figures are published by Eurostat, the statistical office of the European Union. The lowest annual rates were registered in Luxembourg (4.8%), Belgium (5.4%) and Spain (6.0%). The highest annual rates were recorded in Hungary (25.8%), Latvia (20.1%) and Czechia (18.4%). Compared with January, annual inflation fell in fifteen Member States, remained stable in two and

Bitcoin (BTC/USD) Struggling to Break Stubborn Resistance Around $25k

Bitcoin (BTC/USD) Struggling to Break Stubborn Resistance Around $25k

Risk markets have been roiled in the past few days, first by the shuttering of two US banks, Silicon Valley Bank and Signature, and then by fears that Credit Suisse may also be wound up as its share price continues to plunge to new all-time lows. In the past, any strong risk-off move has seen Bitcoin turn lower, but not this time. The cryptocurrency space as a whole has moved higher over the last week, driven by a growing view that a failing bank system reinforces the view that a peer-to-peer digital currency is in part immune to traditional banking woes.

The current market resilience can also be traced back to the FTX/Alameda meltdown in mid-November. Bitcoin hit a low of $15,487 a couple of days later, but since then BTC has pushed further ahead and despite the late-February sell-off, it is now within a few percent of making a fresh multi-month high. It seems Bitcoin, and the cryptocurrency space as a whole is becoming increasingly resilient to both defi and tradfi shocks.

Cryptocurrency Meltdown Pauses After FTX and Alameda Implosion

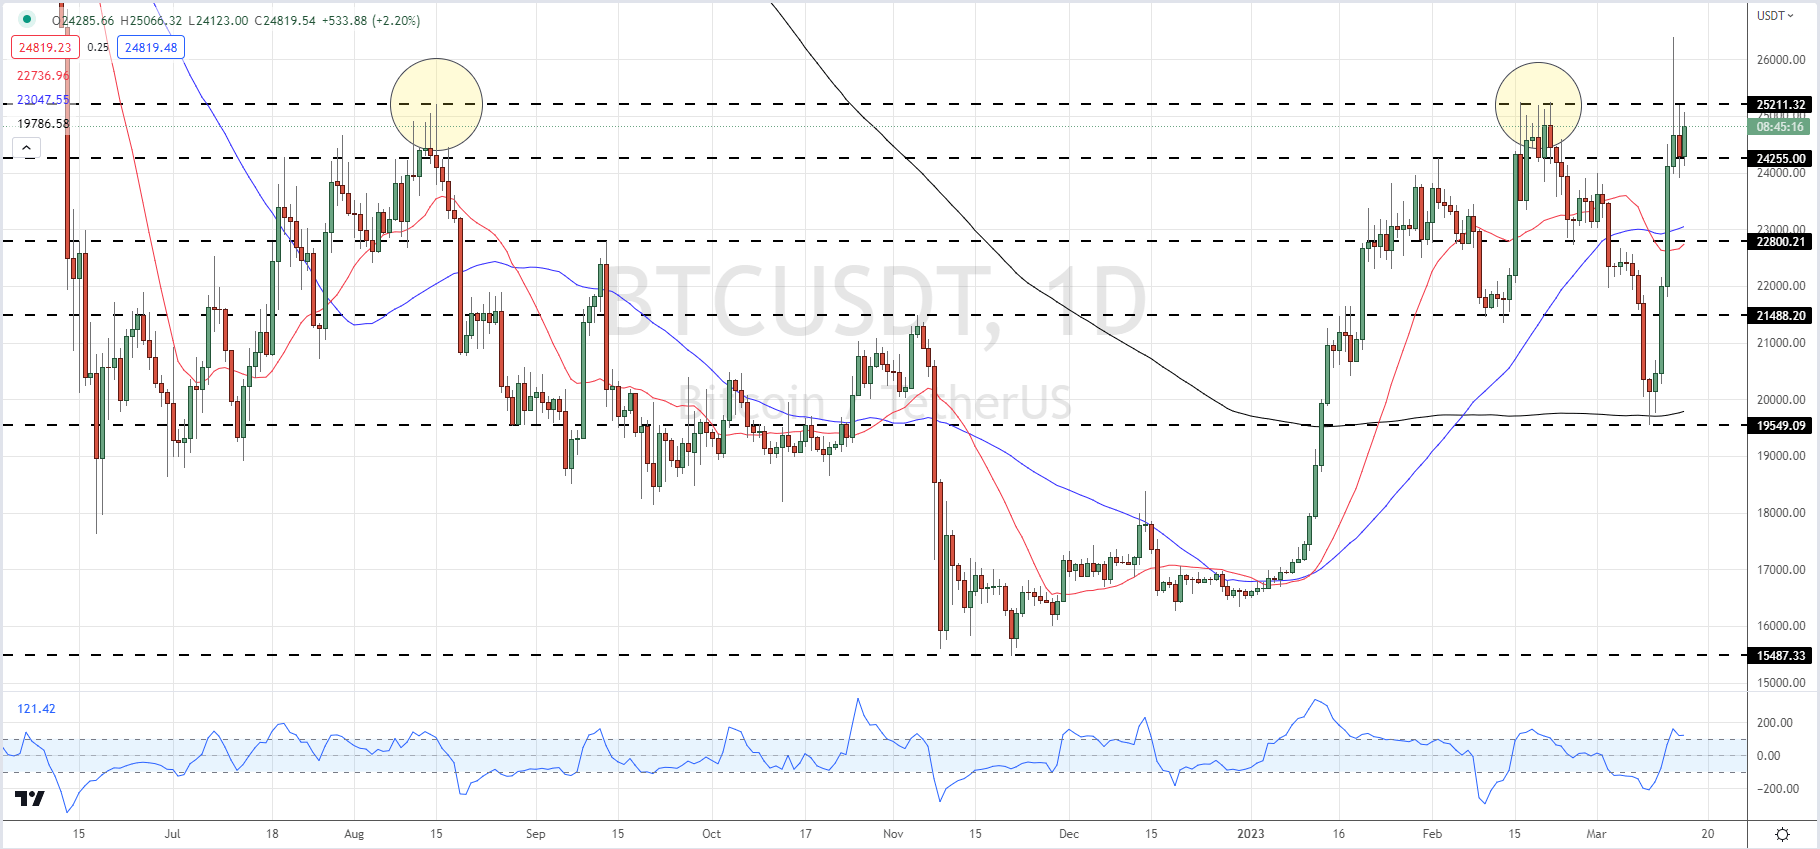
Bitcoin is now pressing against a level of resistance around $25.2k that has not been broken convincingly for months. While Tuesday’s rally took BTC to an intra-day peak of just under $26.4k, it closed around $24.6k. For BTC to make fresh gains, and the path to an eventual target of $32k looks possible, it needs to close and open above this resistance to confirm the move. All three moving averages are supportive, with the 200-dma providing strong support during last week’s sell-off, while the CCI indicator shows BTC trading in overbought territory. A few more days of consolidation and then a fresh push higher may be on the cards.

Bitcoin (BTC/USD) Daily Price Chart – March 16, 2023

image1.png