EUR/USD Forecast: Might struggle to defend 100 DMA as US debt ceiling optimism underpins USD

EUR/USD Forecast: Might struggle to defend 100 DMA as US debt ceiling optimism underpins USD

The EUR/USD pair remains depressed for the third successive day on Thursday and languishes near its lowest level since early April touched the previous day. The US Dollar (USD) stands tall near a two-month high and is seen as a key factor weighing on the major. The recent hawkish remarks by several Federal Reserve (Fed) officials pushed back against market expectations for interest rate cuts later this year. This, along with the latest optimism that the US debt ceiling will be raised, remains supportive of elevated US Treasury bond yields and continues to underpin the buck.

In fact, US President Joe Biden and top congressional Republican Kevin McCarthy underscored their determination to strike a deal soon to raise the government’s $31.4 trillion debt ceiling. This helps calm fears of an unprecedented American debt default and boosts investors’ confidence, which is evident from a generally positive tone around the equity markets. This, in turn, holds back traders from placing aggressive bullish bets around the safe-haven Greenback. Apart from this, bets for more rate hikes by the European Central Bank (ECB) could help limit losses for the EUR/USD pair.

In fact, ECB President Christine Lagarde has already made it clear that efforts to curb stubbornly high inflation aren’t over and said that there are factors that can induce significant upside risk to the inflation outlook. This reinforces the view that there are more interest rate increases still to come and warrants some caution before positioning for any further depreciating move for the EUR/USD pair. Market participants now look to the US economic docket, featuring the release of the usual Weekly Initial Jobless Claims, the Philly Fed Manufacturing Index and Existing Home Sales.

Traders will further take cues from speeches by influential FOMC members, which, along with the US bond yields, will drive the USD demand and provide some impetus to the EUR/USD pair. Apart from this, develpments surrounding the US debt-limit negotiations and the broader risk sentiment should contribute to producing short-term trading opportunities around the major.

Technical Outlook

From a technical perspective, the EUR/USD pair, so far, has managed to hold its neck above the 100-day Simple Moving Average (SMA), currently pegged around the 1.0800 round-figure mark. A sustained break below will be seen as a fresh trigger for bearish traders and pave the way for an extension of the recent pullback from a one-year peak. Spot prices might then accelerate the fall towards the 1.0755-1.0750 support before eventually dropping to the 1.0700 round figure. The downward trajectory could get extended further towards the 1.0600 mark, with some intermediate support near the 1.0640-1.0635 region.

On the flip side, any attempted recovery back above mid-1.0800s might now confront some resistance near the 1.0875-1.0880 region ahead of the 1.0900 mark. The latter coincides with the weekly high, above which a fresh bout of a short-covering has the potential to lift the EUR/USD pair towards the 1.0960 horizontal support breakpoint. Some follow-through buying will suggest that the recent downfall has run its course and shift the bias back in favour of bullish traders, paving the way for a move beyond the 1.1000 psychological mark.

fxsoriginal

USD/JPY Bulls to Target 138.5 on Debt Ceiling Progress

USD/JPY Bulls to Target 138.5 on Debt Ceiling Progress

It is a relatively busy start to the day for the USD/JPY. Japanese trade figures for April will draw interest. Following the better-than-expected Q1 GDP numbers on Wednesday, better-than-expected trade data would fuel bets on a shift in the Bank of Japan’s ultra-loose policy.

Economists forecast the trade deficit to narrow from ¥755.1 billion to ¥613.8 billion. However, the devil will be in the details. A larger-than-expected fall in imports would raise demand concerns. Economists forecast imports to fall by 0.3% and exports to rise by 3.0%.

Trading Derivatives carries a high level of risk to your capital and you should only trade with money you can afford to lose. Trading Derivatives may not be suitable for all investors, so please ensure that you fully understand the risks involved, and seek independent advice if necessary. A Product Disclosure Statement (PDS) can be obtained either from this website or on request from our offices and should be considered before entering into a transaction with us. Raw Spread accounts offer spreads from 0.0 pips with a commission charge of USD $3.50 per 100k traded. Standard account offer spreads from 1 pips with no additional commission charges. Spreads on CFD indices start at 0.4 points. The information on this site is not directed at residents in any country or jurisdiction where such distribution or use would be contrary to local law or regulation.

Beyond the economic calendar, we expect further market reaction to US debt ceiling talks.

USD/JPY Price Action

This morning, the USD/JPY was down 0.05% to 137.593. A range-bound start to the day saw the USD/JPY fall to an early low of 137.531 before rising to a high of 137.698.

USD/JPY sees early red.

Technical Indicators

Resistance & Support Levels

R1 – ¥ 138.1517 S1 – ¥ 136.7427
R2 – ¥ 138.6363 S2 – ¥ 135.8183
R3 – ¥ 140.0453 S3 – ¥ 134.4093

The USD/JPY needs to avoid the 137.227 pivot to target the First Major Resistance Level (R1) at 138.152. A move through the Wednesday high of 137.712 would signal a bullish USD/JPY session. However, the market risk sentiment must support a USD/JPY breakout.

In case of an extended rally, the bulls would likely test the Second Major Resistance Level (R2) at 138.636. The Third Major Resistance Level (R3) sits at 140.053.

A fall through the pivot would bring the First Major Support Level (S1) at 136.743 into play. However, barring a risk-off fueled sell-off, the USD/JPY pair should avoid sub-136 and the Second Major Support Level (S2) at 135.818. The Third Major Support Level (S3) sits at 134.409.

USD/JPY resistance levels in play above the pivot.
USDJPY 180523 Hourly ChartLooking at the EMAs and the 4-hourly chart, the EMAs send bullish signals. The USD/JPY sits above the 50-day EMA (135.789). The 50-day pulled further away from the 100-day EMA, with the 100-day EMA widening from the 200-day EMA, delivering bullish signals.

A USD/JPY hold above the Major Support Levels and 50-day EMA (135.789) would support a breakout from R1 (138.152) to target R2 (138.636). However, a fall through the S1 (136.743) would bring S2 (135.818) and the 50-day EMA (135.789) into view. A USD/JPY fall through the 50-day EMA would send a bearish signal.

EMAs are bullish.
USDJPY 180523 4 Hourly Chart

The US Session

Looking ahead to the US session, it is a relatively busy day on the US economic calendar. US jobless claims and the Philly Fed Manufacturing Index and sub-components will draw interest.

An unexpected slide in the Philly Fed Manufacturing Index would fuel recessionary fears. However, investors should consider the Philly Fed Prices, New Orders, and Employment sub-components.

While the economic calendar is busier, the markets should monitor FOMC commentary. Fed members Jefferson, Barr, and Logan will speak today.

Beyond the economic calendar, US debt ceiling-related news will continue to influence. Optimism toward a debt ceiling deal supported a USD/JPY breakout on Wednesday.

US dollar firms on optimism over US debt ceiling talks, Aussie down after jobs data

US dollar firms on optimism over US debt ceiling talks, Aussie down after jobs data

SINGAPORE : The U.S. dollar held near a seven-week peak on Thursday, after President Joe Biden and top U.S. congressional Republican Kevin McCarthy worked towards avoiding a damaging debt default, while the Aussie dollar slipped after disappointing jobs data.

Biden and McCarthy on Wednesday underscored their determination to strike a deal soon to raise the government’s $31.4 trillion debt ceiling, having agreed a day earlier to negotiate directly after a months-long standoff.

While the upbeat meeting helped calm fears of an unprecedented American debt default, a cautious air tempered risk-taking.

U.S. Treasury yields stayed elevated in Asia trade after rising in the previous session, as investors sold off the safe-haven bonds in the wake of the positive signs on the debt ceiling negotiations. Yields rise when bond prices fall.

The pop up in Treasury yields helped lift the U.S. dollar. Against a basket of currencies, the dollar index firmed near Wednesday’s seven-week peak and last stood at 102.92.

The euro languished near the previous session’s over six-week low and last bought $1.0833, while sterling fell 0.09 per cent to $1.2476.

“We got some positive headlines over the debt ceiling negotiations … so that obviously supported market sentiment,” said Carol Kong, a currency strategist at Commonwealth Bank of Australia (CBA). “As a result, yields have risen and equities also posted some solid gains.”

The two-year Treasury yield was last at 4.1543 per cent, having risen as much as 10 basis points in the previous session, while the benchmark 10-year Treasury yield last stood at 3.5660 per cent.

Early market action in Asia was partly led by the Aussie dollar, after data on Thursday showed that Australia’s employment unexpectedly dipped in April, following two months of outsized gains. The jobless rate also ticked up, in a sign that the red-hot labour market might be cooling.

The Aussie slipped about 0.4 per cent after the data release and was last 0.16 per cent lower at $0.66485.

“Whilst employment figures have deteriorated slightly, the (Reserve Bank of Australia) will still consider employment to be tight. And that leaves the potential for another hike or two at some point in future, unless inflation falls faster than they currently anticipate,” said Matt Simpson, senior market analyst at City Index.

Elsewhere, the dollar rose to a two-week high of 137.745 yen, extending Wednesday’s nearly 1 per cent gain against the Japanese currency.

“Dollar/yen continues to be the market’s favourite pair of risk sentiment, so on the back of some positive developments on the debt ceiling negotiations, we saw dollar/yen unwind some of the losses recently,” said CBA’s Kong.

The kiwi rose 0.18 per cent to $0.6259.

New Zealand on Thursday announced a worse-than-forecast budget deficit as a slowing economy and a lower tax take hit its coffers, leaving the Labour government walking a tightrope as its spending plan is expected to fan inflationary pressures.

In Asia, the Chinese yuan slumped to its lowest level against the dollar since December, having weakened past the key 7 per dollar level on Wednesday for the first time in five months, amid geopolitical tensions and more signs of China’s post-COVID recovery losing steam.

Wells Fargo Agrees To Pay $1 Billion To Settle Class Action In Fake Accounts Scandal

Wells Fargo Agrees To Pay $1 Billion To Settle Class Action In Fake Accounts Scandal

Wells Fargo has agreed to pay $1 billion to settle a class-action lawsuit filed by its shareholders, accusing the San Francisco-based bank of conducting unlawful practices against its customers.

The all-cash settlement, filed Monday, received preliminary approval by U.S. District Judge Gregory Woods in Manhattan federal court Tuesday, making it one of the top six largest securities class-action settlements of the past decade, the New York Post reported.

The class action was filed by shareholders in 2020, alleging the bank made “materially false and misleading statements” about its compliance with federal regulators’ orders in 2018, according to The Hill.

In the lawsuit, filed on behalf of several public employees from Mississippi and Rhode Island, Wells Fargo was accused of conducting illegal business practices between 2002 and 2016, including opening millions of accounts without the consent and knowledge of customers, imposing unreasonable overdraft fees on accounts, and unlawfully freezing accounts.

U.S. regulators sanctioned Wells Fargo on multiple occasions over violations of consumer protection laws dating back to 2016, when it was found that millions of accounts were opened illegally by the bank’s employees to meet their sales goals.

In the aftermath of the accusations, the financial institution removed its top executives, and vowed to correct the internal deficiencies that resulted in the unfair treatment of customers.

“This agreement resolves a consolidated securities class action lawsuit involving the company and several former executives and a director, who have not been with the company for several years,” Wells Fargo spokeswoman Laurie Kight said in a statement. “While we disagree with the allegations in this case, we are pleased to have resolved this matter.”

Advocates representing the investors in the suit asserted that if approved, the settlement will help compensate thousands of investors, including state employees, nurses, teachers, police and firefighters among others “whose critical retirement savings were impacted by Wells Fargo’s fraudulent business practices.”

“Wells Fargo betrayed the trust of Rhode Island pensioners and now is rightly facing consequences because of that. I am proud that ERSRI (Employees’ Retirement System of Rhode Island) stood up for its stakeholders and held Wells Fargo accountable for its misconduct, and for achieving the historic settlement,” said Rhode Island general treasurer James A. Diossa on behalf of co-lead plaintiff ERSRI.

Lawyers and plaintiffs are likely to see at least 19% of the settlement amount as their legal fees.

The latest settlement amount adds to a string of fines and setbacks confronted by Wells Fargo amid its efforts to restore its image from a slew of scandals.

In December last year, Wells Fargo was fined a record $1.7 billion by federal regulators for years of “widespread mismanagement” that put more than 16 million consumer accounts at risk. Under the order of the Consumer Financial Protection Bureau (CFPB), the banking giant also agreed to pay $2 billion to settle a slew of charges filed against it for reportedly harming consumers by charging illegal fees and interest on auto loans and mortgages. It was reported to be the largest penalty by the watchdog against any bank to date.

“Wells Fargo’s rinse-repeat cycle of violating the law has harmed millions of American families,” CFPB director Rohit Chopra had said at the time.

This lawsuit focused on the bank’s misconduct against its customers between 2018 and 2020 after regulators recognized many concerning ill practices.

US Federal Debt to GDP – When Did It Jump? Where Is It Going Now?

US Federal Debt to GDP – When Did It Jump? Where Is It Going Now?

Federal Debt to GDP – When Did It Jump? Where Is It Going Now?

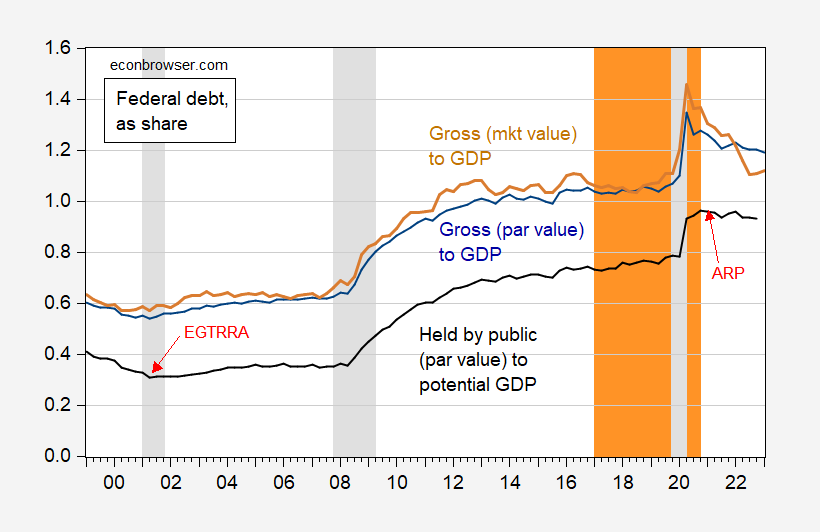
Regardless of gross or net, at par or market value, as a ratio to GDP or potential GDP, the answer is pretty obvious.


Figure 1: Gross Federal debt at par value as ratio of GDP (blue), at market value as ratio to GDP (tan), Federal debt held by public at par value as ratio to CBO potential GDP (black). NBER defined peak-to-trough recession dates shaded gray. Trump administration shaded orange. Source: Treasury via FRED, Dallas Fed, CBO (February 2023), NBER, and author’s calculations. 

Publicly held debt as a share of potential GDP rose by 15 percentage points going from 2020Q1 to 2020Q2. The 25 ppts increase using actual GDP is in some sense misleading because it’s largely by the sharp drop in output in Q2.

The market value of debt has dropped substantially more than the par value, and in some ways the market value is more representative of the burden posed by the outstanding stock of debt (see discussion here).

None of this should detract from the argument that the path of debt is not sustainable. I would say that it is impossible, given the consensus to maintain defense and Social Security, to meaningfully address this problem without raising additional revenue. (Productivity and output enhancing measures, like increased immigration, wouldn’t hurt either.)

Pound To Australian Dollar Rate Rangebound Amid Downbeat UK Economic View

Pound To Australian Dollar Rate Rangebound Amid Downbeat UK Economic View

The Pound Australian Dollar (GBP/AUD) exchange rate fluctuated as Bank of England (BoE) Governor Andrew Bailey appeared cautious in his speech, highlighting persistent inflationary pressures and concerns over economic growth.

At time of writing GBP/AUD traded around $1.2466, moderately unchanged from the morning’s opening levels.

Pound (GBP) Exchange Rates Undermined by Dovish BoE

The Pound (GBP) struggled to find much demand in the Wednesday session as a speech from BoE Governor Andrew Bailey failed to inspire much confidence in GBP investors.

Speaking at the annual conference for the British Chambers of Commerce, Bailey spoke about the persistent inflationary pressures weighing on the UK economy and warned of the potential delayed impact of high interest rates to the economy. Bailey also admitted that the UK’s labour market is finally showing substantial signs of cooling.

In the wake of less-than-stellar employment data on Tuesday, hints of a pause from the BoE are weighing on the Pound. Bailey added:

‘We have good reasons to expect inflation to fall sharply over the coming months, beginning with the April number. As headline inflation falls, second-round effects are unlikely to go away as quickly as they appeared.‘The easing of labour market tightness is happening at a slower pace than we expected in February and the labour market remains very tight.’

Despite this, Bailey also pointed out that inflation remains far too high, over five times the target rate of 2%. Ending his speech, Bailey reiterated the central bank’s commitment to rein in inflation, saying:

‘Inflation is much too high, and we need to bring it back sustainably to our 2% target.‘After the initial recovery in 2020, the level of economic activity, measured by monthly GDP, has failed to grow beyond its pre-pandemic level on a sustained basis.’

Australian Dollar (AUD) Exchange Rates Supported by Cautious Market Optimism

Meanwhile the Australian Dollar (AUD) shrugged off worrisome labour market data and found some modest support with optimism surrounding the US debt ceiling debate. Negotiations between President Joe Biden and House of Representatives Speaker Kevin McCarthy appeared to have edged closer to completion.

McCarthy left the meeting late Tuesday and told reporters that a solution is close, and one could be reached by the end of the week but there is still work to do. With mounting fears that if the US was to default on their debts, a financial catastrophe could sweep through the economy. Treasury Secretary Janet Yellen said on Tuesday that the danger was real:

‘It is very conceivable that we’d see a number of financial markets break – with worldwide panic triggering margin calls, runs and fire sales.’

However, with an amicable solution nearing, the global markets could sigh a breath of relief, buoying the risk-sensitive ‘Aussie’.

GBP/AUD Exchange Rate Forecast: Market Sentiment to Buoy the Aussie?

Looking ahead, the Pound Australian Dollar exchange rate could be left to market sentiment amid a lack of economic data to end the week. Without data for either pairing, the wider market mood will be play a bigger part in movements.

Reduced rate hike bets for the Pound could sap demand as investors continue to digest the speech from Bailey, as well as the wavering state of the UK economy.

EUR/USD retreats towards 1.0800 amid cautious optimism

EUR/USD retreats towards 1.0800 amid cautious optimism

EUR/USD is trading on the back, heading toward 1.0800 in the European session. The US Dollar is holding previous gains amid a cautiously optimistic market mood. Investors weigh US debt ceiling developments ahead of US data.

The EUR/USD pair remains depressed for the third successive day on Thursday and languishes near its lowest level since early April touched the previous day. The US Dollar (USD) stands tall near a two-month high and is seen as a key factor weighing on the major. The recent hawkish remarks by several Federal Reserve (Fed) officials pushed back against market expectations for interest rate cuts later this year. This, along with the latest optimism that the US debt ceiling will be raised, remains supportive of elevated US Treasury bond yields and continues to underpin the buck.

In fact, US President Joe Biden and top congressional Republican Kevin McCarthy underscored their determination to strike a deal soon to raise the government’s $31.4 trillion debt ceiling. This helps calm fears of an unprecedented American debt default and boosts investors’ confidence, which is evident from a generally positive tone around the equity markets. This, in turn, holds back traders from placing aggressive bullish bets around the safe-haven Greenback. Apart from this, bets for more rate hikes by the European Central Bank (ECB) could help limit losses for the EUR/USD pair.

In fact, ECB President Christine Lagarde has already made it clear that efforts to curb stubbornly high inflation aren’t over and said that there are factors that can induce significant upside risk to the inflation outlook. This reinforces the view that there are more interest rate increases still to come and warrants some caution before positioning for any further depreciating move for the EUR/USD pair. Market participants now look to the US economic docket, featuring the release of the usual Weekly Initial Jobless Claims, the Philly Fed Manufacturing Index and the Philly Fed Manufacturing Index.

Traders will further take cues from speeches by influential FOMC members, which, along with the US bond yields, will drive the USD demand and provide some impetus to the EUR/USD pair. Apart from this, developments surrounding the US debt-limit negotiations and the broader risk sentiment should contribute to producing short-term trading opportunities around the major.

From a technical perspective, the EUR/USD pair, so far, has managed to hold its neck above the 100-day Simple Moving Average (SMA), currently pegged around the 1.0800 round-figure mark. A sustained break below will be seen as a fresh trigger for bearish traders and pave the way for an extension of the recent pullback from a one-year peak. Spot prices might then accelerate the fall towards the 1.0755-1.0750 support before eventually dropping to the 1.0700 round figure. The downward trajectory could get extended further towards the 1.0600 mark, with some intermediate support near the 1.0640-1.0635 region.

On the flip side, any attempted recovery back above mid-1.0800s might now confront some resistance near the 1.0875-1.0880 region ahead of the 1.0900 mark. The latter coincides with the weekly high, above which a fresh bout of a short-covering has the potential to lift the EUR/USD pair towards the 1.0960 horizontal support breakpoint. Some follow-through buying will suggest that the recent downfall has run its course and shift the bias back in favour of bullish traders, paving the way for a move beyond the 1.1000

Gold Prices Fall Amidst US Debt Ceiling Deal Bets, Technical Setup Shaky

Gold Prices Fall Amidst US Debt Ceiling Deal Bets, Technical Setup Shaky

Gold prices weakened on Thursday, extending a recent string of losses for the yellow metal. This week is shaping up to be a 1.45% decline for XAU/USD. If confirmed, this would be the worst 5-day period since the end of February. Let us take a closer look at what is going on and what we could expect going forward.

Gold is an anti-fiat trading unit. Its top has been associated almost perfectly with a bottom in the 2-year Treasury yield. The latter has rallied almost 10% since finding support earlier this month. Meanwhile, the US Dollar has also been rallying for the past few weeks.

Long story short, recent economic updates from the US have been pouring cold water on near-term Fed rate cut bets. Over the past 24 hours, financial markets seemed to enjoy prospects that a breakthrough could be in store for a bipartisan maneuver in Washington to raise the US debt ceiling, avoiding default.

With that in mind, if the rosy sentiment persists for financial markets, gold could be left vulnerable over the remaining 24 hours. All eyes will then turn to Thursday’s US initial jobless claims report. This is some of the timeliest data there is on the status of the US labor market amidst rising interest rates.

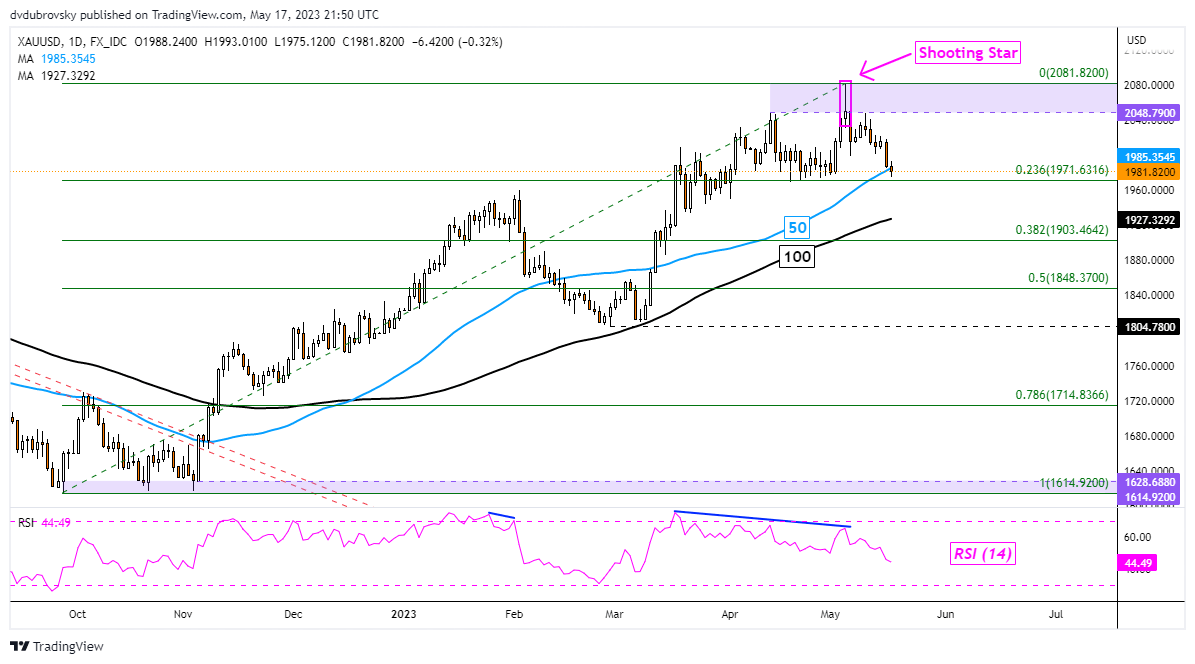
XAU/USD Daily Chart

Gold continues to make downside progress in the aftermath of a Shooting Star candlestick chart pattern. The anti-fiat yellow metal has just barely closed under the 50-day Simple Moving Average (SMA). Further downside confirmation could spell trouble, exposing the 100-day equivalent.

XAU/USD Daily Chart

Gold Sentiment Analysis – Bearish

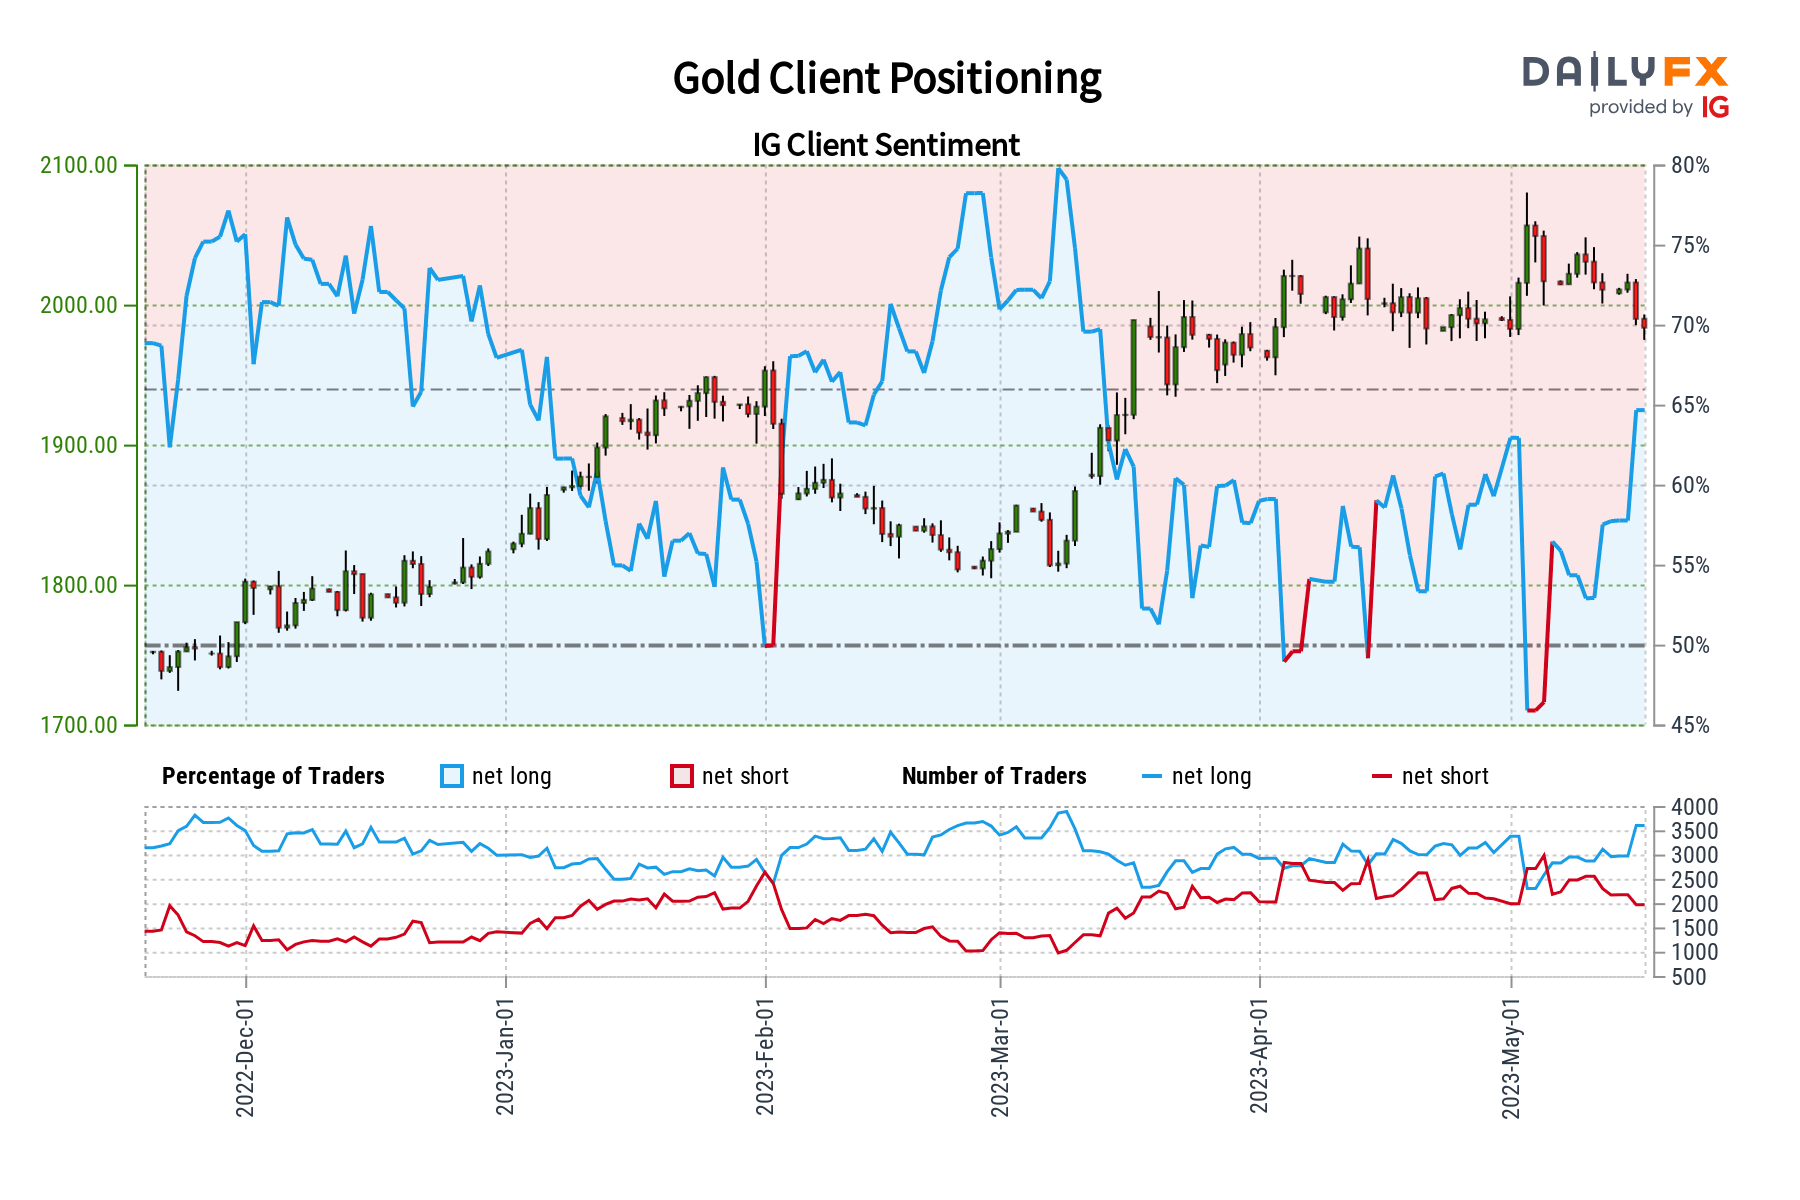
According to IG Client Sentiment (IGCS), about 64% of retail traders are net-long gold. IGCS tends to function as a contrarian indicator. With that in mind, since most traders are net-long this hints prices may continue falling. This is as upside exposure increased by 10.93% and 23.31% compared to yesterday and last week, respectively. With that in mind, recent changes in exposure offer a stronger bearish contrarian trading bias.

Gold Sentiment Analysis - Bearish

Australian Dollar Drops on Jobs Data That May Assist the RBA. Where to for AUD/USD?

Australian Dollar Drops on Jobs Data That May Assist the RBA. Where to for AUD/USD?

The Australian Dollar dipped after a soft jobs report that saw a bump up in the unemployment rate that could help to alleviate price pressures which might see the RBA refrain from hiking in June.

The unemployment rate was 3.7% in April against the 3.5% anticipated and prior. -4.3k Australian jobs were lost in the month, which was notably below the 25k anticipated to be added and 53.0k previously. Of note was the full-time job losses of -27.1k.

The interest rate market is now pricing in a less than 50-50 chance of a lift in the cash rate by the RBA in the third quarter.

An increase in the unemployment rate would not normally be a cause for celebration but in the current environment of red-hot CPI at 7.0%, it has provided a sigh of relief in some quarters.

Yesterday saw the wage price index rise by 0.84% quarter-on-quarter for the first 3 months of this year against 0.85% prior. This gives a year-on-year figure of a 3.7% increase.

Across the public and private sectors, negotiations are currently underway for wage increases to keep up with inflation. The Australian economy is seeing a price-wage inflation spiral rather than a wage-price spiral which was the case in the 1970s and 80s.

If salaries are to increase in line with CPI, then inflation might be seen as being entrenched and/or embedded. That is not what central bankers like to see.

If price expectations are such that consumers expect items to be more expensive in the future, then generally speaking, they are prepared to pay more for them today. Monetary policy plays a significant role in hosing down these perceptions.

So, while today’s jobs report might give the impression of an easing of the tight labour market, the RBA still has its work cut out. At their last meeting, they cited the risk of CPI reaccelerating to keep the gauge out of the 2-3% mandated target band.

AUD/USD dipped to 0.6630 immediately after the data but recovered some ground in the aftermath. The overnight low was 0.6629.

The ASX 200 saw similar price action and remains in the green on the day at the time of going to print.

AUD/USD PRICE REACTION TO JOBS DATA

image1.png