Gold Ahead of US CPI: Make or Break Moment?

Gold Ahead of US CPI: Make or Break Moment?

Gold remains lofty as US debt ceiling talks continue ahead of key US inflation data later Wednesday. With no sign of reversal of the uptrend on technical charts, the balance of risks is tilted toward the upside. However, if price pressures rise at a faster clip, the focus could shift to key support levels given the dismal momentum on higher timeframe charts.

Core inflation measures, including CPI, PCE, and PPI, suggest inflationary pressures are moderating, but still well above the US Federal Reserve’s 2% target. In this regard, US CPI index data due later today will shed some more light – the core CPI is expected to have eased to 5.5% on-year in April from 5.6% in March. Headline CPI is expected to remain steady at 5% on-year.

US Consumer Price Index
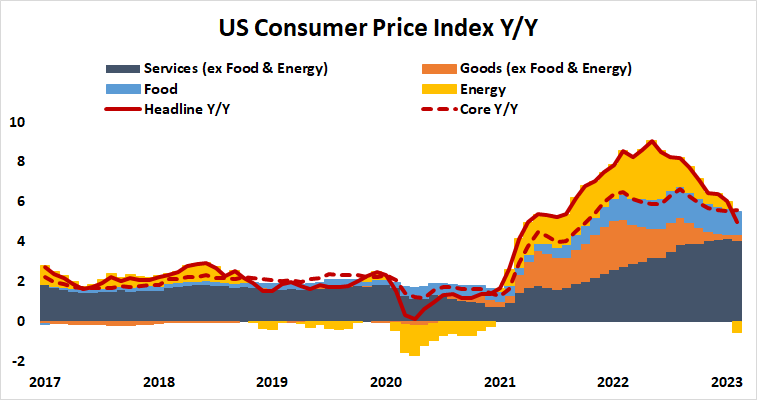
image1.png

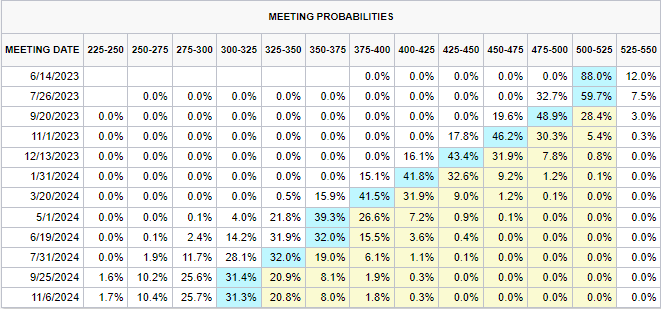
The Fed last week raised interest rates by 25 bps as expected but indicated a pause in the hiking cycle. Markets are currently pricing in 75 basis points of rate cuts by the end of the year, according to CME’s FedWatch tool. If the CPI data suggest price pressures rose faster than expected last month, it could lead to a reassessment of Fed rate cut expectations, especially after Friday’s stronger-than-expected US jobs data.

XAU/USD Daily Chart
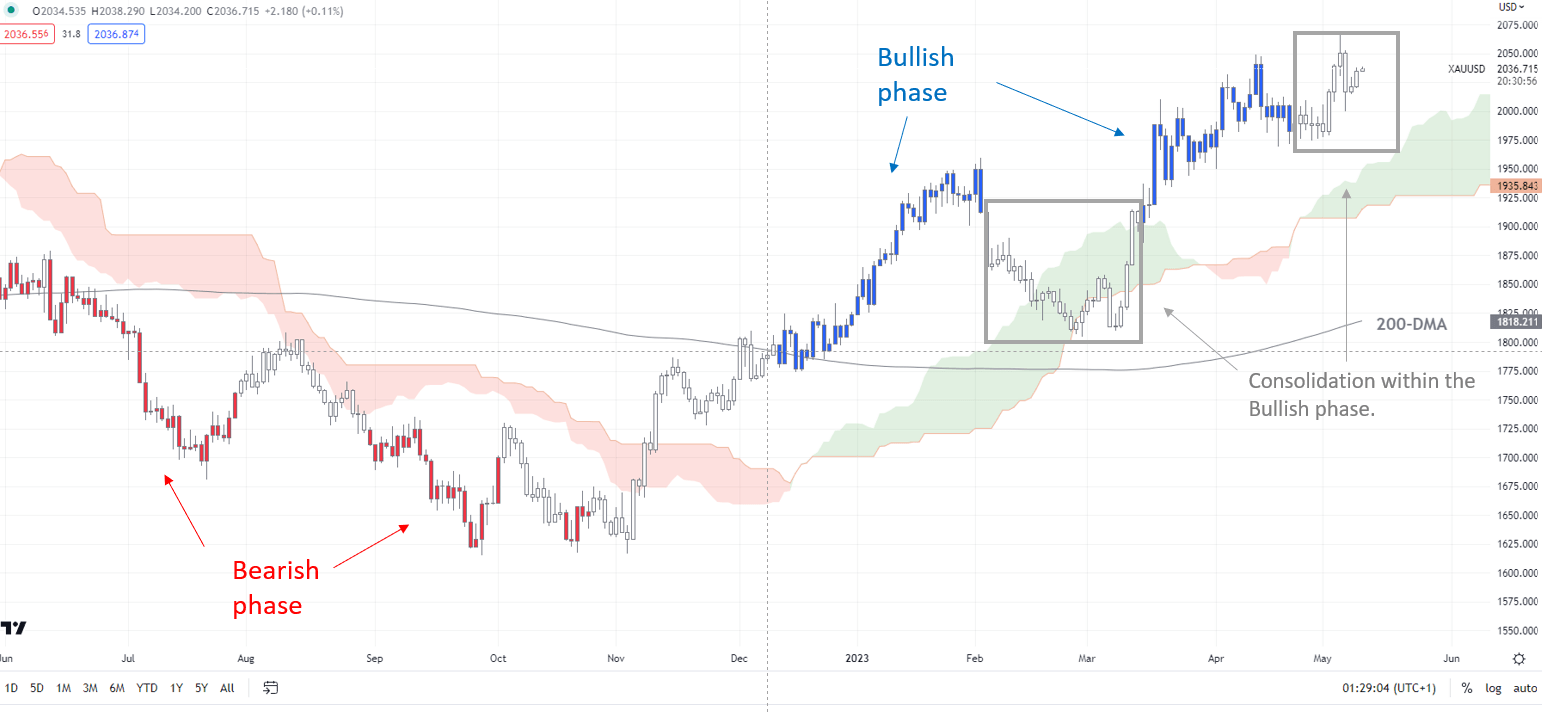
image2.png

Note: In the above colour-coded chart, Blue candles represent a Bullish phase. Red candles represent a Bearish phase. Grey candles serve as Consolidation phases (within a Bullish or a Bearish phase), but sometimes they tend to form at the end of a trend. Note: Candle colors are not predictive – they merely state what the current trend is. Indeed, the candle color can change in the next bar. False patterns can occur around the 200-period moving average, or around a support/resistance and/or in sideways/choppy market. The author does not guarantee the accuracy of the information. Past performance is not indicative of future performance. Users of the information do so at their own risk.

Any uptick in price pressures could boost US Treasury yields and the US dollar and weigh on gold. In contrast, further moderation in price pressures could weigh on yields and the US dollar, pushing gold toward the 2020 record high of 2072.

XAU/USD Weekly Chart
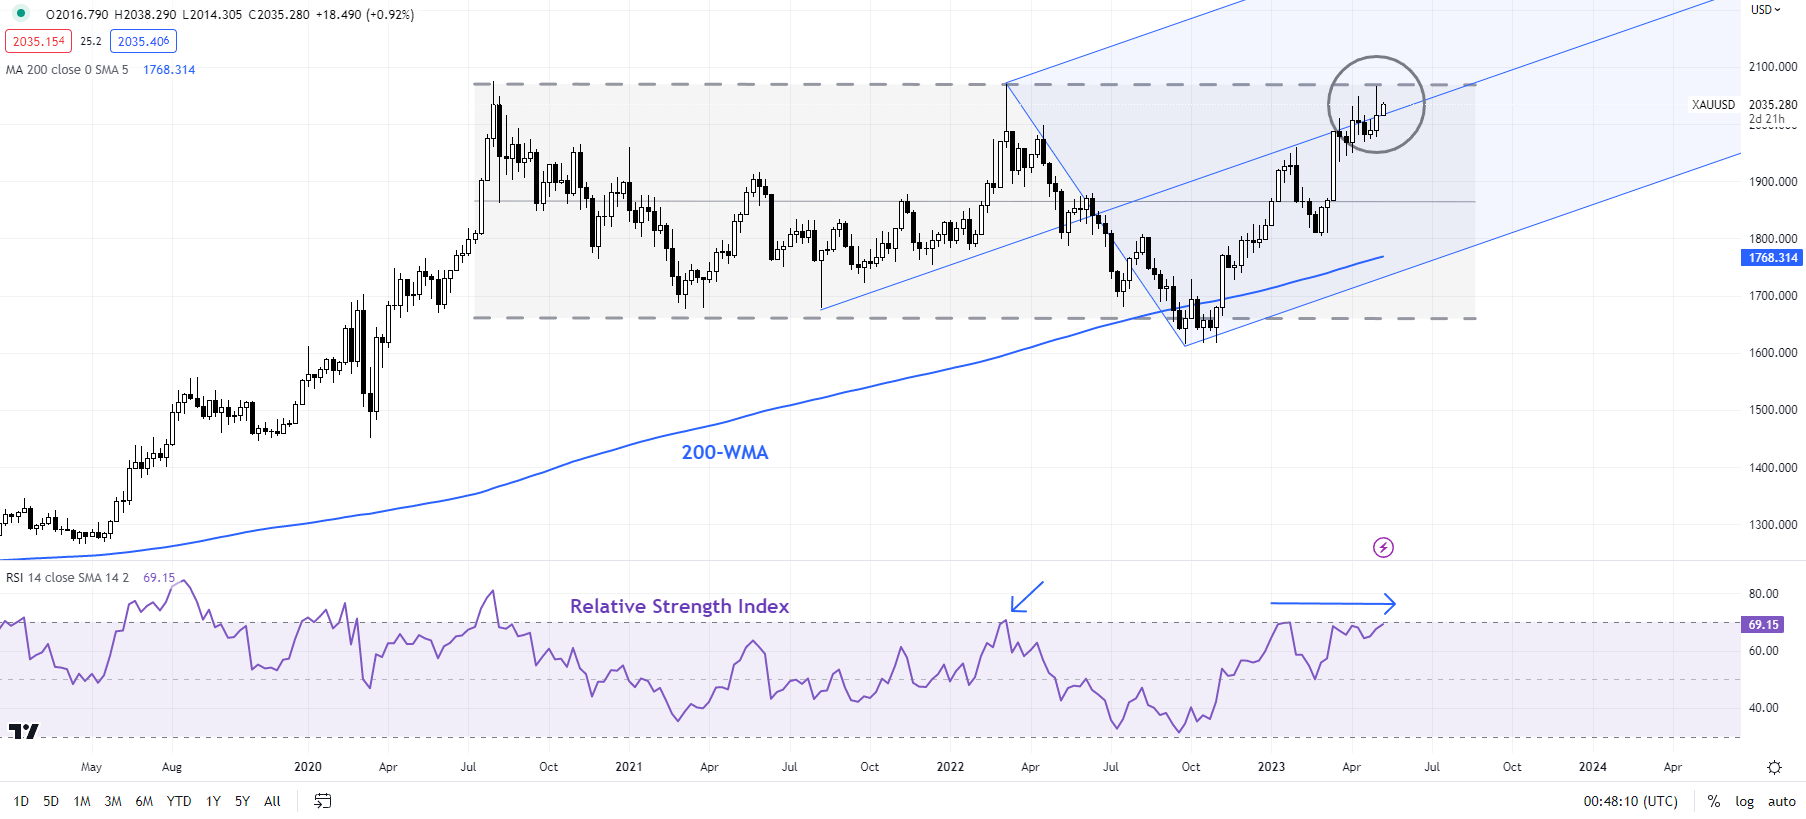
image3.png

Much would also depend on how the US debt ceiling talks progress, keeping the safe-haven bids intact in gold in the meantime. A failure to raise the $31.4 trillion federal debt limit would cause a huge hit to the US economy and weaken the dollar as the world’s reserve currency, US Treasury Secretary Janet Yellen said on Monday.

XAU/USD 240-minutes Chart
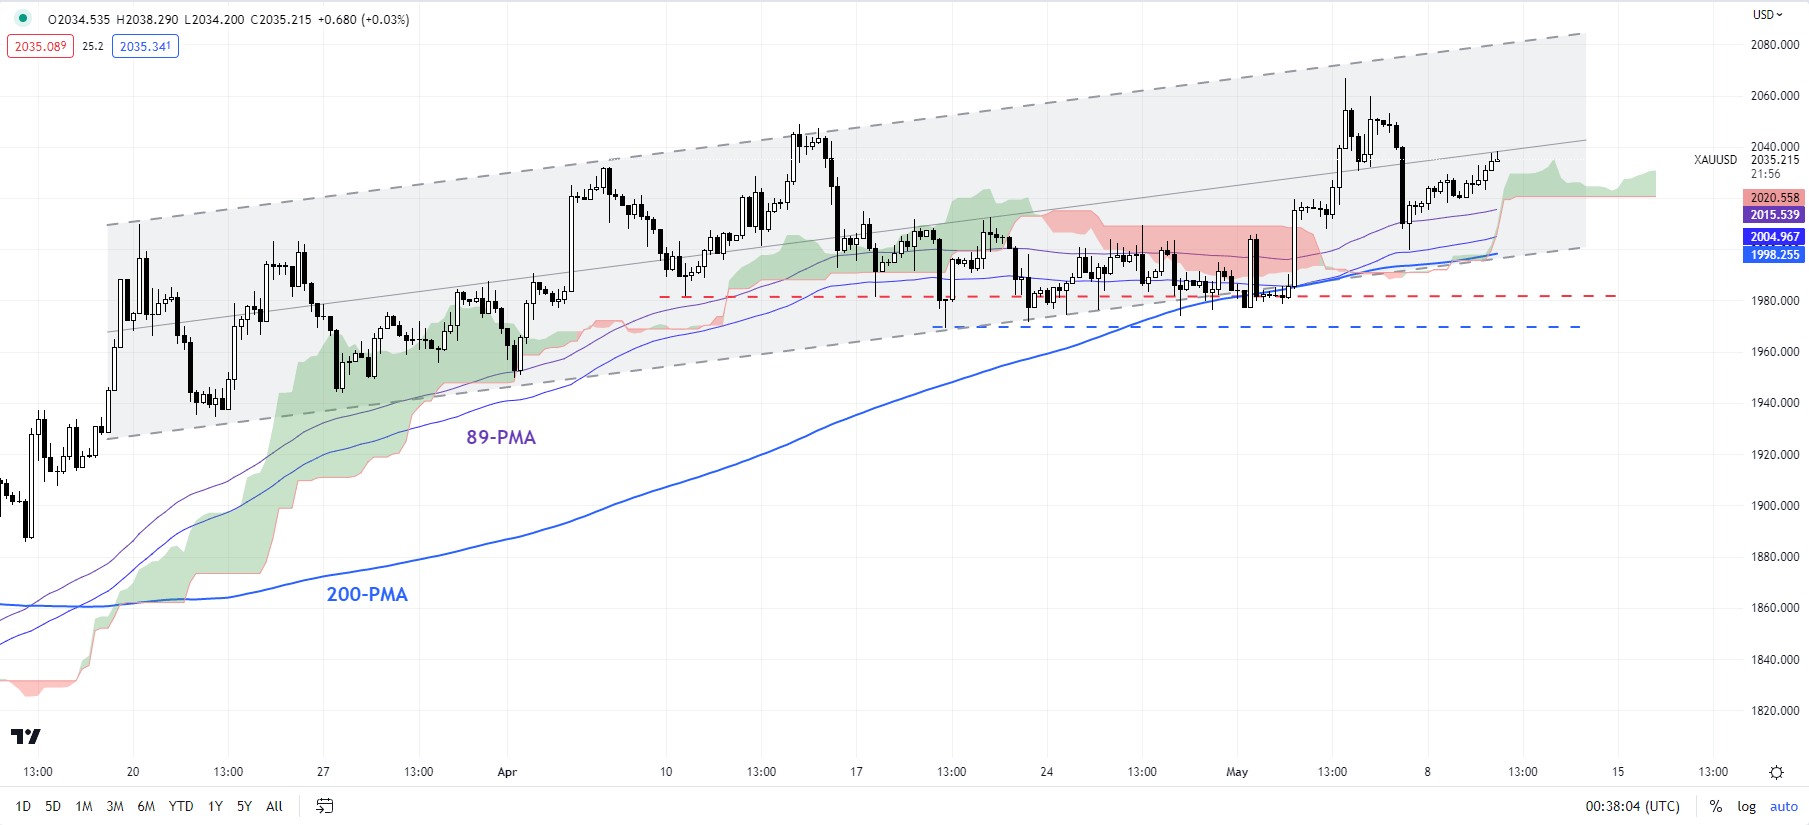
image4.png

Meanwhile, the trend on the daily technical charts has been up since the end of 2022 as the colour-coded candlestick charts, based on trending/momentum indicators, show. While the gains have slowed recently, XAU/USD hasn’t broken any vital support on 4-hourly charts. There is quite a bit of cushion around 1970-2000, including the 200-period moving average and a horizontal trendline from mid-April at about 1970.

XAU/USD Monthly Chart
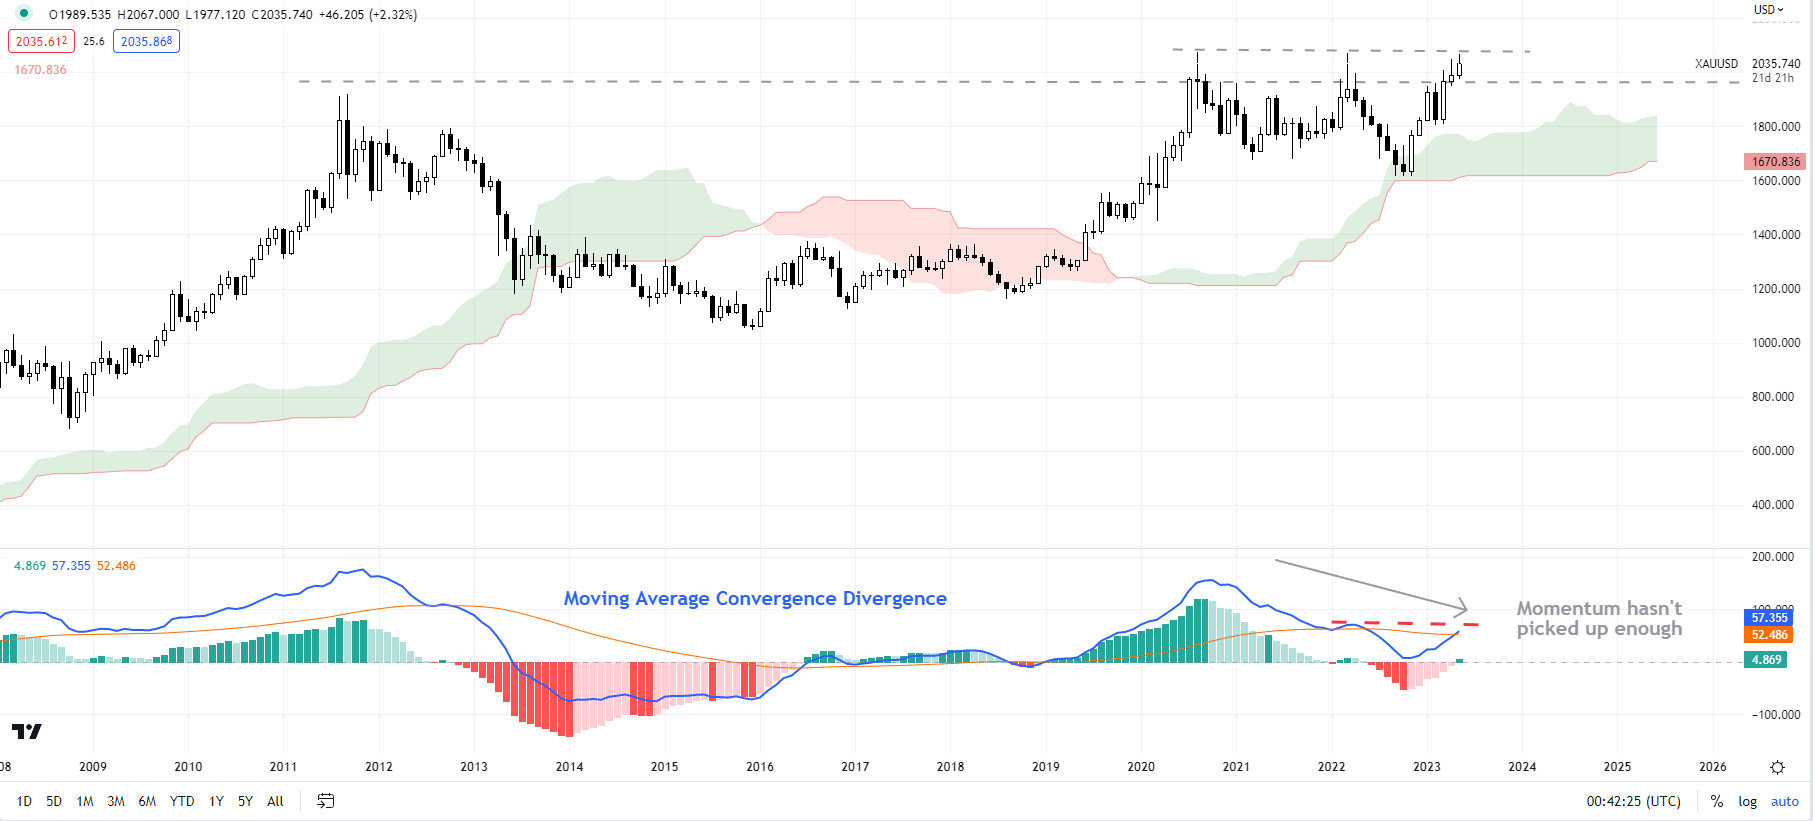
image5.png

While there are no signs of a reversal of the uptrend, the evolution on higher timeframe charts warrants some attention, as highlighted in recent updates (seeMarch 28,April 16, and April 24). Granted, the price action is still unfolding, the momentum on the monthly charts so far hasn’t reflected the strength in gold prices. A key sign to watch would be if the Moving Average Convergence Divergence indicator (MACD) makes a higher high (see the dotted trendline in red on the monthly chart). Such a development would alleviate some of the concerns.

A spurt in upward momentum could push XAU/USD above the 2020 record high of 2072, potentially toward 2250 (the 61.8% projection of the 2015-2020 swing).

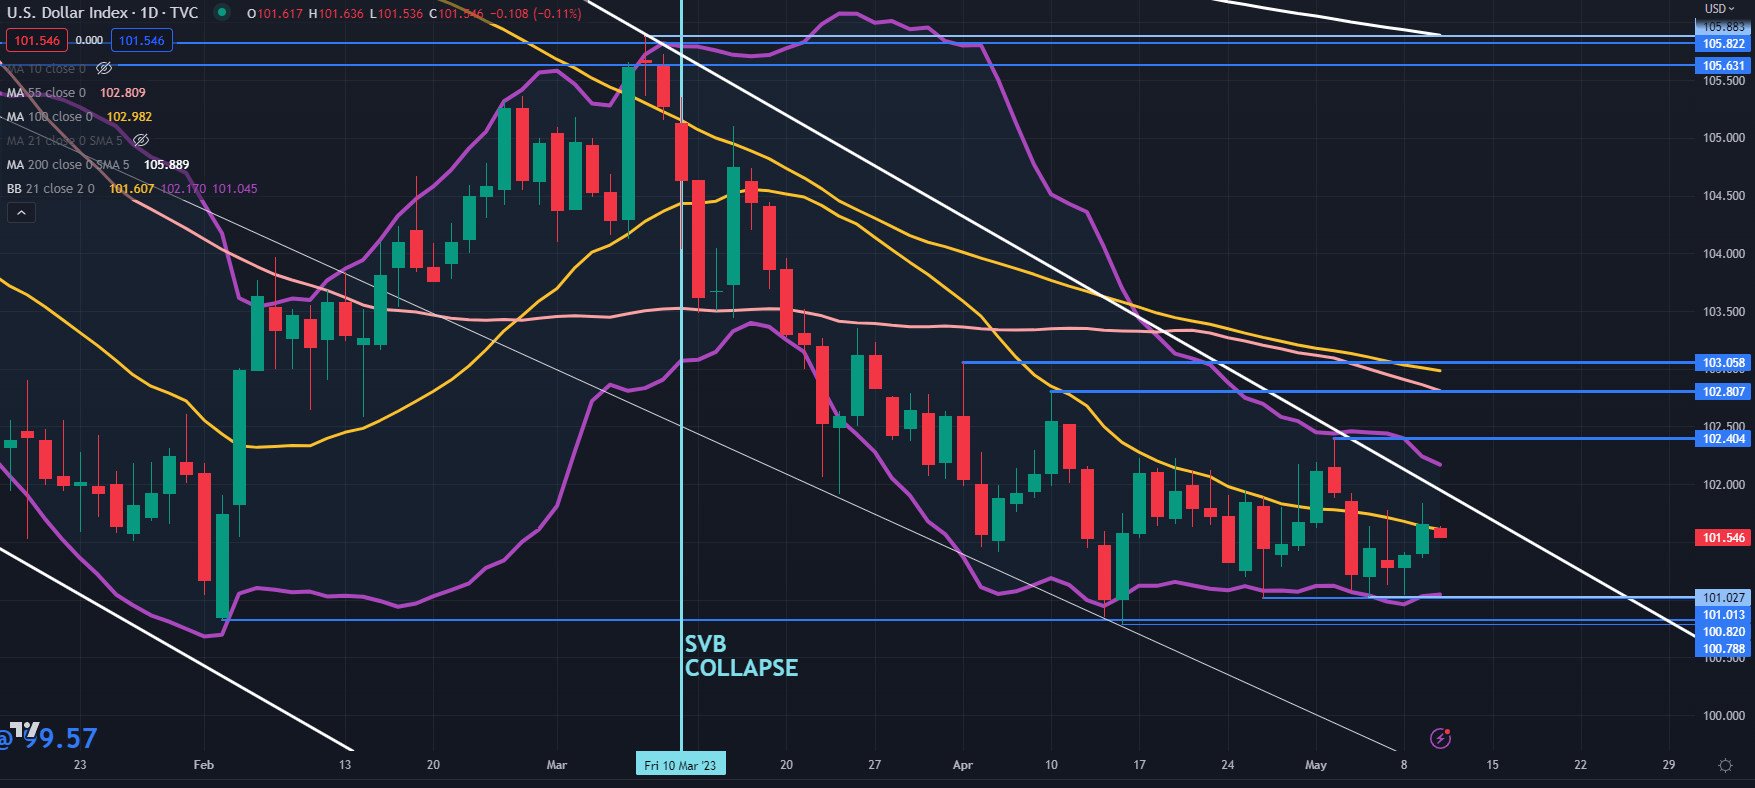
US Dollar Softens Ahead of US CPI as Markets Look for DXY Index Direction

US Dollar Softens Ahead of US CPI as Markets Look for DXY Index Direction

The US dollar drifted lower on Wednesday ahead of crucial US CPI data that may provide the impetus for the market to reposition exposure. A Bloomberg survey of economists is anticipating a headline year-on-year read of 5.0% to the end of April.

The US debt ceiling and issues around US regional banks continue to weigh on market sentiment with Wall Street finishing its cash session lower.

All the major APAC equity indices are in the red although Japan’s TOPIX index remains near 33-year highs.

Yesterday saw New York Fed President John Williams reiterate the Federal Reserve’s view that future decisions for the Federal Open Market Committee (FOMC) will be data-dependent.

Treasuries have barely moved today, while gold is a touch higher and crude oil has softened slightly. The WTI futures contract is approaching US$ 73 bbl while the Brent contract is a touch below US$ 77 bbl.

China has continued to expand its crackdown on foreign companies that it believes have been involved in espionage activities. The Middle Kingdom’s diplomatic stoush with Canada saw a Canadian diplomat expelled from Shanghai. USD/CAD is steady just under 1.3400.

While German CPI and Italian industrial production might hold some attention, US CPI will be the key economic data release today.

DXY(USD) INDEX TECHNICAL ANALYSIS

US Dollar volatility has been sliding lower as illustrated by the narrowing of the 21-day simple moving average (SMA) based Bollinger Bands.

The sideways price action has set up a range trading environment and clean a breakout on either side may see momentum unfold in that direction.

It is important to keep in mind that current market conditions have seen several false breaks. That is when the price makes a new high or low outside the existing range trading band but fails to make a close outside it.

Support could be at the prior lows of 101.03, 101.01, 100.82 and 100.79. On the topside, resistance might be offered at previous peaks of 102.40, 102.81 and 103.06.

image1.png


Japanese Yen Price Setups with US CPI in Focus: USD/JPY, EUR/JPY, GBP/JPY

Japanese Yen Price Setups with US CPI in Focus: USD/JPY, EUR/JPY, GBP/JPY

The US CPI data later Wednesday could confirm if the recent rebound is a dead cat bounce or the start of a renewed leg higher in the Japanese yen at least against some of its peers.

From a monetary policy perspective, the market expects the US Federal Reserve to cut interest rates by 75 bps by the year-end after the US central bank last week indicated a pause in the tightening cycle. Fed easing expectations could keep USD/JPY’s upside capped. The Bank of Japan last month kept the ultra-loose policy settings unchanged, but with Japan’s inflation well above BOJ’s target, it could be a matter of time before the Japanese central bank tweaks policy.For more discussion on BOJ policy, see “Japanese Yen Drops as BOJ Keeps Policy Settings Unchanged: Where to for USD/JPY?”, published April 28.

USD/JPY Daily Chart

image1.png

Chart Created by Manish Jaradi Using TradingView

In the meantime, lingering concerns regarding the US banking sector and uncertainty with regard to the debt ceiling could keep the safe-haven-JPY bided. A key focus is now on US inflation data due later – core CPI is expected to have eased to 5.5% on-year in April from 5.6% in March. Headline CPI is expected to remain steady at 5% on-year.

While price pressures have moderated in recent months, inflation is running well above the US Federal Reserve’s 2% target.A higher-than-expected inflation print could push USD/JPY toward the top end of the recent range around 138.00. On the other hand, a softer-than-expected set of numbers could push USD/JPY toward last week’s low of 133.50.

USD/JPY 240-minutes Chart

image2.png

USD/JPY: Cracks in the rebound?

On technical charts, the inverted “V”-shaped decline recently could be a sign that USD/JPY bulls are exhausted. Any break below the immediate vital floor at the April 27 low of 133.00 would pose a threat to the six-week-long rebound. This follows a failure to clear solid resistance at the March high of 138.00, roughly coinciding with the 200-day moving average. Any break below 133.00 would expose downside risks toward the March low of 129.65.

GBP/JPY 240-minutes Chart

image3.png

GBP/JPY: Holding below resistance

GBP/JPY’s rally has stalled around the October high of 172.10. While this is not necessarily a bearish sign, it could be an early sign that some consolidation given the pace and the extent of the gains from March. So far, the cross has held quite strong converged support on the 4-hourly charts, including the 89-period moving average, coinciding with the lower edge of the Ichimoku cloud. Focus is now on immediate support at the mid-April high of 167.95 – the cross rebounded from this support last week. Any break below would confirm that the upward pressure had eased, opening the way toward the 200-period moving average (now at about 166.25).

EUR/JPY 240-minutes Chart

image4.png

EUR/JPY: Watch support

EUR/JPY’s rally has stalled as it has run into a tough barrier at the 2014 high of 149.75. Like GBP/JPY, so far EUR/JPY has rebounded from above crucial converged support, including the 89-period moving average and the lower edge of the Ichimoku cloud on the 240-minute charts. Any break below immediate support at 145.50-146.50 (including the 200-period moving average on the 240-minute charts) would confirm that the upward pressure had faded in the short term.

EUR/JPY Price Analysis: Consolidation ahead of further gains?

EUR/JPY Price Analysis: Consolidation ahead of further gains?

EUR/JPY comes under pressure and puts the 148.00 neighbourhood to the test on Tuesday.

It seems the bullish outlook now appears somewhat dented. Against that, the cross could move into a consolidative phase before resuming the uptrend and always with the immediate target at the key round level at 150.00 ahead of the 2023 peak at 151.61 (May 2).

So far, further upside looks favoured while the cross trades above the 200-day SMA, today at 142.84.

EUR/JPY daily chart

EUR/JPY

US Dollar Index: A drop below 101.00 and a test of 100.00 are tangible possibilities in the near term – ING

US Dollar Index: A drop below 101.00 and a test of 100.00 are tangible possibilities in the near term – ING

Economists at ING note that the US Dollar Index (DXY) could challenge the 100.00 level.

Downside risks are non-negligible

“While the short-term outlook for the Dollar remains neutral in our view, thanks to positioning skewed to the short-side (more in the Euro section) and unstable risk sentiment, markets remain ready to price in more Fed rate cuts, so downside risks are non-negligible.”

“We favour a stabilisation around 101.50, but a drop below 101.00 and a test of 100.00 in DXY are tangible possibilities in the near term.”

USD/TRY: No major changes in Turkish elections to result in additional Lira turmoil – SocGen

USD/TRY: No major changes in Turkish elections to result in additional Lira turmoil – SocGen

The Lira has been on a weakening trend since December 2021, slipping past 19.50/USD. Economists at Société Générale analyze where the USD/TRY could go depending on the results of the Turkish elections.

If Erdogan is defeated by Kilicdaroglu, Lira assets should rally

“Intervention by the authorities has depleted FX reserves to record lows, exposing the currency to potentially more turmoil in the event of a status quo scenario and no major changes to the political landscape.”

“Any selling is likely to be countered by the authorities and means a controlled rather than abrupt depreciation is more likely.”

“Unconventional monetary policy tactics of liraization may then endure and result in additional Lira selling. In this scenario, we pencil in 20.00/USD by the end of this quarter and 24.50/USD by 1Q24. If on the other hand Erdogan is defeated by Kilicdaroglu, and the opposition block Nation Alliance can form a majority in the Grand Assembly, Lira assets should rally on the basis that policy orthodoxy will be restored.”

EUR/USD stays depressed below 1.1000 amid firmer US Dollar

EUR/USD stays depressed below 1.1000 amid firmer US Dollar

EUR/USD is on the back foot below 1.1000 in the European session, uninspired by the hawkish ECB commentary. The mixed market mood is helping the US Dollar sustain its recovery gains, undermining the currency pair. Speeches from Fed policymakers eyed.

EUR/USD has lost its traction in the European morning and broke below 1.1000. As long as this level stays intact as resistance, the pair could extend its downward correction in the short term.

On Monday, the US Dollar Index started to edge higher in the American session, supported by the recovering US Treasury bond yields. The risk-averse market environment also helped the US Dollar hold its ground against its major rivals. Early Tuesday, Euro Stoxx 50 trades in the negative territory and US stock futures are down between 0.2% and 0.3%, suggesting that investors remain cautious.

The US Federal Reserve’s quarterly survey revealed on Monday that banks have reported tighter standards and weaker demand for commercial and industrial loans to large and middle-market firms over the first quarter. The Fed further noted that tighter standards and weaker demand for all commercial real estate loan categories were also mentioned by survey respondents.

Meanwhile, European Central Bank (ECB) policymaker Martins Kazaks said on Tuesday that a rate hike in July might not be the last rate increase this year. On Monday, ECB Chief Economist Philip Lane noted that there was still a lot of momentum in food and core inflation in the Euro area. Nevertheless, these hawkish comments don’t seem to be having a positive impact on the Euro’s performance against its rivals.

Later in the day, markets will continue to keep a close eye on comments from central bank officials. Federal Reserve Governor Philip Jefferson and NY Fed President John Williams will be speaking on Tuesday. Ahead of Wednesday’s April inflation data from the US, investors could refrain from taking large positions but the USD is likely to benefit if Fed officials push back against the market expectation for a pause in the tightening cycle in June.

Gold Price Latest – $2,000/oz. Support Stands Firm as US Inflation Reports Near

Gold Price Latest – $2,000/oz. Support Stands Firm as US Inflation Reports Near

Last week’s US Jobs Report showed the US unemployment rate falling to 3.4%, matching a five-decade low, while workers’ wages grew further, underlying the strength of the US labor market. Friday’s NFP report gave the US dollar a short-term nudge higher as traders reassessed their US interest rate predictions, but this move subsequently reversed as traders went back to pricing in a series of rate cuts for this year and next. The latest CME Fed Fund rate predictions suggest that the US central bank will cut rates by 75 basis points by the end of the year, and by another 125 bps by the end of 2024.

image1.png

Ahead this week, important US inflation reports will give the market greater clarity on US price pressures, both consumer and producer, while the Michigan Consumer Sentiment survey on Friday is a closely watched index of how consumers see their own financial situation.

Crude Oil Maintains the Gains as Markets Await US CPI. Will WTI go Higher?

Crude Oil Maintains the Gains as Markets Await US CPI. Will WTI go Higher?

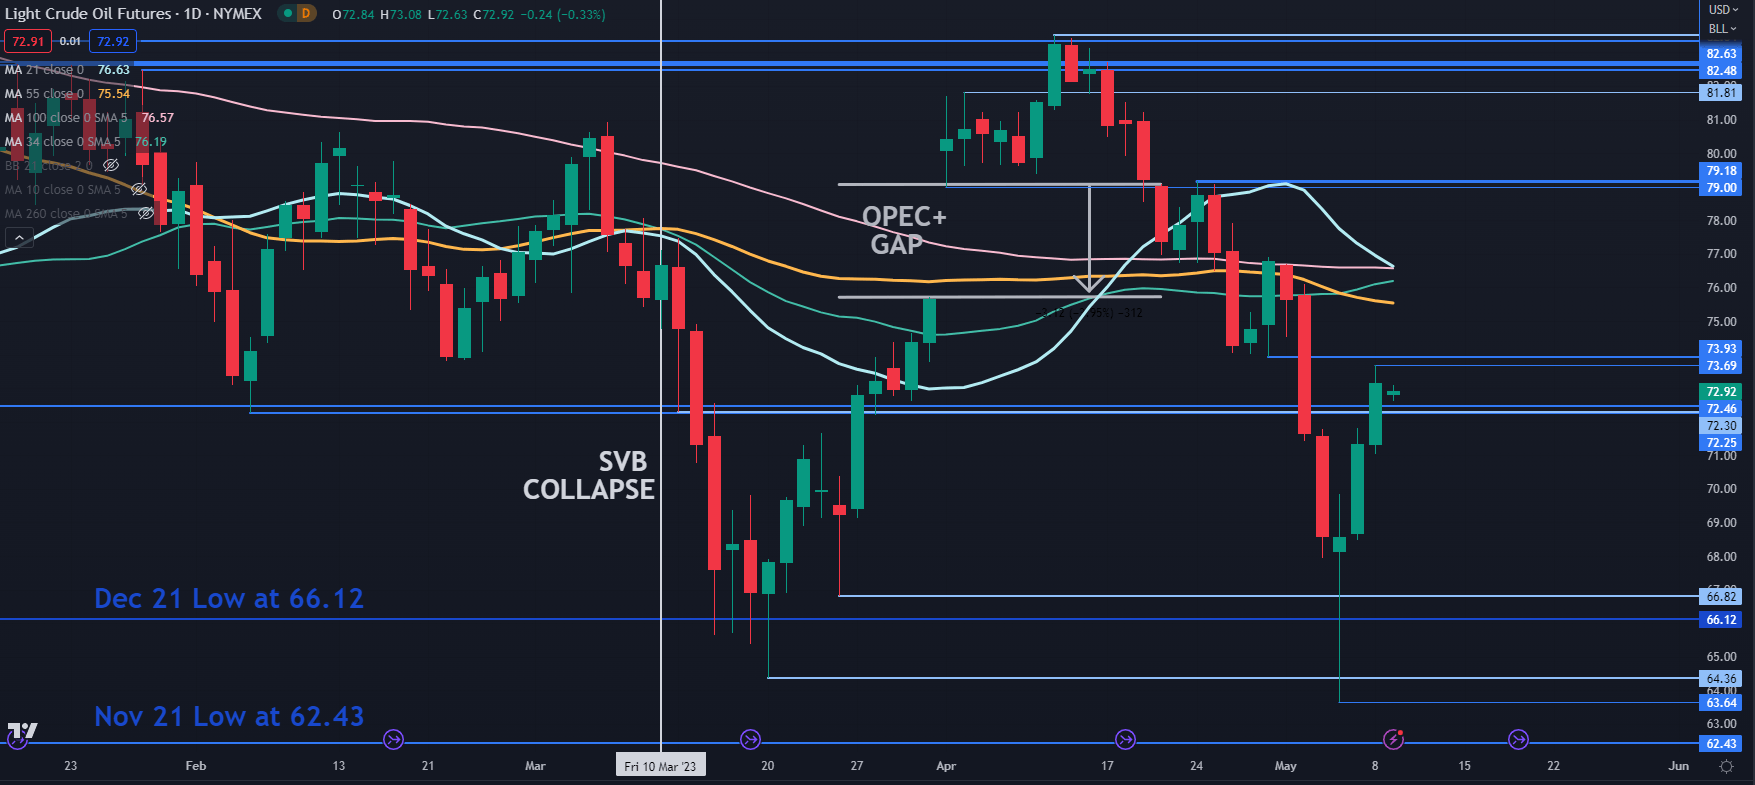
WTI crude oil steadied again today just below US$ 73 bbl after recovering from last week’s sell-off that saw it trade at its lowest level since late 2021.

The American Petroleum Institute (API) will release its weekly statistical bulletin later today, ahead of the monthly OPEC+ oil market report that is due to be released on Thursday

Between those reports, US CPI on Wednesday remains the focus for the broader market.

Spot gold continues to trade above US$ 2,025 an ounce as markets recalibrate after last week’s hike by the Fed.

Treasury yields have eased a touch so far today after adding 7 or 8 basis points across the curve yesterday. The US Dollar is little moved with currency markets in slumber mode.

Wall Street finished barely moved despite lingering concerns around the debt ceiling and regional banking concerns.

APAC equity markets are mixed with Australian, Hong Kong, Korean and New Zealand indices slightly lower while Japan and mainland China have notched some gains.

China’s trade balance came in much stronger than forecast at US$ 90.2 billion for April rather than the US$ 71.25 billion anticipated.

The devil in the detail reveals that exports were slightly stronger, but imports slumped, raising concerns about the prospects of a recovery for the world’s second-largest economy.

image1.png

China also announced a crackdown on foreign companies that it alleges have been spying.

It is shaping up to be a quiet day on the data front, but the Australian Federal Government budget will be delivered, where a surplus is anticipated for the first time in 15 years.

WTI CRUDE OIL TECHNICAL ANALYSIS

WTI overcame breakpoint resistance in the 72.25 – 72.45 area overnight and that zone might now provide support.

Further support might be at the previous lows of 66.82, 66.12, 64.36, 63.64 and 62.43.

On the topside, the nearby breakpoint at 73.93 may offer support ahead of a series of simple moving averages (SMA) in the 75.54 – 76.63 area. If those SMAs are vanquished, it could indicate that bearish momentum might be retreating.

image2.png


GBP/USD Price Forecast: Anticipation Builds Around BoE Announcement

GBP/USD Price Forecast: Anticipation Builds Around BoE Announcement

GBPUSD FUNDAMENTAL BACKDROP

The British pound briefly crept above the May 2022 swing high at 1.2667 to reach 1.2669 yesterday printing a fresh yearly high. Looking at money market pricing below, the probability for the Bank of England (BoE) to raise interest rates by 25bps has now climbed to almost 100% – up from 83% on Friday. As mentioned in my analysis last week, no surprises are expected here but what is of more importance is the BoE’s messaging going forward. Hawks are jumping in and revising rate hikes to the upside (60bps by year end) but with the Federal Reserve looking to pause in its hiking cycle, the BoE may not want to be too aggressive in its messaging. I think the BoE will allow for data dependency to drive decision making but look out for growth and inflation forecasts as well. A final factor to consider is the vote split which revealed a 7-2 split in favor of a hike while the 2 dissenters preferred rates to remain on hold. We are likely to see a similar split, perhaps 6-3 but will any members opt for a rate cut?

BANK OF ENGLAND INTEREST RATE PROBABILITIES

image1.png

Source: Refinitiv

Earlier this morning the UK’s Halifax housing report (see economic calendar below) printed the first decline for the year on a month-month basis. Halifax Bank’s mortgages director stated the following:

“The economy has proven to be resilient, with a robust labor market and consumer price inflation predicted to decelerate sharply in the coming months.”

“The economy has proven to be resilient, with a robust labor market and consumer price inflation predicted to decelerate sharply in the coming months.”

If this really is the beginning of a reduction in inflationary pressures, the BoE’s current market pricing may change drastically, hurting the pound in the short-term.

Later today, Fed speakers are back in focus after their obligatory blackout period and will be closely watched as to how they portray the recent US Non-Farm Payroll (NFP) data as well as their takes on tomorrow’s US CPI.

ECONOMIC CALENDAR

image2.png

TECHNICAL ANALYSIS

GBP/USD DAILY CHART

image3.png

Chart prepared by Warren Venketas, IG

Daily GBP/USD price action still tests the upper bound of the rising wedge chart pattern (black) with no real conviction from bulls to make a meaningful push higher. The next stop would be the June 2020 swing low at 1.2813. The Relative Strength Index (RSI) looks to be opposing the higher highs on GBP/USD and I still remain skewed towards a pullback lower. That being said, upcoming US CPI and the BoE announcement will dictate the short-term directional bias for the pair.