
JAPAN'S PM KISHIDA: I AM REQUESTING A MEETING OF THE UNITED NATIONS SECURITY COUNCIL ON NORTH KOREAN MISSILES.
— Breaking Market News (@financialjuice) February 20, 2023

JAPAN'S PM KISHIDA: I AM REQUESTING A MEETING OF THE UNITED NATIONS SECURITY COUNCIL ON NORTH KOREAN MISSILES.
— Breaking Market News (@financialjuice) February 20, 2023
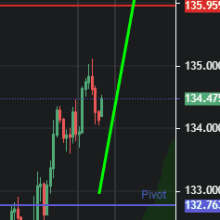
USDJPY Potential for bullish continuation towards previous swing high. Type: Bullish Bounce. Preference: Looking at the H4 chart, my overall bias for USDJPY is bullish due to the current price being above the Ichimoku cloud, indicating a bullish market. Looking for price to rise from this pivot which is the overlap support towards the resistance which is the previous swing high. It’s worth noting that there is an intermediate resistance here where price might struggle to break through.

(Bloomberg) — The euro area’s central banks will disclose their first significant losses from a decade of money printing in the coming weeks, heralding a new era of scrutiny and the prospect of taxpayer bailouts.
When the European Central Bank reveals annual results on Thursday, officials are expected to warn of big shortfalls this year and next across the region as higher interest rates make the cost of servicing deposits built up through quantitative easing soar.
The ECB release will foreshadow a series of awkward national reports, with Germany’s Bundesbank potentially facing the biggest hit of all.
“Results will turn negative for many banks already in 2022, because of the mismatch of interest rates on assets and liabilities,” Bank of Portugal Governor Mario Centeno said in an interview. “We finance ourselves now at higher interest rates, which do not match the return of bonds and all sorts of debt in the central bank’s balance sheet.”
Euro-area losses would add to a list of examples globally, with the neighboring Swiss National Bank standing out for its record shortfall last month. The prospect has left some officials nervous at the light they risk shining on the region’s financial plumbing, and possible fiscal implications.
The Bank for International Settlements insisted this month that such outcomes don’t matter, that central banks can operate with negative equity and that they can’t go bankrupt. Above all, officials claim losses have no bearing on monetary policy.
Even so, the ECB has criticized monetary shortfalls elsewhere in the European Union, and its own rules can require governments to fork out money for national central banks. It’s even feasible that the Frankfurt-based institution itself could need aid.
The Bundesbank will probably post small losses for 2022, rising to €26 billion ($28 billion) in 2023 if ECB rates stay at current levels, according to Daniel Gros, a board member of the Centre for European Policy Studies in Brussels.
That would wipe out the €20 billion of provisions for losses on asset purchase programs as well as its €5 billion of capital and reserves. For a normal company, that could mean insolvency.
A Bundesbank spokesperson declined to immediately comment when contacted by Bloomberg.
Gros expects a warning in the annual financial statements, and for the Bundesbank to “try to negotiate quietly a capital infusion from Berlin” later this year.
However, in the last episode of repeated losses in the 1970s, officials rolled over the shortfall into subsequent years, raising the prospect that they might just do that again.
Other counterparts also face big losses in 2023, but not enough to wipe out capital. Gros expects those to total €17 billion in France, €9 billion in Italy and €5 billion in the Netherlands. If rates remain high in 2024, the Dutch and French central banks would be at risk of negative equity too.
In September, Dutch central bank chief Klaas Knot warned his government of “cumulative losses that will be considerable” in coming years. “In an extreme case, a capital contribution” from taxpayers “may be necessary,” he said.
Jerome Haegeli, chief economist at Swiss Re and a former SNB official, said losses are likely to subject central banks and their money-printing programs to closer political and public scrutiny.
The combination of high inflation — blamed by some partly on QE — and any taxpayer transfers needed to reverse negative capital positions can be seen as “a super tax on economies,” he said.
“Together with central banks not providing windfall gains anymore means the public deficit increases,” he said. In the worst case, filling financial holes at central banks could mean governments “needing even higher taxes.”
The double impact puts central banks’ “most important asset at risk, which is their de facto independence,” Haegeli said.
The losses arise because the ECB created liquidity by buying €5 trillion in predominantly government bonds to stoke inflation and stabilize financial markets through the pandemic. A big part of those funds returned as deposits.
National central banks pay interest on them at the ECB rate, now 2.5%. The matching assets are fixed-coupon bonds paying just 0.5% on average, according to Gros.
Although monetary decisions are taken by the ECB, operations are run nationally. The Bundesbank is worst affected because German government bonds were seen as a safe harbor, with low or even negative yields. The Bank of Greece, whose purchases were much smaller and of higher-yielding national bonds, is likely to stay profitable.
Euro-area institutions did anticipate shortfalls. Total capital and provisioning buffers against losses in the overall system are €229 billion, according to the ECB. “Central banks did a huge amount of provisions during this short cycle of very good results,” Centeno said.
For years, those profits also helped finance government spending, and the reversal now means public funds may be needed to rebuild balance sheets.
In a nearby example, the UK has already approved an £11 billion ($13.2 billion) transfer to the Bank of England under a pre-agreed indemnity.
Switzerland’s central bank hasn’t needed a capital boost after its biggest ever loss — equivalent to about a fifth of Swiss GDP. But the SNB did skip a yearly payment to authorities for only the second time, and officials have started shrinking the balance sheet, limiting future shortfalls.
A A$36.7 billion ($25.1 billion) loss at the Reserve Bank of Australia has left it with A$12.4 billion negative equity. It said in June it hoped to rebuild reserves by retaining future profits, and hasn’t sought government cash.
According to BIS chief Agustin Carstens, that’s fine. He said this month that central banks “can and have operated effectively” even with negative equity. “The bottom line for central banks is not profit, but the public good.”

Meta is rolling a new paid verification subscription service called Meta Verified, CEO Mark Zuckerberg announced on Sunday.
Coming soon, for $11.99/month on web and $14.99/month on iOs, users on Instagram and Facebook will be able to pay to become verified users, which will entail, among other things, a blue verification badge.
The service will first be introduced in New Zealand and Australia this year, and will be available in other nations ‘soon,’ according to Zuckerberg.
This week we’re starting to roll out Meta Verified – a subscription service that lets you verify your account with a government ID, get a blue badge, get extra impersonation protection against accounts claiming to be you, and get direct access to customer support,’ wrote the Meta boss Zuckerberg on Instagram
‘This new feature is about increasing authenticity and security across our services.’
The company has previously granted verification to notable figures including celebrities, business leaders, journalists, politicians and athletes.
Meta said those with pre-existing verification badges will not see their status or options change in the new era of subscription verification.
The new verification system looks a lot like Elon Musk’s Twitter Blue service, which was rolled out in December after an initially delayed launch.
Twitter’s blue check mark subscription costs users eight dollars per month.
According to the Verge, users who sign up for Meta’s new systems will be given exclusive stickers for Stories and Reels, and will also receive 100 free stars per month, or the digital currency used to tip Facebook creators.
Businesses will not yet be able to apply for a verified badge, and it will also be the case that if an individual wishes to change his or her profile name, username, birthday or profile picture, they will have to go through the verification process all over again.
Meta, unlike Twitter, will require users to submit government IDs in order to receive account verification, and will reportedly offer other safeguards against fake accounts as well.
The service’s higher price point on iOS and Android is likely something the company is doing to offset the commission that both the Apple and Google stores take on in-app purchases.

The New Zealand dollar is looking vulnerable as it tests crucial support as the market scales back expectations of an aggressive rate hike by the Reserve Bank of New Zealand.
Expectations for the RBNZ to hike interest rates at its meeting on Wednesday continue to be scaled back in the aftermath of the cyclone amid a softening economy, signs of peaking inflation, and a cooling housing market. The market is now pricing in less than 50 basis points of a rate hike this week to 4.75%, down from 55 basis points a week ago, and 61 basis points a month ago. In contrast, US Fed rate expectations have been repriced higher in recent weeks, keeping NZD/USD under pressure.
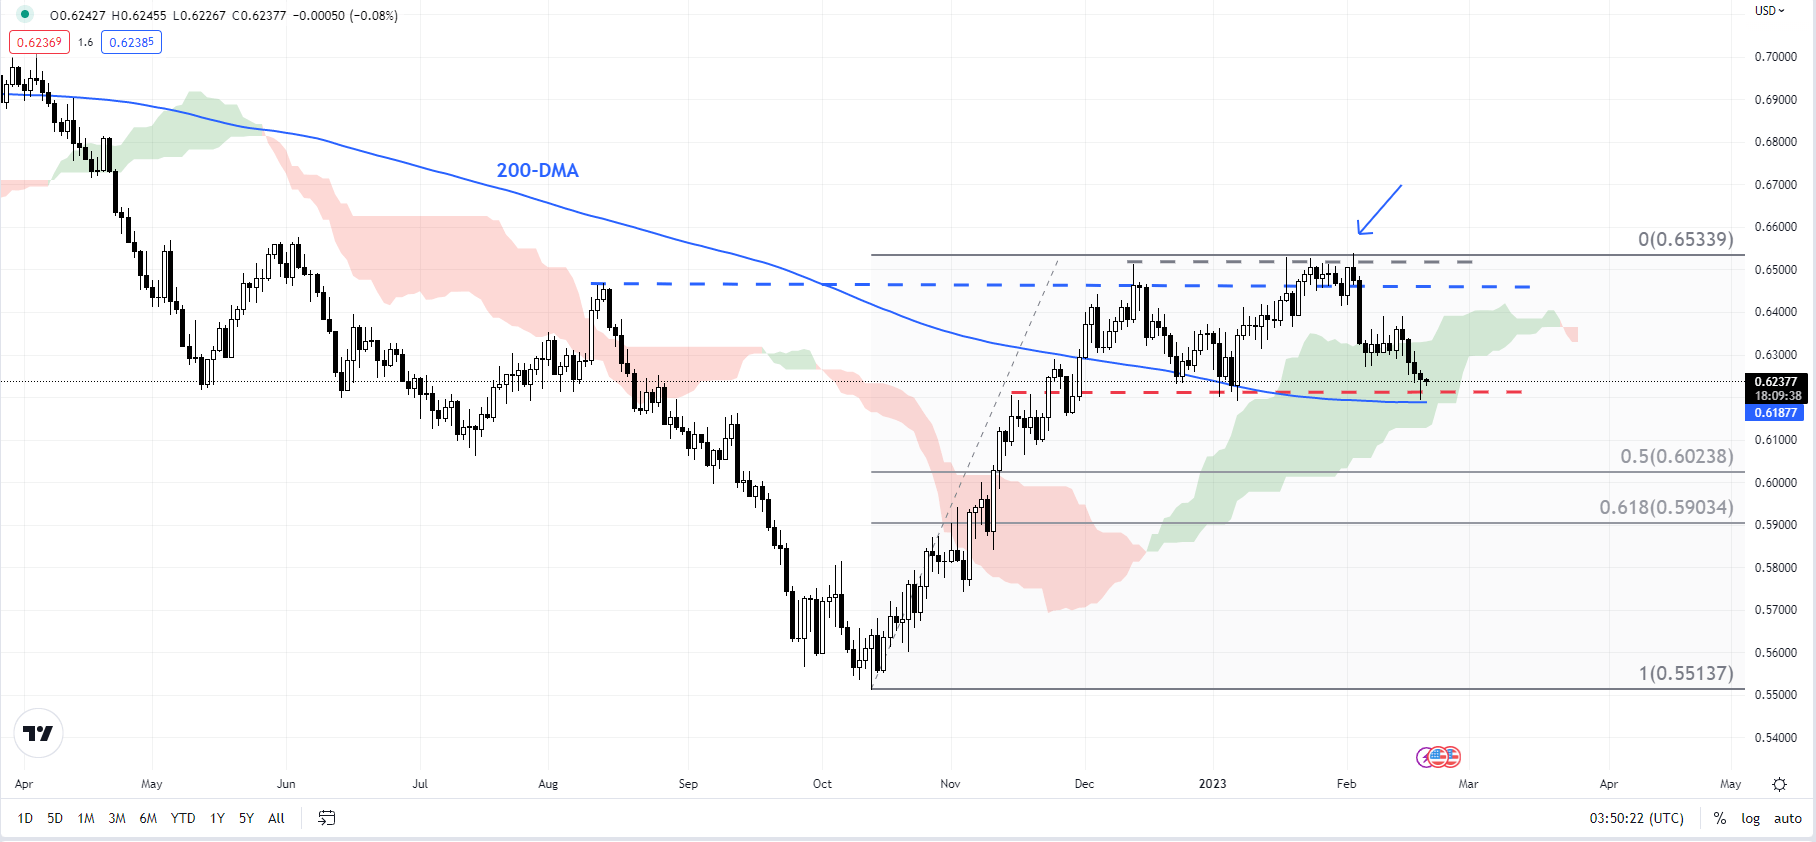
Chart Created Using TradingView
On technical charts, NZD/USD is testing crucial converged support at the January low of 0.6190, coinciding with the 200-day moving average. This follows a failure to break past stiff converged resistance at the December high of around 0.6500, the 89-week moving average, slightly below the 200-week moving average (at about 0.6600).
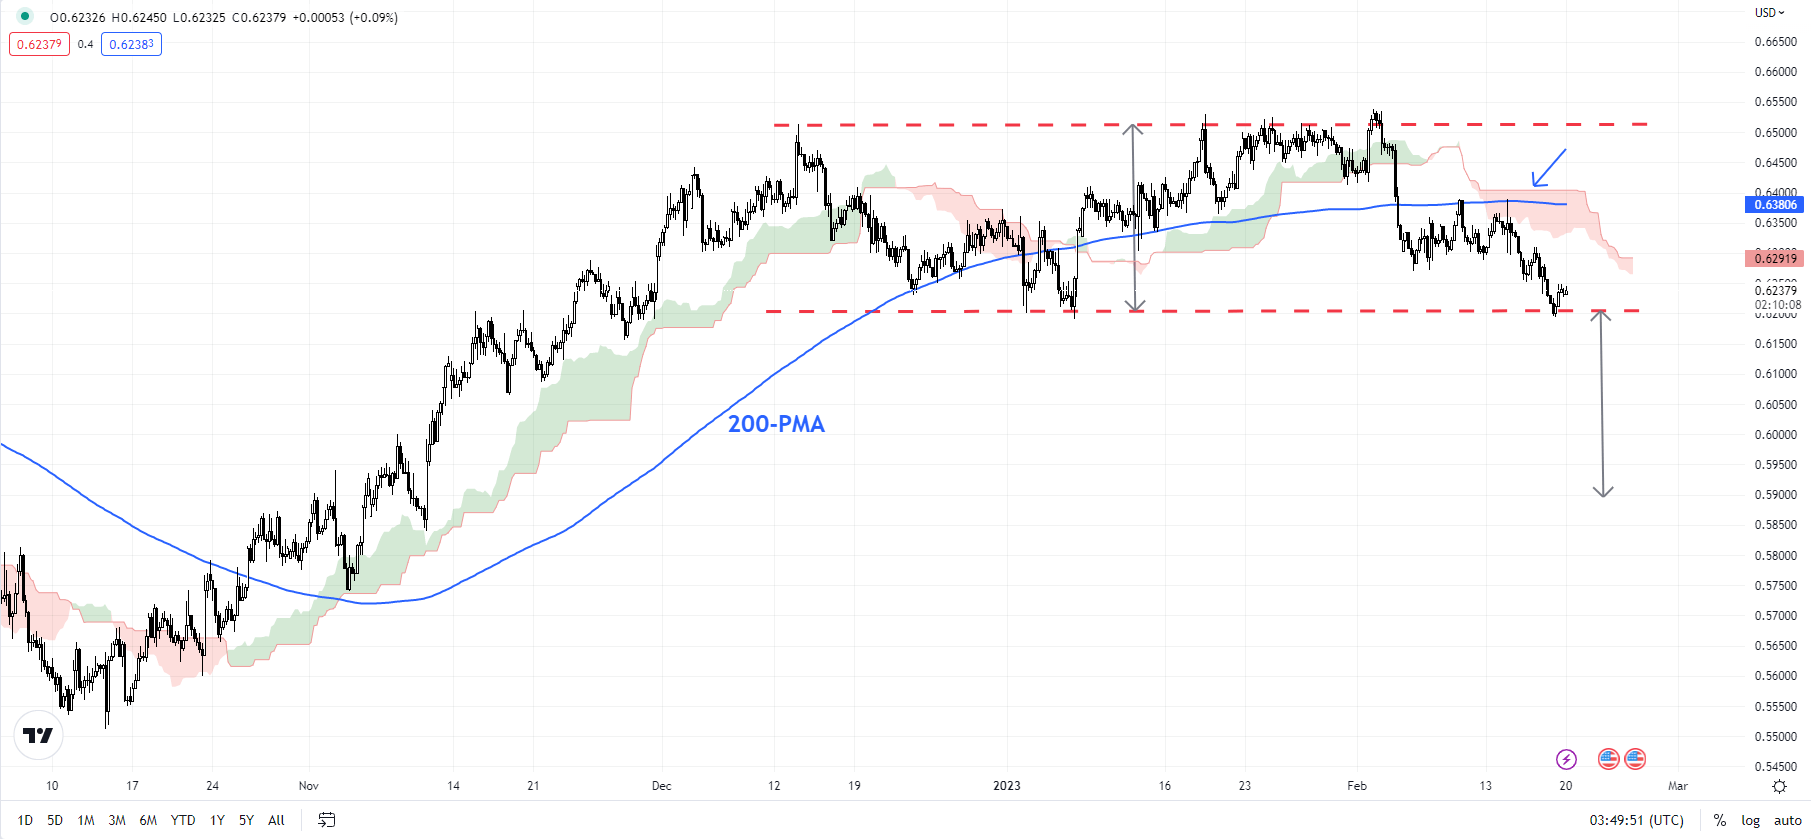
Chart Created Using TradingView
A break below 0.6190 would trigger a minor double top (the end-2022 and the January highs), potentially opening the door toward 0.5850. NZD/USD medium-term outlook has been improving since the fourth quarter of 2022, but the double top pattern, if triggered, would dent those improved prospects somewhat. Below 0.6190, there is support is at 0.6020 (the 50% retracement of the rise from 2022) and 0.5900 (the 61.8% retracement).

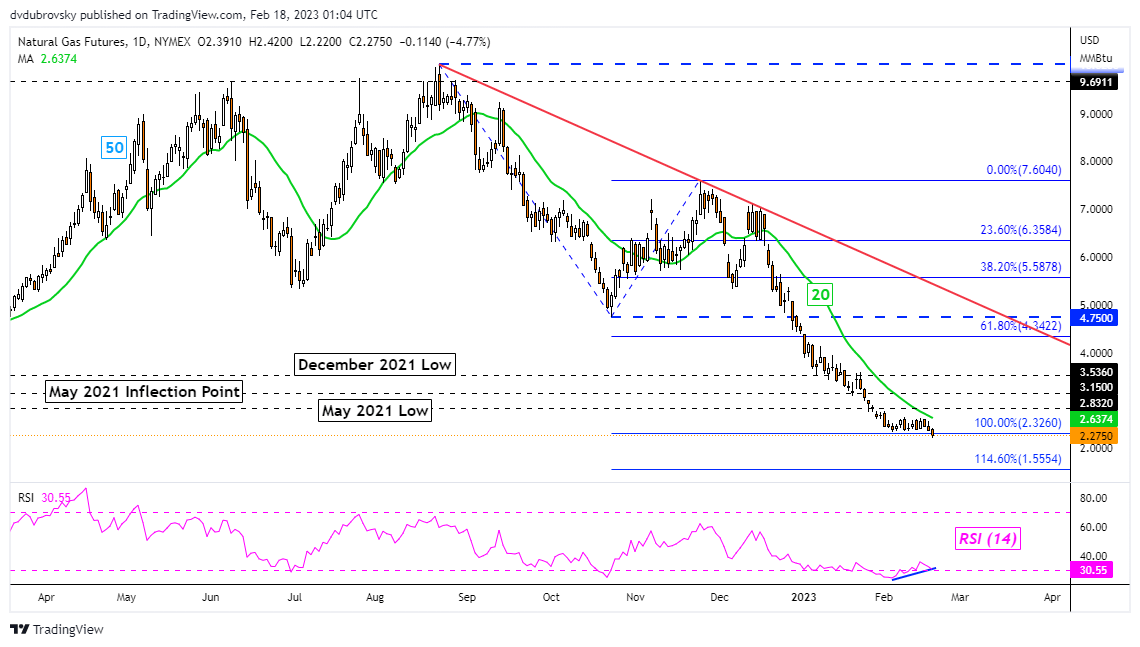
Natural gas prices continued a broader losing streak since the summer of 2022 last week. Following a brief pause on the week of February 6th, the commodity fell 9.5% over the past 5 trading sessions. Prices also confirmed a breakout under the March 2021 low. This meant the lowest close since September 2020. Moreover, it seems prices are continuing to follow the bearish trajectory of a Head & Shoulders chart formation. Is more pain ahead?
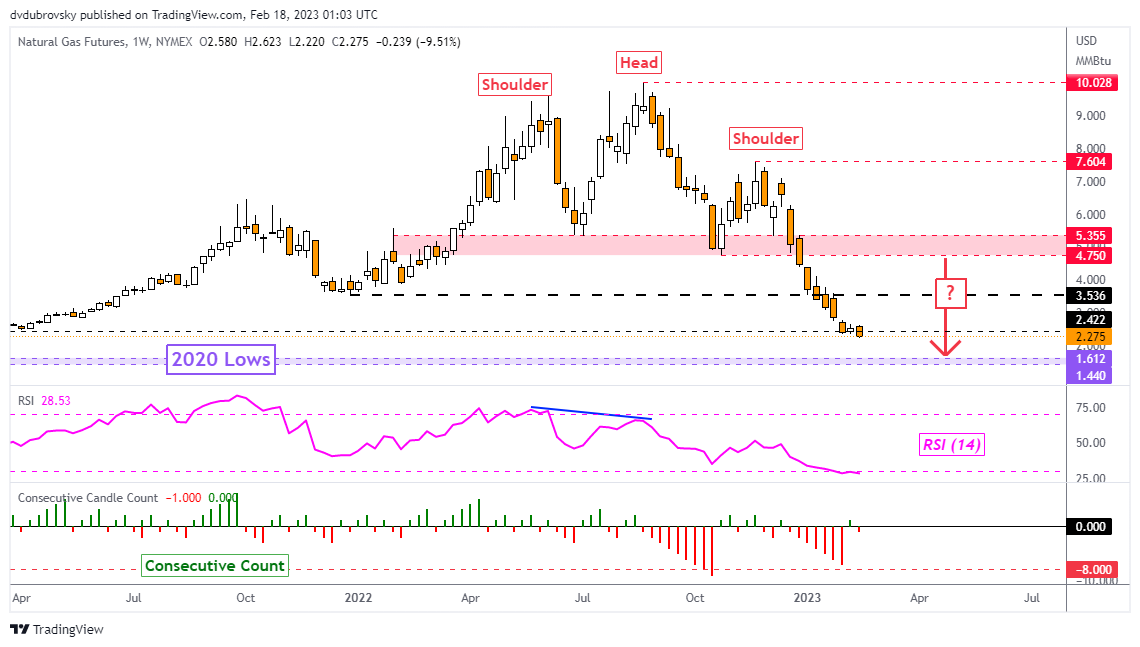
On the daily chart, prices have finally closed under a series of lows established since the end of January. With it, natural gas also took out the 100% Fibonacci extension level at 2.326. That has exposed the 114.6% level at 1.555. But, positive RSI divergence is present. While it does not guarantee that a reversal is at hand, it does show that downside momentum is fading. That can at times precede a turn lower. Still, in the event of a bounce, the 20-day Simple Moving Average (SMA) could hold as resistance, maintaining the downside focus.
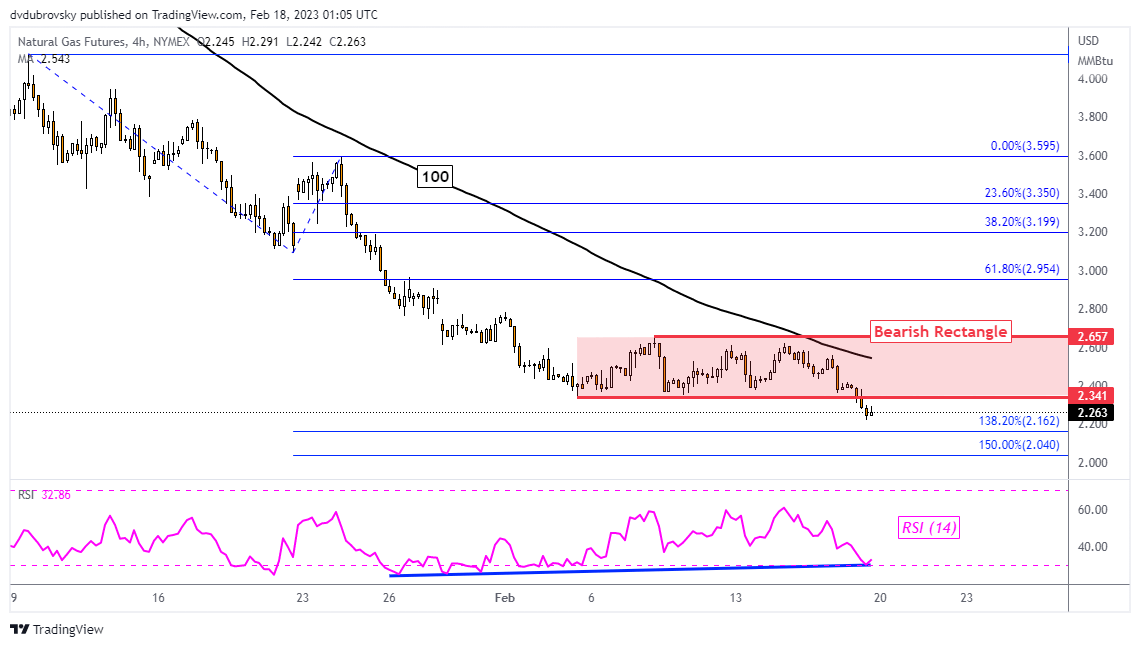
Zooming in further on the 4-hour setting reveals that prices confirmed a breakout under a Bearish Rectangle chart pattern – as expected. That has opened the door to extending losses toward the 138.2% and 150% Fibonacci extension levels at 2.162 and 2.04, respectively. Meanwhile, the 100-period SMA remains tilted lower and may hold as key resistance in the event of a turn higher. A push back into the rectangle may offer an increasingly neutral outlook.

The Japanese Yen is slightly weaker to start the week with the US Dollar firming across the board.
The perception that the Federal Reserve might move toward 50 basis point (bp) hikes rather than 25 bp appears to be weighing on markets.
Cleveland Fed President Loretta Mester and St. Louis Fed President James Bullard both indicated that they would consider a 50 bp lift of the Fed funds target rate at the meeting in late March.
Although Treasury yields dipped slightly on Friday, they finished last week notably higher.
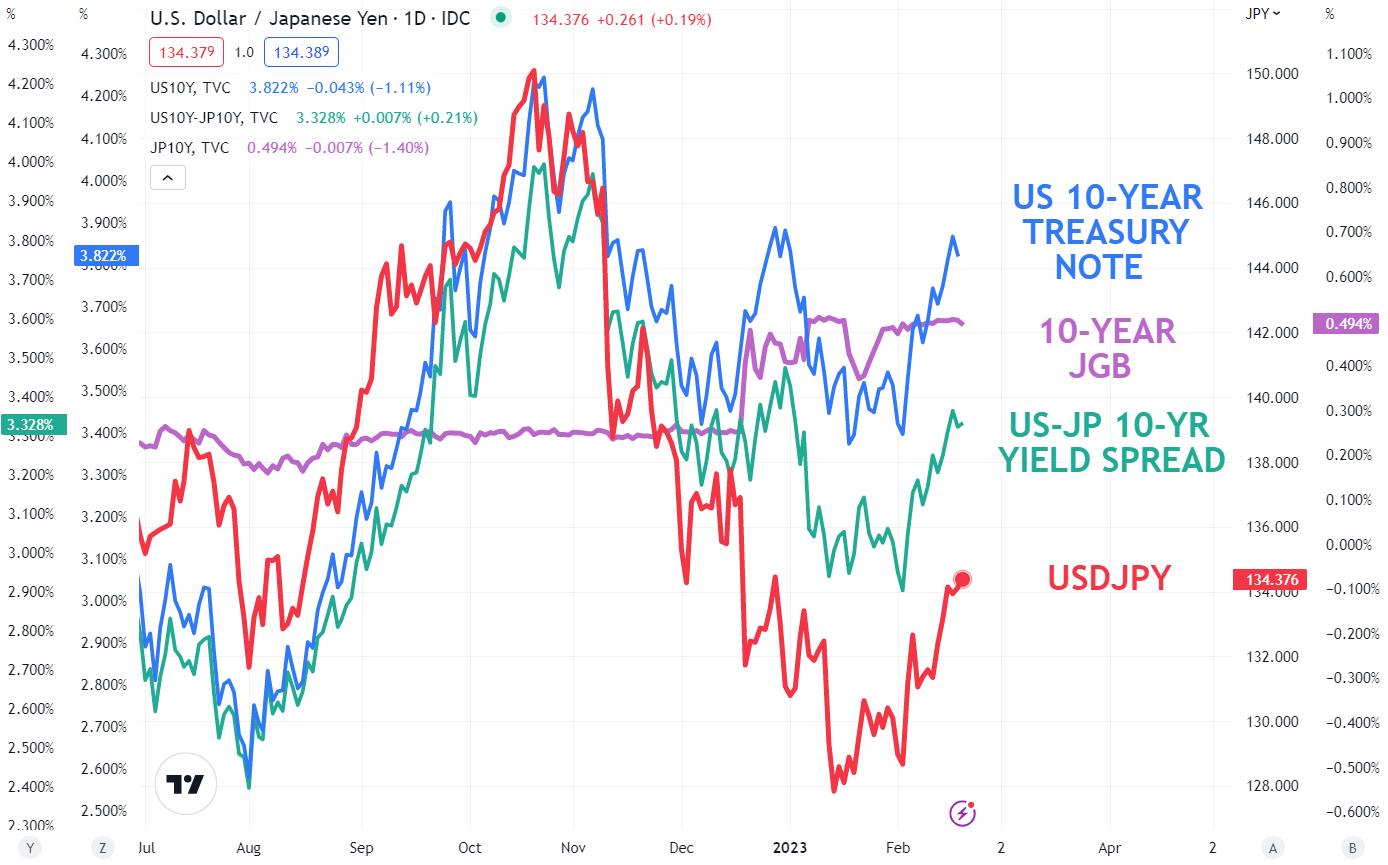
The benchmark 10-year note is trading back above 3.80% at the same time that the 10-year Japanese Government Bond (JGB) remains anchored at 0.50% due to the Bank of Japan (BoJ) exercising Yield Curve Control (YCC).
The question lingers of where the BoJ monetary policy headed after the appointment of Kazuo Ueda to be the new Governor of the Bank of Japan (BoJ). He replaces Haruhiko Kuroda, and he will appear before the Diet (Japanese government lower house) this Friday.
If the policy is overhauled, it might have significant ramifications for USD/JPY with the relationship to yields being apparent in the chart below.
If Japanese yields start heading north, it could have a considerable impact on the exchange rate.
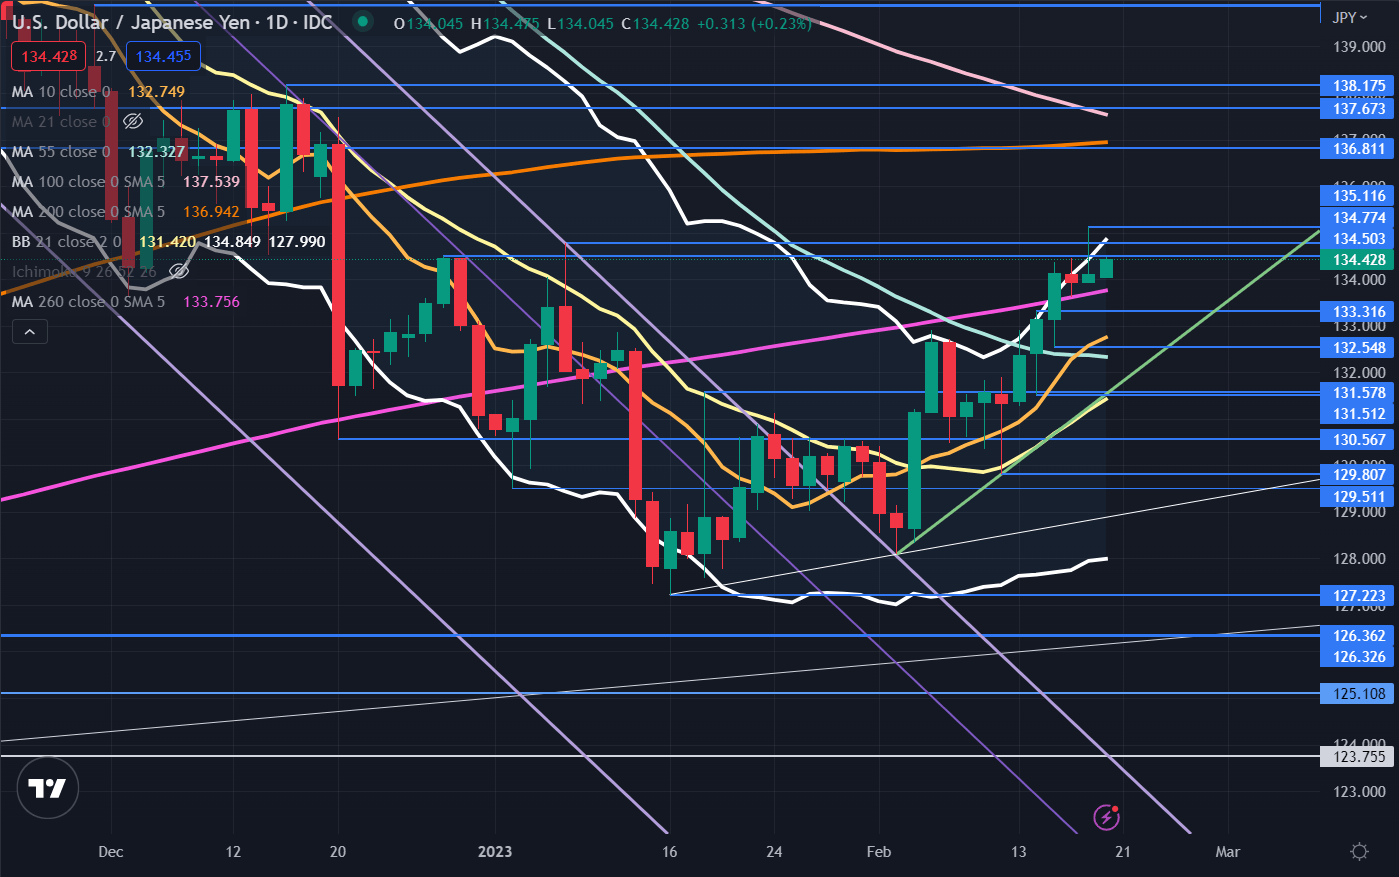
USD/JPY traded above the upper band of the 21-day Simple Moving Average (SMA) based Bollinger Band last week and then closed back inside. This might indicate a pause in the rally or a potential reversal.
The move-up tried to break above two breakpoint resistance levels at 134.50 and 134.77 but was unable to hold the high ground after making a peak of 135.12. These levels may provide resistance.
Further up, resistance could be in the 136.80 – 137.67 area with a breakpoint, prior high and the 100- and 200-day SMAs in this zone.
There appear to be mixed momentum signals for now with the price above the 10-, 21-, 55 and 260-day SMAs but below the 100- and 200-day SMAs. This might signal a range trading environment until there is a clear break above or below all period SMAs.
On the downside, support may lie at the breakpoints and previous lows of 133.31, 132.55, 131.58, 131.51, 130.57 and 129.80.

The Euro’s drop below key support against the US dollar spells some more troubles for the single currency ahead of key US data this week.
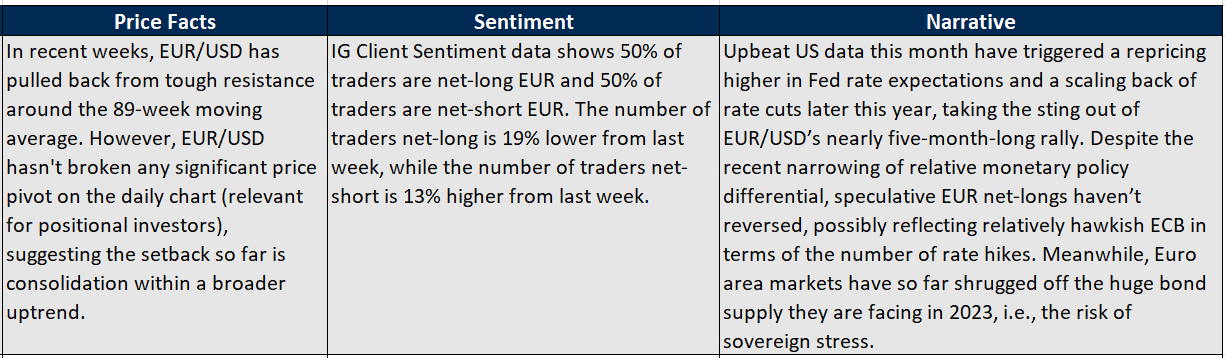
EUR/USD’s drop over the past couple of weeks has almost entirely been a US strength story, rather than a Euro area weakness narrative. The US Economic Surprise Index (ESI) has risen sharply during the period, while the Euro area ESI has been largely flat, but still around 20-month highs.
Surprisingly strong US data since the start of the month (from services and jobs data at the beginning of the month to PPI last Thursday) had led to a reassessment of Fed rate expectations. Markets now expect the Fed funds rate to peak around 5.30% from around 4.90% at the beginning of February, while expectations for rate cuts for later this year have been scaled back. The key focus is now on US core PCE data due Friday, which is seen rising 4.3% on-year Vs 4.3% previously.
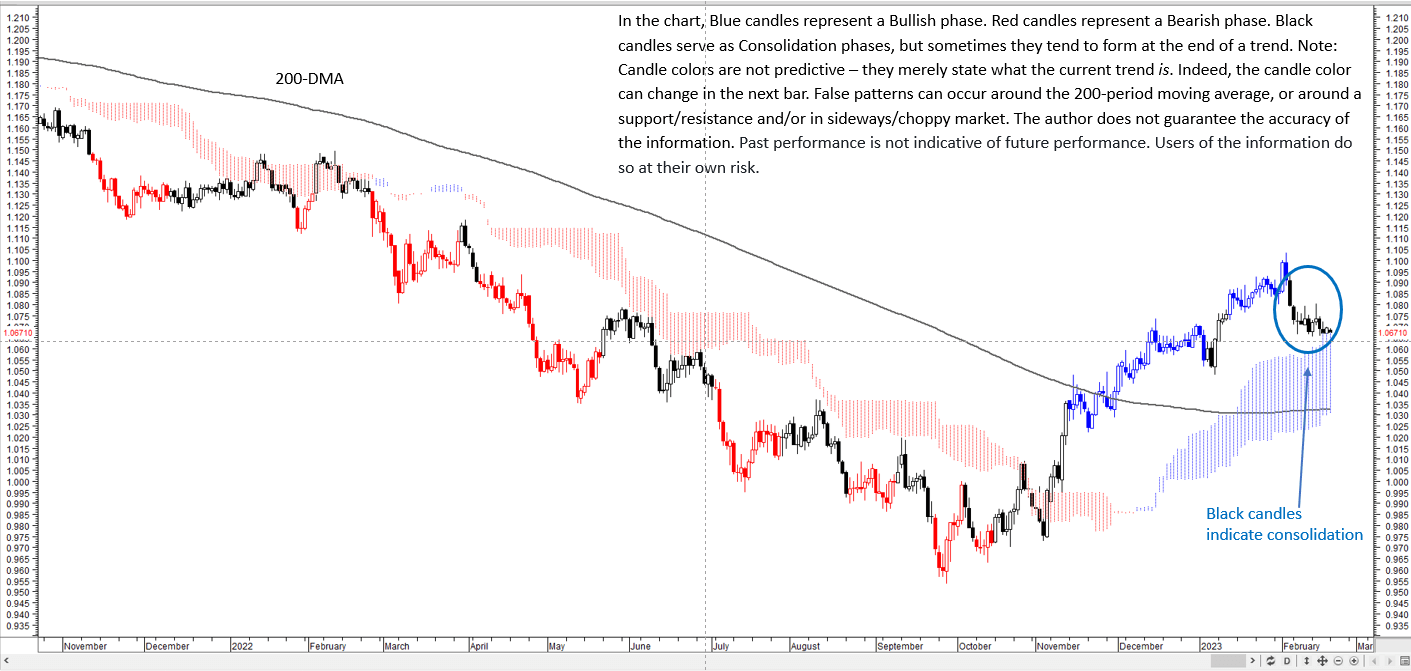
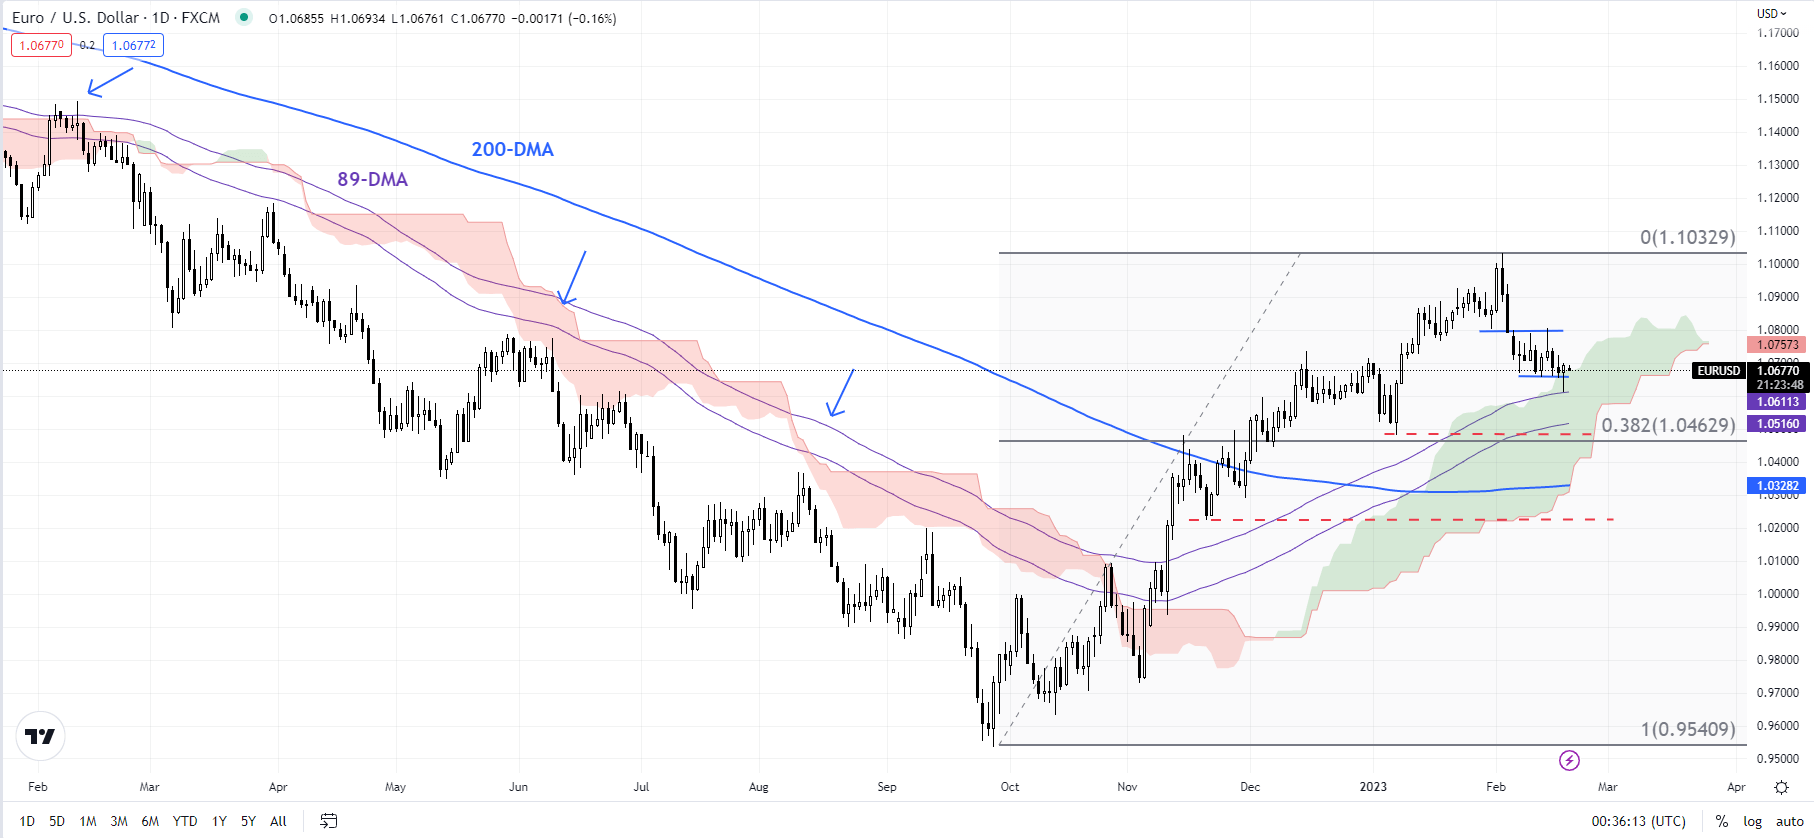
On the daily technical charts, relevant for positional investors, the color-coded candles based on trending/momentum indicators suggest that the consolidation within the broader uptrend continues (see “EUR/USD Technical Outlook: Short-term Setback”, published Feb. 6).
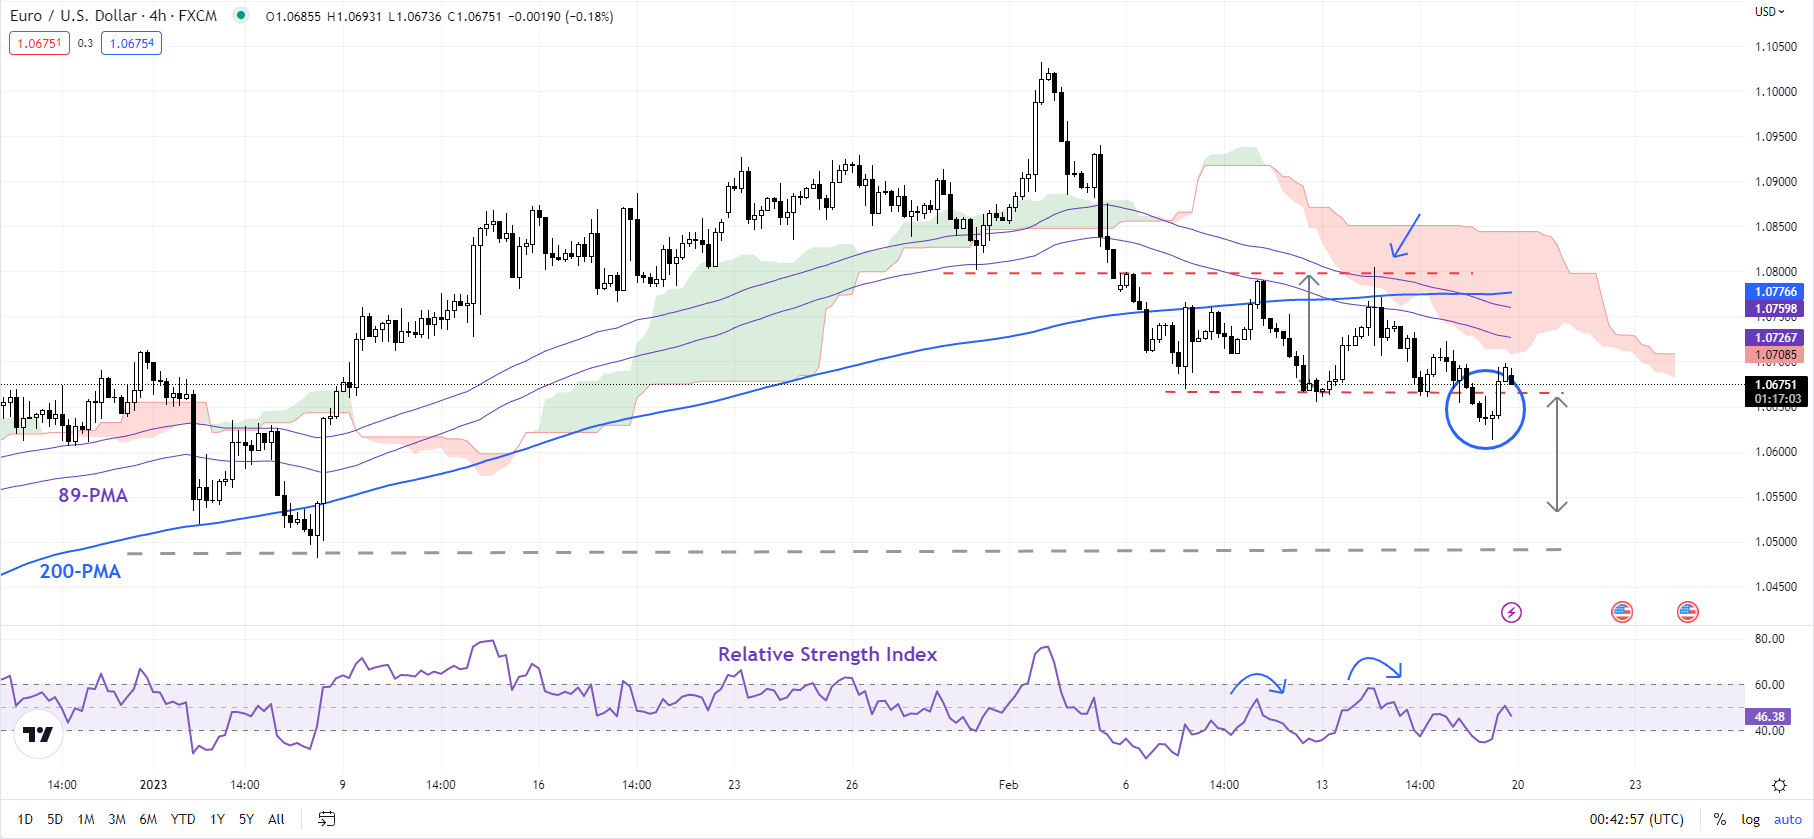
EUR/USD hasn’t yet broken any significant price pivot that would threaten the nearly five-month-long uptrend. In this regard, the January low of 1.0480 is immediate support. A stronger cushion is on the 200-day moving average (now at about 1.0330). The fall below the February 13 low of 1.0650 has triggered a minor double top (the February 9 and February 14 highs), pointing to a setback toward 1.0480.

The US Dollar has started the week slightly firmer as the markets contemplate a Federal Reserve turning more hawkish at their Federal Open Market Committee (FOMC) meeting in late March.
The possibility got legs after Cleveland Fed President Loretta Mester and St. Louis Fed President James Bullard made hawkish comments last week.
They both indicated that they would consider a 50 bp lift of the Fed funds target rate at the next meeting. While Ms Mester is on the board, she is currently a non-voting member.
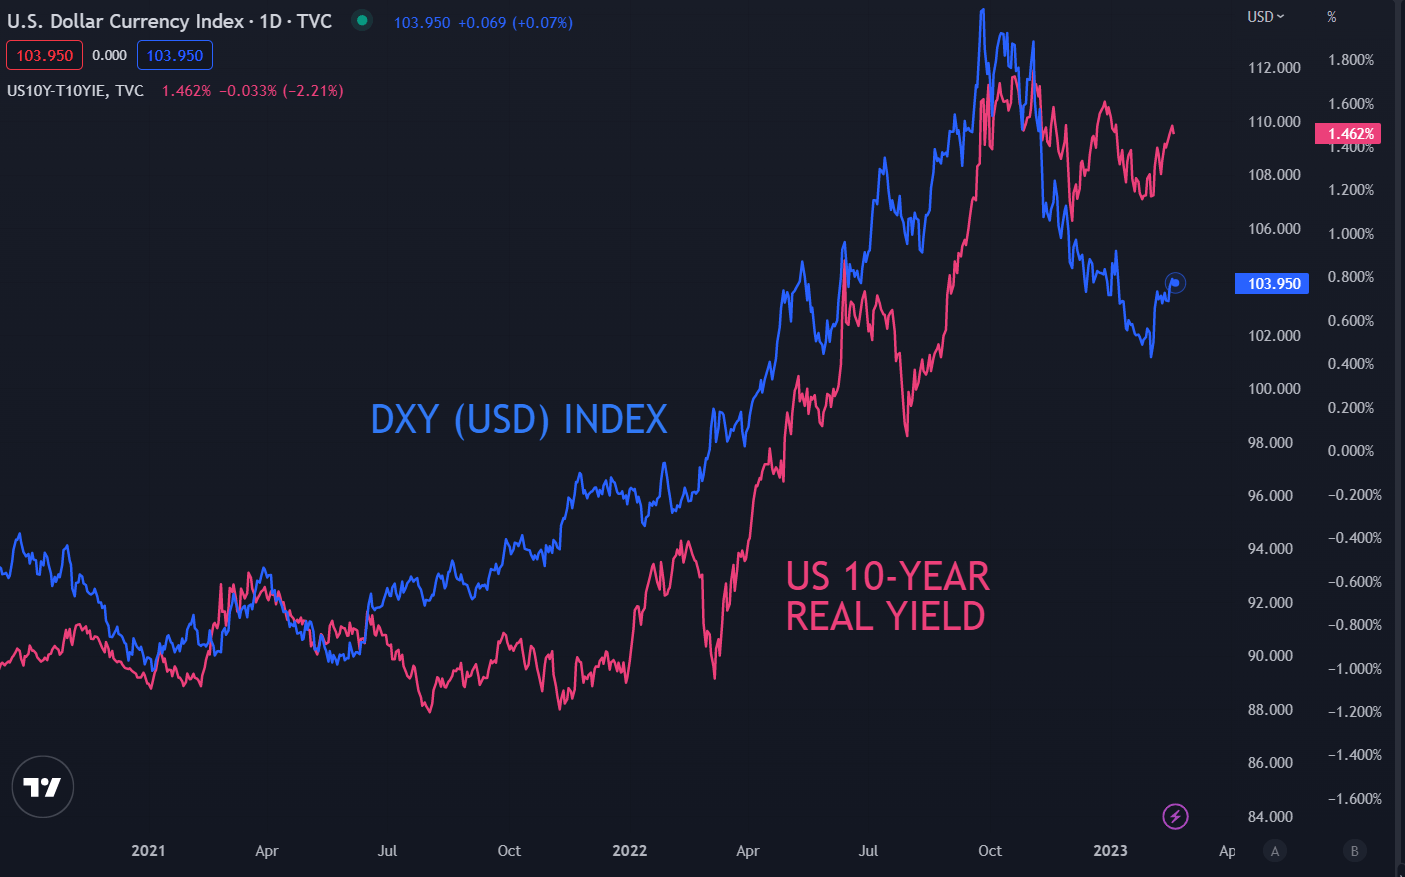
This saw Treasury yields move north into the end of last week and although the US bond market is closed today, the increase in real yields appears to be underpinning the US Dollar.
Real yields are the nominal Treasury yield minus the market-priced inflation rate derived from the Treasury Inflation Protected Security (TIPS) over the same period.
If the Fed decides to go with 50 bp moves, this would be a surprise to markets as the swaps and futures markets are both currently pricing in 25 bp at the next two FOMC gatherings.
The European Central Bank has indicated that they will be moving by 50 bp at their next meeting but their cash rate is more than 200 bp below the Fed.
Geopolitical tensions in the APAC region continue with North Korea firing 2 missiles over the Japan Sea on the weekend. This was followed by the US and South Korea performing combined military exercises today and then 3 more missiles were fired by North Korea on Monday.
This comes on the back of simmering US-China relations after the balloon saga of last week. This has contributed toward a broader concern for risk assets although APAC equities were mixed today.
Australian and Japanese stock indices are fairly flat while China and Hong notched modest gains.
A notable underperformer today has been New Zealand’s S&P/NZX 50 Index which is down over 1%. The cost of cyclone Gabrielle and the prospect of the Reserve Bank of New Zealand (RBNZ) hiking by 50 bp to 4.75% on Wednesday appear to be dragging it lower.
Crude oil prices eked out small gains with the WTI futures contract pressing toward US$ 77 bbl while the Brent contract is having a look above US$ 83.50 bbl. Gold is steady, trading near US$ 1,842 at the time of writing.
Looking ahead, it could be a quiet day with the US on holiday and aside from EU consumer confidence, there is little in the way of data.
Later in the week, FOMC meeting minutes will be released on Wednesday and the Fed’s preferred inflation gauge of Core PCE will be out on Thursday as well as some 4Q US GDP figures.
SHANGHAI : China kept its benchmark lending rates unchanged for a sixth straight month in February, as expected, with the world’s second-largest economy showing more signs of recovery from a pandemic-induced slump.
A clutch of better-than-expected data recently suggests economic activity is rebounding as Beijing exited from its stringent zero-COVID strategy in December and shifted to a pro-growth policy stance.
The one-year loan prime rate (LPR) was kept at 3.65 per cent, while the five-year LPR was unchanged at 4.30 per cent.
“We expect the PBOC to stay accommodative in the first half of this year, but only through liquidity-related actions, not rate cuts,” analysts at Barclays said in a note.
“Unlike the U.S. and EU, China remains the outlier on monetary policy, with still benign inflation and recovering but still weak activity creating room for the PBOC to remain accommodative in the first half.”
In a poll of 27 market watchers, 21, or 78 per cent of all participants, predicted no change to either rate.
New bank loans in China jumped more than expected to a record 4.9 trillion yuan in January as the central bank looks to kick-start recovery while new home prices rose for the first time in a year, as Beijing stepped up support for the property sector that accounts for a quarter of the domestic economy.
Market participants also said the LPR decision was within expectations, as the People’s Bank of China (PBOC) ramped up medium-term liquidity injections, rolling over maturing policy loans last week while keeping the interest rate unchanged.
The medium-term lending facility (MLF) rate serves as a guide to the LPR and markets mostly use the medium-term rate as a precursor to any changes to the lending benchmarks.
In spite of recovering momentum, some analysts expect rates will ease after China’s annual parliamentary gathering in March, when the government announces key growth targets for the year.
“We think the PBOC may cut the MLF rate and banks will subsequently reduce the LPRs as early as March following the annual session of the National People’s Congress which is scheduled to begin on March 5,” said Tommy Wu, senior economist at Commerzbank.
“Macro policy stimulus will likely be announced during the annual session, and it will be a good timing for the PBOC to cut rates and signal that it stands ready to support the economic recovery.”
Tommy Xie, head of Greater China research at OCBC Bank, agreed rates would likely be cut in the coming months.
“Easing monetary policy is likely to work hand in hand with the expansionary fiscal policy in the face of weak domestic demand. A lower interest rate will help minimise the cost of the issuance of government bonds,” Xie said, adding that lower mortgage rate could also help defuse systemic risk.
The LPR, which banks normally charge their best clients, is set by 18 designated commercial banks who submit proposed rates to the central bank every month.
Most new and outstanding loans in China are based on the one-year LPR, while the five-year rate influences the pricing of mortgages. China last cut both rates in August to boost the economy.
 Chat now!