Natural Gas Prices Aim for Fifth Week of Losses, Doji in Focus Before Support

Natural Gas Prices Aim for Fifth Week of Losses, Doji in Focus Before Support

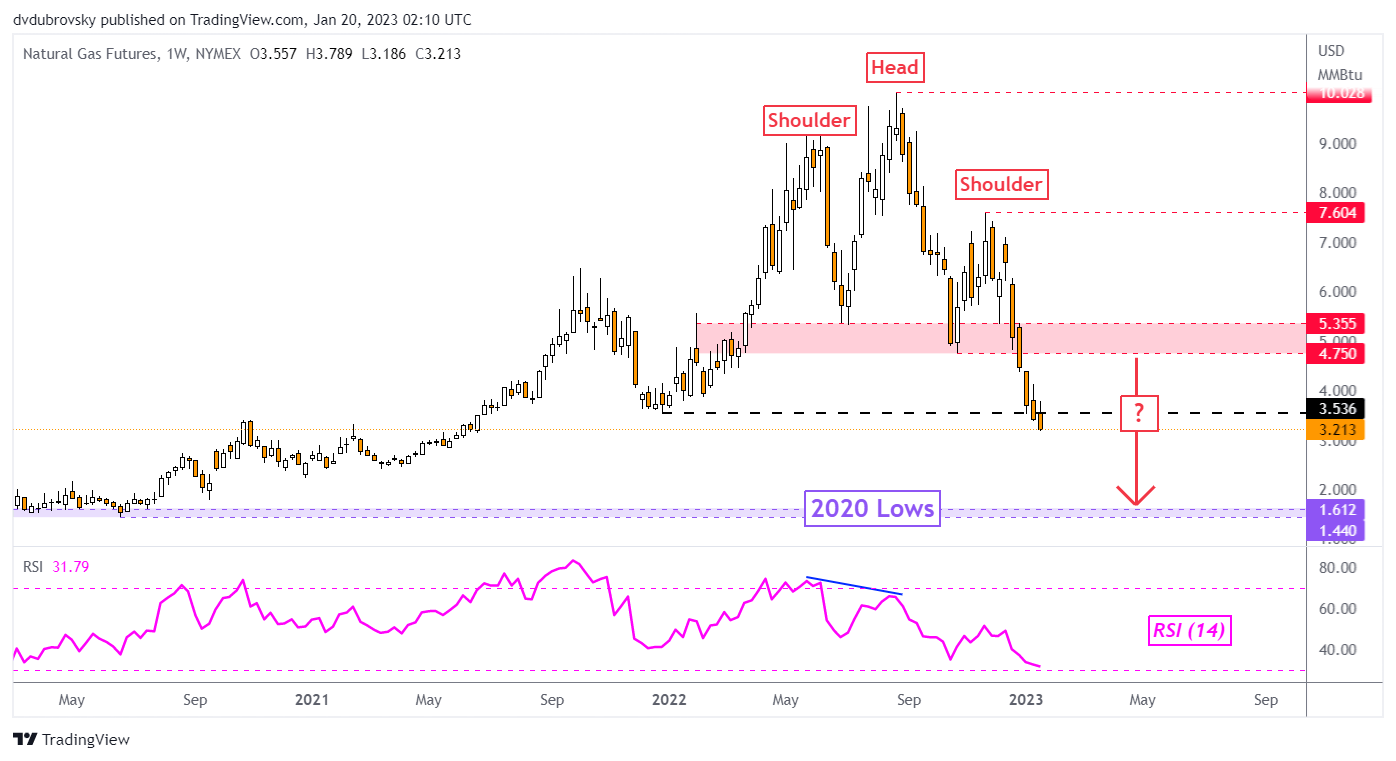
Natural gas futures are heading for a fifth consecutive week of losses with seemingly few technical signs of an impending reversal. That would be the longest losing streak since the middle of September. Looking at the weekly chart below, prices are attempting to confirm a breakout under the December 2021 low at 3.536, exposing the bottom achieved in 2020.


Prices have been trading in the anticipated downward trajectory of a bearish Head and Shoulders chart pattern, bringing natural gas closer towards the 1.44 – 1.61 support zone. The commodity broke under this pattern in late 2022, confirming a breakout earlier this month. That has opened the door to resuming what has been the dominant downtrend since the summer of 2022.

Weekly Chart – Head & Shoulders Breakout Remains in Focus

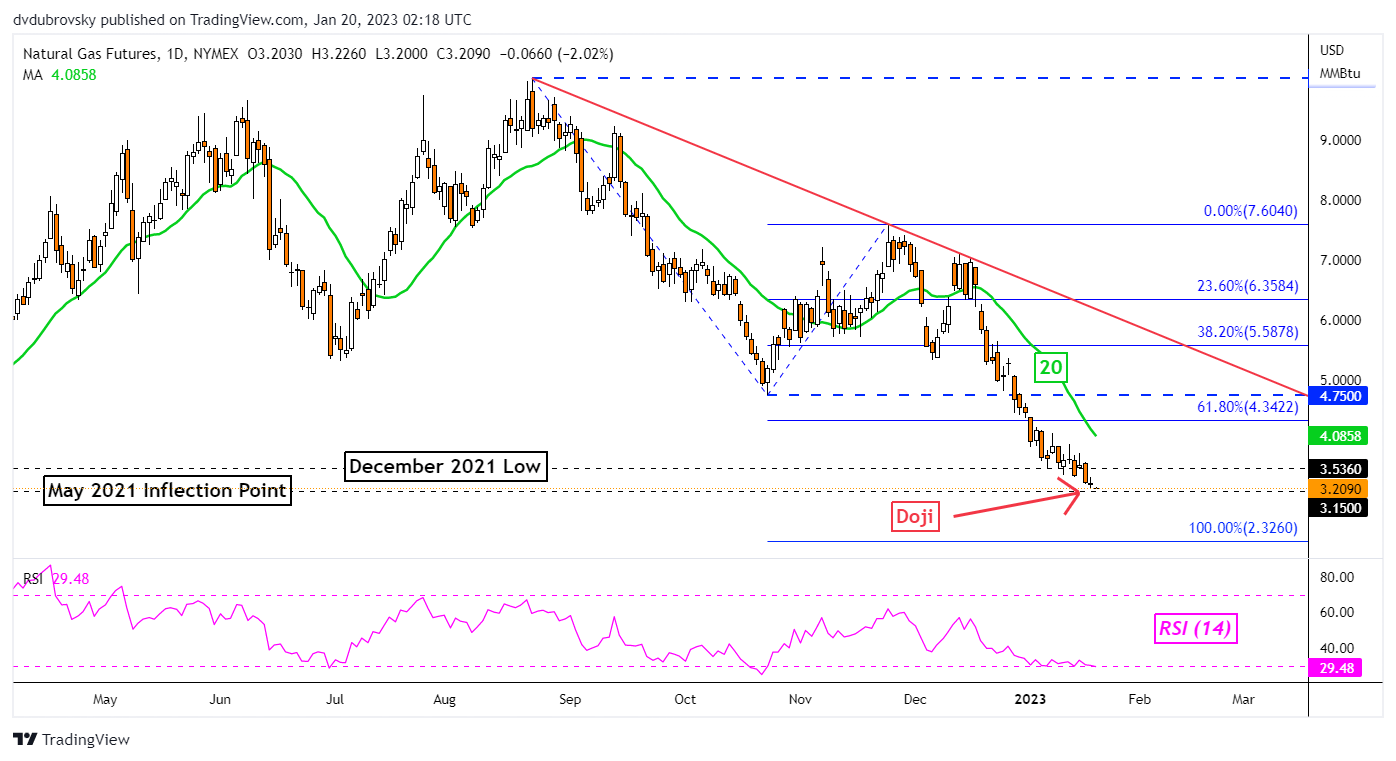
Zooming in on the daily chart reveals that prices left behind a Doji candlestick pattern on Thursday. This is a sign of indecision within the context of trending markets. In this case, since the Doji appeared within the downtrend, it could be an early signal that momentum might be readying to reverse course. But, such confirmation is lacking.

Upside progress in the coming sessions could open the door to a reversal, placing the focus on the 20-day Simple Moving Average (SMA). The latter could hold as key resistance, reinstating the dominant downtrend. Still, even if prices turn meaningfully higher, the falling trendline from August is keeping the focus tilted lower. As such, there is plenty of room for consolidation before the downtrend fully ends.

The May 2021 inflection point at 3.15 seems to be immediate support. Closing under this price exposes the 100% Fibonacci extension level at 2.326 on the chart below. This would also overturn the Doji, opening the door to downtrend resumption. A look at RSI shows that divergence is lacking, hinting that momentum remains firmly pointed lower.

image2.png


Euro (EUR/USD) Latest – The Bullish Trend Remains in Place as the ECB Talks Tough

Euro (EUR/USD) Latest – The Bullish Trend Remains in Place as the ECB Talks Tough

The European Central Bank is not for turning and will continue to raise interest rates, and keep them there for long enough, ‘so that we can return inflation to 2%’, according to ECB President Lagarde, speaking at the World Economic Forum in Davos. Ms. Lagarde also warned those who questioned the ECB’s intent to further tighten monetary policy into restrictive territory saying, ‘I would invite them to revise their position, they would be well-advised to do so’. Also speaking at DAVOS, Dutch central bank chief Klass Knot suggested that rate hikes will not stop with just one 50bp hike. Knot added ‘most of the ground that we have to cover, we will cover at a constant pace of multiple 50 basis point hikes’. Whether the markets chose to listen to the ECB is another matter, and unless the central bank follows through on its talk, its authority will come under increasing pressure. Financial markets are a very unforgiving place.

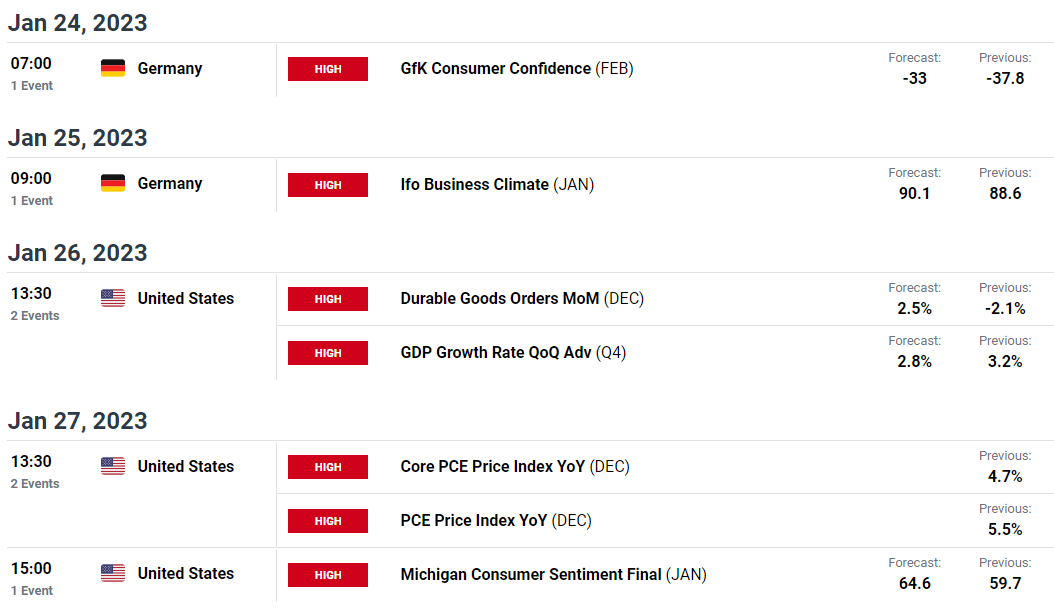
Next week’s economic calendar has a raft of high-importance releases that will affect both sides of EUR/USD. The latter half of the week looks the most likely to drive price action with the first look at US Q4 GDP, followed the next day by the Fed’s preferred measure of inflation, core PCE. If either of these releases misses or beats expectations then EUR/USD volatility will surge. In addition to these releases, the latest round of PMI data will be revealed on Tuesday (24th) next week and they should be closely followed.

image1.png

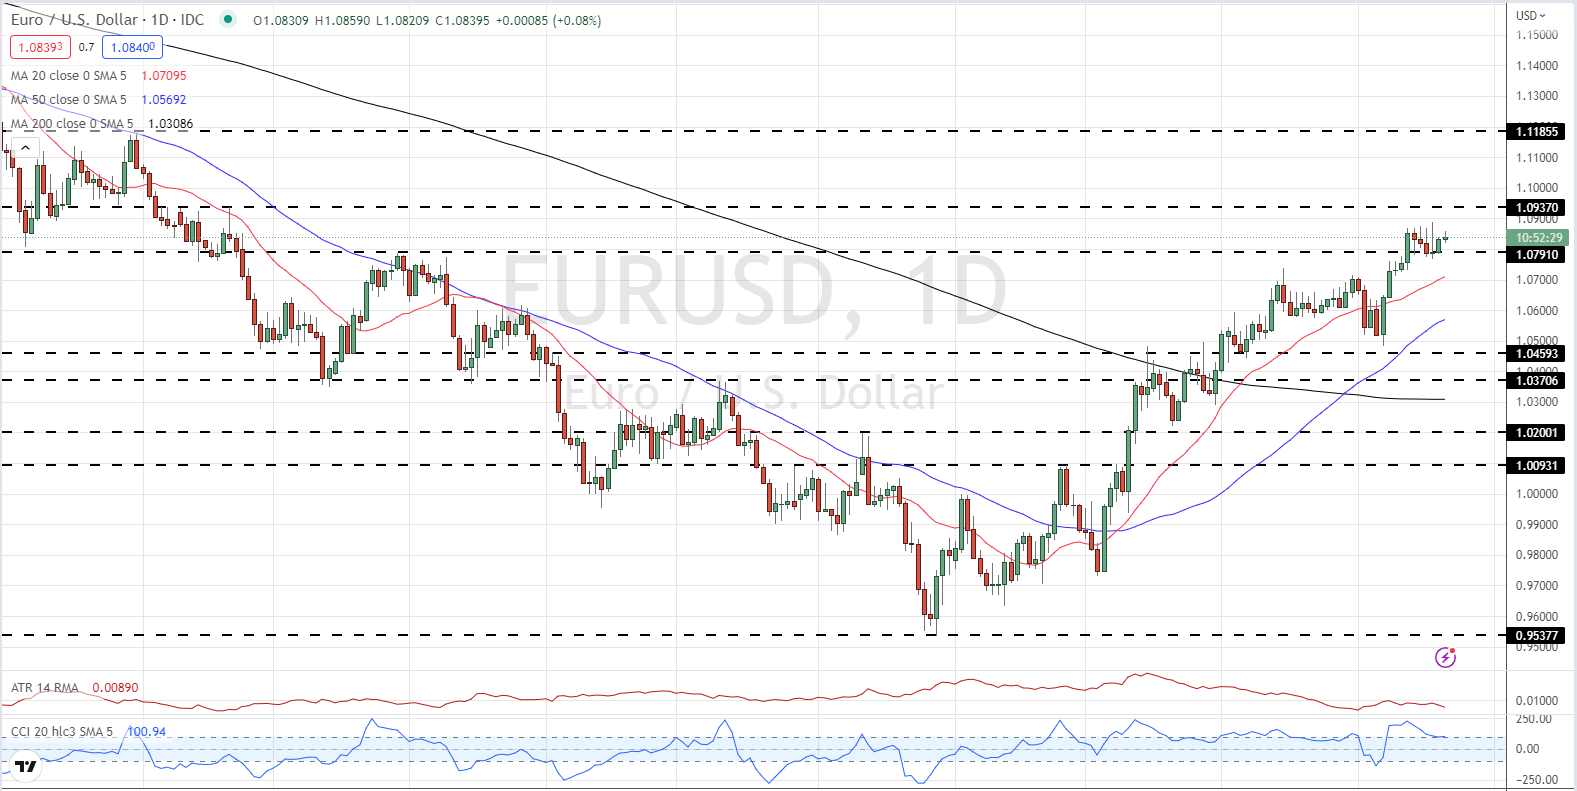
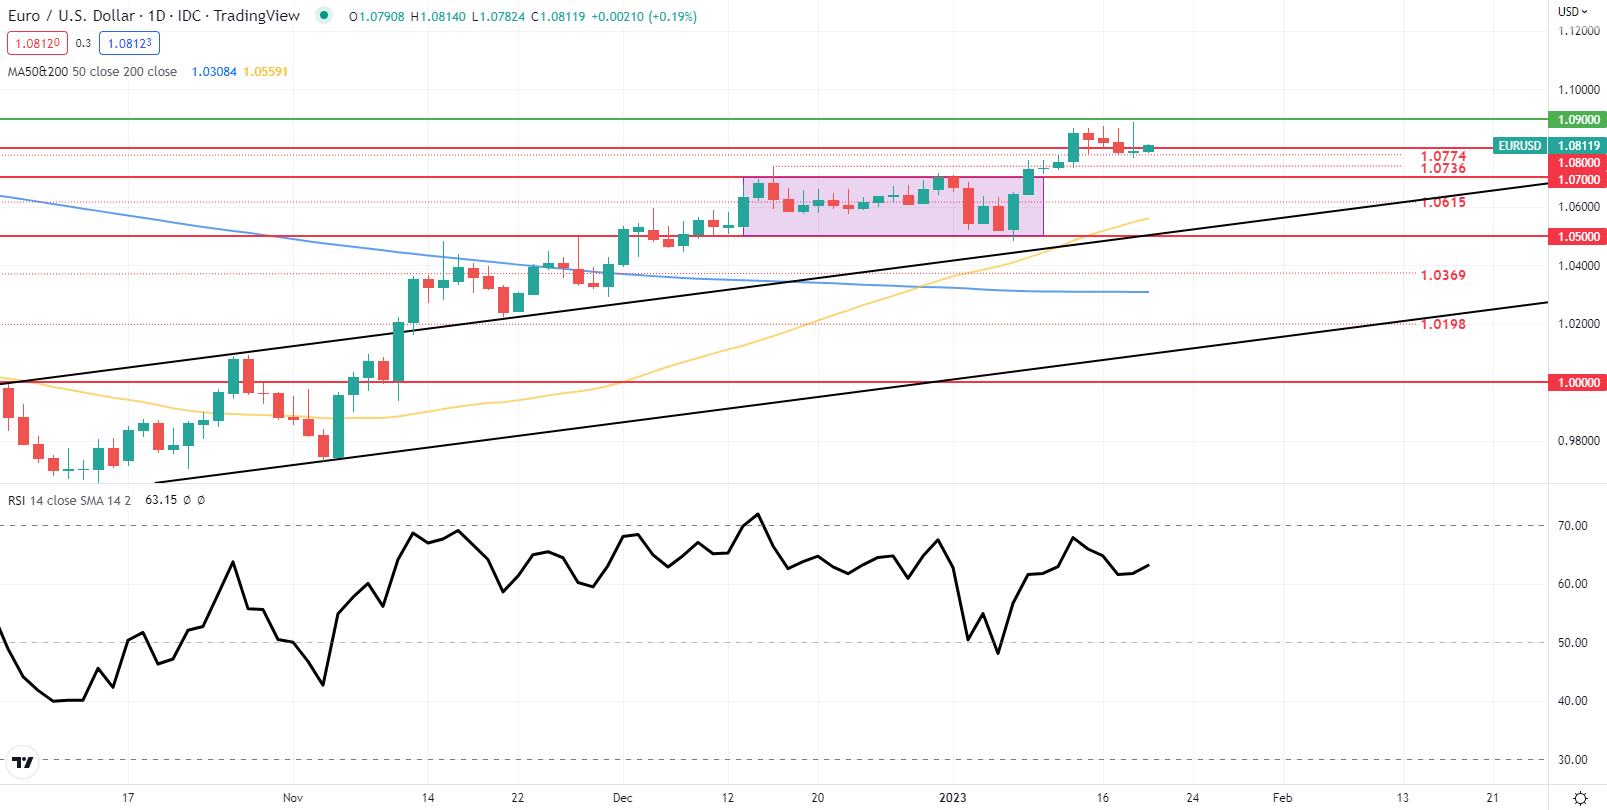
The Euro is currently in a tight, consolidation pattern against the US dollar with short-term support around 1.0770 to 1.0780 looking stronger as each session passes. Above there, an old level of horizontal support around 1.07910 is also visible with the next level of resistance seen at 1.09370. If the pair make a confirmed above this level then there is little in the way of technical resistance ahead of 1.11855. The recent overbought CCI reading is currently being reset lower and this will help underpin the pair in the short term.

EUR/USD Daily Price Chart – January 20, 2023

image2.png

Retail Traders Trim Long Positions

Retail trader data show 37.65% of traders are net-long with the ratio of traders short to long at 1.66 to 1.The number of traders net-long is 9.03% lower than yesterday and 26.51% higher from last week, while the number of traders net-short is 10.46% higher than yesterday and 7.12% lower from last week.

We typically take a contrarian view to crowd sentiment, and the fact traders are net-short suggests EUR/USD prices may continue to rise. Positioning is more net-short than yesterday but less net-short from last week. The combination of current sentiment and recent changes gives us a further mixed EUR/USD trading bias.

Hoping For an Early Fed Pivot Does Not Mean We Will Get One

Hoping For an Early Fed Pivot Does Not Mean We Will Get One

Every economic age has its dominant phrase. Think of the ‘irrational exuberance’ which then-Federal Reserve Chair Alan Greenspan fretted about during the 1990’s dot-com bubble. If that’s too far back for you, what about European Central Bank chief Mario Draghi in 2012 promising skeptical markets that he’d do ‘whatever it takes’ to save the Euro?

The buzzword of this inflation-ravaged era is more succinct. In fact, it’s just one word – ‘pivot.’

For our purposes it means the point at which the United States Federal Reserve will feel it can stop raising interest rates and begin to offer the possibility that they could start to go down.
 

image1.png

It’s easy to see why that word dominates. 2022 brought, among other dark things, interest rate rises unprecedented in the working lives of many people now engaged with financial markets. The US central bank has hit the monetary brakes no fewer than seven times, pushing the benchmark rate up to a target range of 4.25-4.5%. That’s the highest rate in fifteen years. Moreover, while there are clear rhetorical signs that the Fed is now more cautious about raising rates than it was back in the summer, there are equally clear signals that borrowing costs will go higher yet and that it may not top out below 5%.

Given that the Fed Funds rate spent much of the time between 2009 and 2021 barely above zero, the scale of the turnaround has been astonishing.

And given that so many market participants cut their teeth in a long era of docile inflation, cheap money and ever-flowing credit, it’s no wonder that so many should be keen that the Fed does indeed pivot as soon as possible. The thing about Golden Ages is that people always want them back.

But that doesn’t mean they come back. Of course, the key to whether or not the Fed will, in fact, pivot, will be found in the inflation data. And the picture there is still very unclear.

Boosted by a number of factors, from the war in Ukraine through to Covid’s supply-chain havoc and a general rethink of the previously dominant trend toward ever-more globalization, prices surged in 2022 by measures not seen for fully 40 years. The US was not alone in facing this gale, of course. Other countries did so too, and some had it a lot worse. Inflation has run hotter in Europe thanks among other factors to its energy dependence on Russia.

Even Japan has seen a resurgence of pricing power, where inflation has been thought dead for decades.
 

image2.png

But the US still runs the table, and it’s the success of the US response which will matter most. And there are some encouraging signs. The Fed’s preferred measure of inflation continued to slacken in November, providing another indicator that price pressures may indeed have peaked earlier in the year.

The Personal Consumption Expenditures price index, or PCE, rose 5.5% on the year, well below the 6.1% rise seen just a month earlier. The core measure, which cuts out the volatile effects of food and energy costs, was up by a more reassuring 4.7% annualized. Both readings were at their lowest since October 2021.

The release chimes with official Consumer Price Index data for the same month, which showed a similar slackening.

Nevertheless, price rises there still stand at 7.1%, which is a very long way indeed from the 2% rate targeted by the Fed. Moreover, the US central bank’s mandate is to promote stable prices and maximum employment. There may not be many active in the markets today who remember the inflationary pressures of the 1970s and early 1980s. However, there will be many in the Fed who do remember them, and how hard-won the victory was. The monetarist students at the US central bank will be only too aware that they can’t afford to end the rate rising process until inflation – and as importantly, inflation expectations – have been actually and obviously seen to be crushed.

Hence, we see things like stocks falling despite robust Gross Domestic Product numbers. Investors are seeing everything through the inflation prism, and any sign that the Fed’s action has yet to clearly cool economic activity just has investors ever-more convinced that the pivot is not here yet.

5.5% inflation may be better than 6.1%, but it’s still outrunning the Fed’s target by a huge amount, and there’s simply no way policymakers are going to stop fighting while that’s the case. Chair Jerome Powell and the rest of the Open Market Committee well know that their success in getting inflation down will define their time.

Many commentators think we might get very close to pivot territory by the late spring of next year, but in truth we’d probably have to see a marked moderation in wage momentum and, probably, employment growth. Both have remained surprisingly strong despite the Fed’s actions.

Inflation also has a nasty tendency to get sticky. Faced with rising prices, employees demand higher wages, which only add to cost pressures at a time when there’s usually little option but to pass these on again to consumers. And so on…

The upshot of all this is that it could yet be a very long time before the Fed actually does ‘pivot,’ and any prognosis that such a thing could happen in the early part of 2023 depends on evidence of a pretty rapid economic slowdown coming soon. If the economic data don’t start to support this thesis unambiguously in the early months of the year, then the waiting for the pivot could prove a much longer game than many in the markets now hope it’ll be.

GBP/USD Forecast: Dismal December Retail Sales Leads Cable Lower

GBP/USD Forecast: Dismal December Retail Sales Leads Cable Lower

Disappointing December Retail Sales Data

Retail sales volumes have fallen 1% from November, indicating a challenging environment for consumers amid the ongoing cost of living squeeze. The monthly data declined in terms of value spent (value is an indication of price rises) as well as quantity bought. Longer term trends reveal that value spent is considerably higher while volumes purchased decline – which is consistent with the current inflationary environment as consumers spend more for less.

In fact, volumes were 1.7% below February 2020 levels and anecdotal evidence advanced by the report suggests that the decrease in online sales was partly attributed to the Royal Mail strikes as consumers opted for in store shopping instead.


image1.png

Source: Office for National Statistics (ONS), prepared by Richard Snow


GBP/USD Eases into the Weekend after a Period of Steady Appreciation

The GBP/USD weekly chart reveals what appears to be an inverse head and shoulders pattern. The head and shoulders pattern is widely viewed as a major reversal pattern and, should that be the case for cable, it may see the pair climb even higher in the coming weeks/months.

The neckline remains the first hurdle and price action this week has refused a test of the level – heading lower before the weekend.

GBP/USD Weekly Chart


image2.png

Source: TradingView, prepared by Richard Snow


The daily chart reveals more granular price action as the pair retreats from that neckline level, back towards the zone of support around 1.2300. From here, bulls will be looking to find support and a bounce higher into next week – which could be helped if US GDP disappoints. Upon a potential move above the neckline, there is often a propensity for prices to then test the neckline (this time as support) before another leg higher. Thereafter, 1.2676 comes into play as a further resistance level.

Support as mentioned lies at 1.2300, followed by the psychological level of 1.2000 which is a fair distance away from current levels.

GBP/USD Daily Chart


image3.png

Source: TradingView, prepared by Richard Snow

gold

XAU/USD Forecast: Gold Elevated as Markets Continue to Dismiss Fed Guidance

XAU/USD FUNDAMENTAL BACKDROP

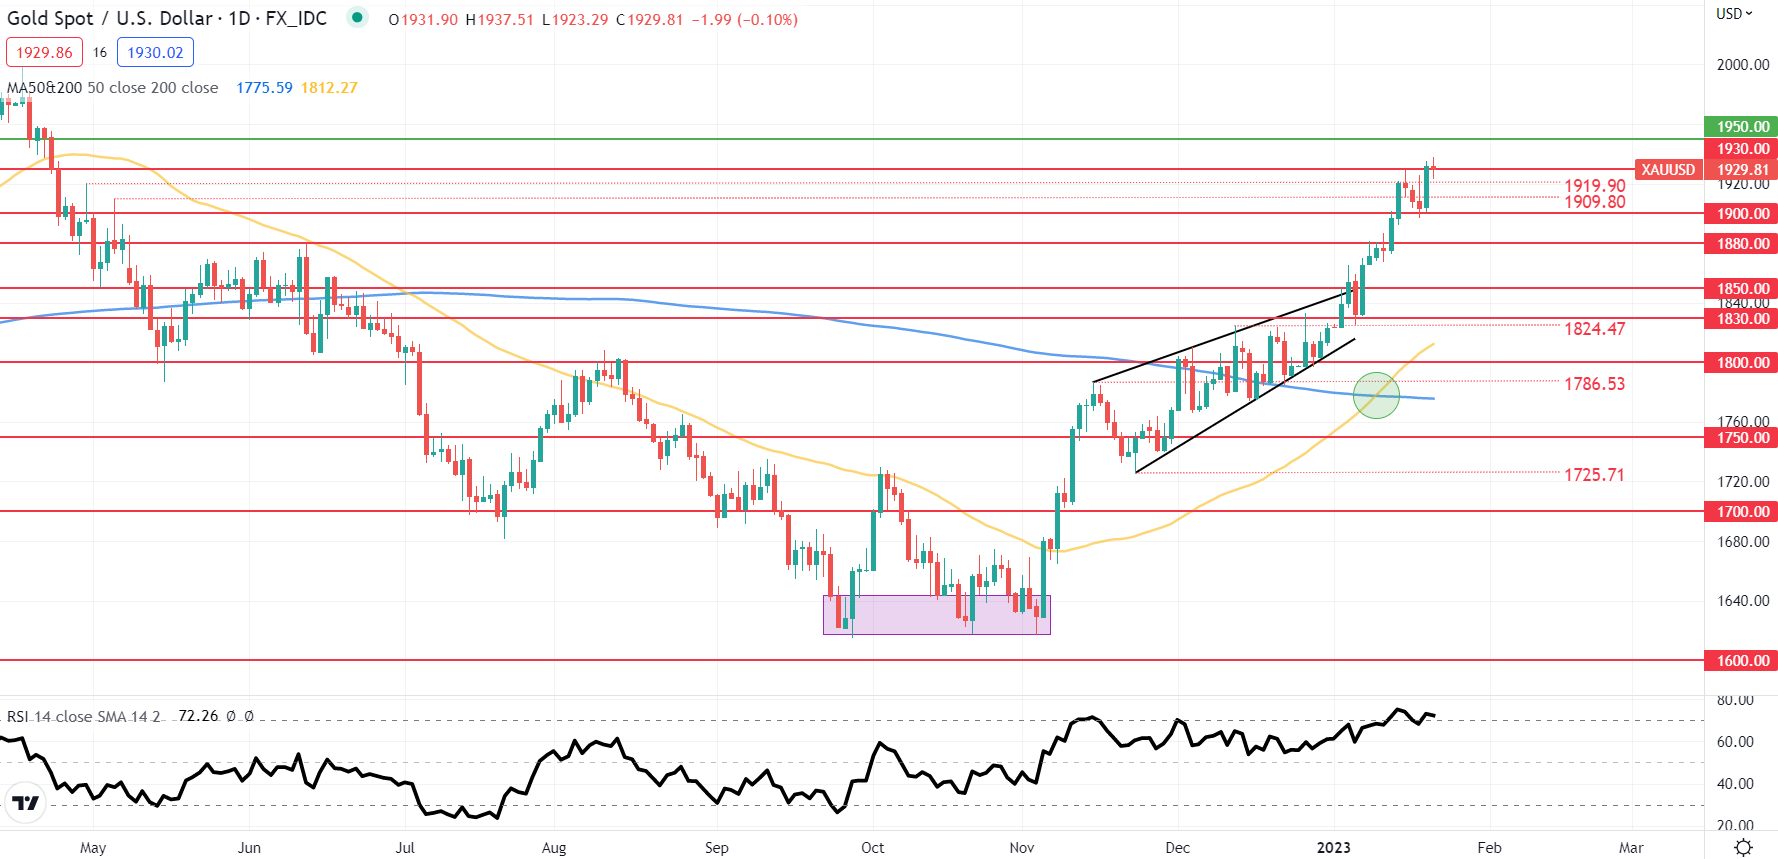
Gold is continuing to press higher challenging levels last seen in April 2022 on the back of weaker U.S. data. These include softer inflation, weaker PMI data and signs of slowing wage pressures. On the contrary, the labor market remains tight keeping hawks relevant and while inflationary pressures are on the decline, the inflation rates (both core and headline) are significantly higher than the Fed’s target rate.

The economic calendar (see below) highlights Fed speakers throughout the trading day and after yesterday’s united front by Fed officials in reiterating the 5% terminal rate in 2023. It will be interesting to see whether today’s speakers follow a similar trend.

ECONOMIC CALENDAR


image1.png

Source: DailyFX Economic Calendar

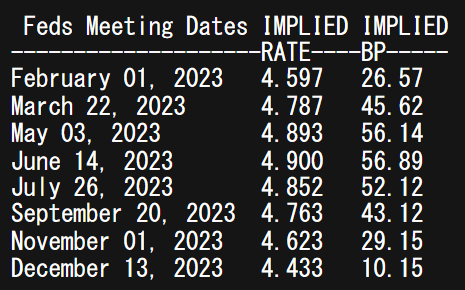
Looking at money market pricing, it is clear that market participants are questioning the Fed’s credibility by forecasting a 4.9% peak rate at present – refer to table below. If the Fed intends to stick to their rhetoric, gold prices could be in for significant downside.

FEDERAL RESERVE INTEREST RATE PROBABILITIES


image2.png

Source: Refinitiv


TECHNICAL ANALYSIS

GOLD PRICE DAILY CHART


image3.png


Chart prepared by Warren Venketas, IG

The daily spot gold chart highlights the immense rally from the end of November last year. The trade may be slightly overcrowded at this point but it seems many traders are ignoring any potential market mispricing. The Relative Strength Index (RSI) is currently hovering around the overbought zone of the oscillator and could suggest impending downside to come. The golden cross (green) could be showing signs of fatigue leaving room for a likely consolidation or a leg lower.

Resistance levels:

  • 1950.00

Support levels:

  • 1930.00
  • 1919.90

IG CLIENT SENTIMENT: BULLISH

IGCS shows retail traders are currently distinctly LONG on gold, with 55% of traders currently holding long positions (as of this writing). At DailyFX we typically take a contrarian view to crowd sentiment however, due to recent changes in long and short positioning we arrive at a short-term upside bias.

Japanese Yen Technical Outlook: What’s Next For USD/JPY After BoJ?

Japanese Yen Technical Outlook: What’s Next For USD/JPY After BoJ?

USD/JPY SHORT-TERM TECHNICAL FORECAST – NEUTRAL

Wednesday’s failure of the Japanese yen to sustain losses against the US dollar could be a reflection of the mood prevailing since the end of 2022.

USD/JPY jumped over 2% after the Bank of Japan stuck with its ultra-easy monetary policy on Wednesday. However, the pair was unable to sustain the intraday gains following disappointing US retail sales data that cemented the view that the US economy is slowing down.

USD/JPY Weekly Chart

image1.png

Importantly, the retracement of the intraday gains shows how strong the downward momentum has been in USD/JPY recently. As the weekly chart shows, the Moving Average Convergence Divergence indicator is at its lowest at least since 2018 – a sign of the extent of bearishness.

USD/JPY 240-minutes Chart

image2.png

Having said that, as the previous update noted, the multi-week slide is losing steam. Put in another way, Wednesday’s jump could be a warning sign that the tide could soon be turning (up) for USD/JPY as it approaches strong support on the 89-week moving average, coinciding with the May 2022 low of 126.30. So far, USD/JPY hasn’t broken any important resistance, beginning with the 89-period moving average on the 240-minutes chart (see chart) – rallies in recent weeks have stalled at the moving average.

USD/JPY Daily Chart

image3.png

Any break above the 89-period moving average on the 240-minute chart, near the upper edge of a declining channel since November, would be an indication that the three-month-long downward pressure is fading. Already, as noted last week, fresh lows in price on the Daily charts haven’t been associated with fresh lows in momentum, suggesting that the slide is losing steam.

New Zealand Dollar Looks Past PM Jacinda Ardern’s Resignation, Eyes on Wobbly Markets

New Zealand Dollar Looks Past PM Jacinda Ardern’s Resignation, Eyes on Wobbly Markets

Asia-Pacific Market Briefing – New Zealand Dollar Looks Past NZ PM Ardern Stepping Down

The New Zealand Dollar was little changed after reports crossed the wires that Jacinda Ardern, New Zealand’s Prime Minister, announced that she would step down by February 7th. She also called for an election on October 14th. While that may introduce some near-term political uncertainty for NZD/USD, the sentiment-linked currency likely remains focused on external matters.

NZD underperformed against its major counterparts on Wednesday. This followed a notable deterioration in risk appetite during the Wall Street trading session. By the end of the day, the Dow Jones, S&P 500 and Nasdaq 100 fell -1.81%, -1.56% and -1.24%, respectively. This is as the VIX market ‘fear gauge’ rose about 5%.

This followed a slew of disappointing US economic data. Retail sales clocked in at -1.1% m/m in December, worse than the -0.9% consensus. Meanwhile, PPI final demand printed 6.2% y/y for the same month. That was much lower than the 6.8% estimate. This continued to show signs of a cooling economy and placed the focus on the Federal Reserve.

The 2-year Treasury yield sank to 4.09%, the lowest close since September 2022. Markets continued pricing away Fed rate hikes for this year. Now, Fed Funds Futures indicate that traders anticipate only 32 basis points in tightening this year. That means one more hike at the next meeting with the odds of a second rapidly diminishing.

Instead of traders looking forward to a dovish pivot, price action over the past 24 hours indicated that the greater fear was of a more pronounced economic slowdown that would indicate more trouble ahead. Stocks fell, traders bought up bonds which brought down yields and the risk-linked New Zealand Dollar took a drip.

This is leaving NZD/USD vulnerable to more downside heading into Thursday’s Asia-Pacific trading session. The sour tone set by Wall Street might make its way into regional bourses, pressuring indices like the Nikkei 225, ASX 200 and Hang Seng Index. Haven seeking would open the door for the US Dollar to potentially pull ahead.

New Zealand Dollar Technical Analysis

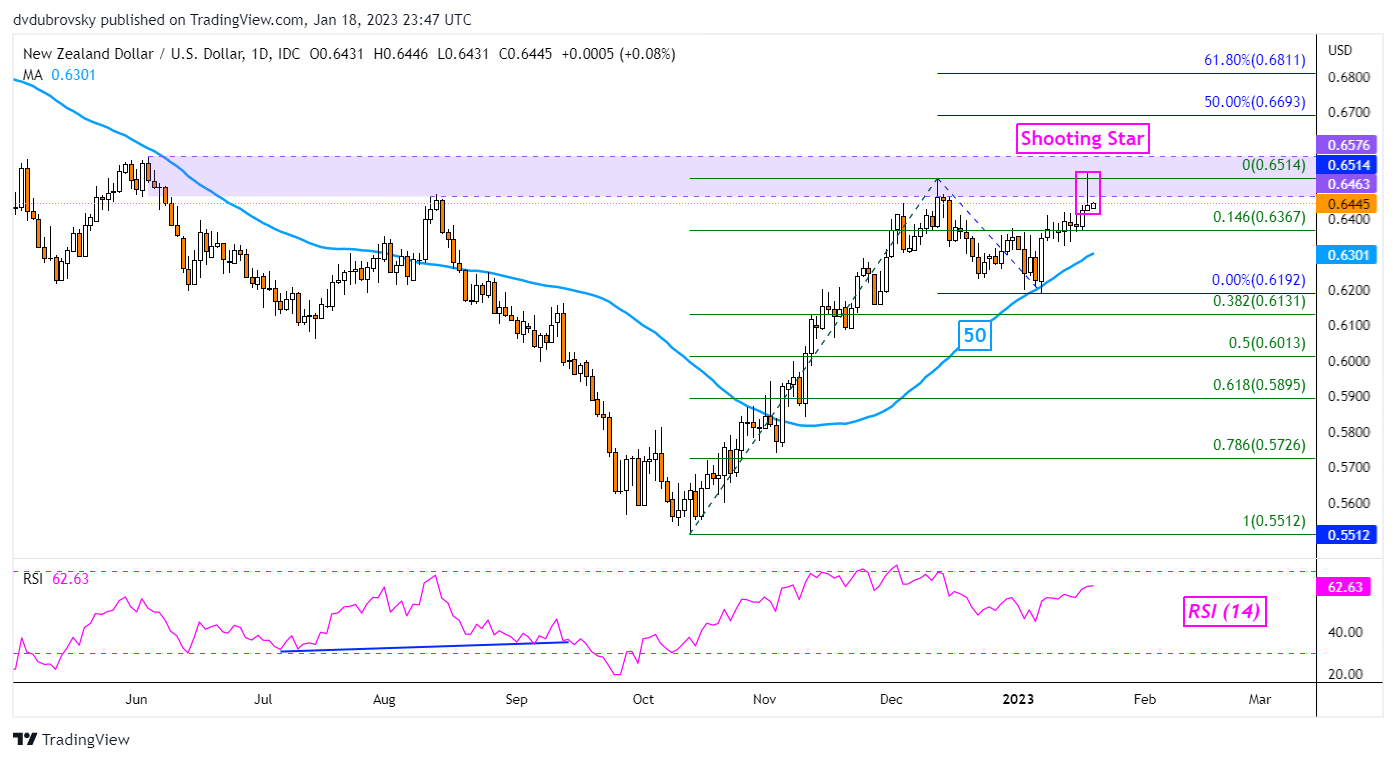
On the daily chart, NZD/USD has left behind a Shooting Star candlestick pattern. This is a sign of indecision as prices tried to push into the 0.6463 – 0.6576 resistance zone. While this doesn’t mean that a turn lower is in the cards, downside follow-through could open the door to a reversal. But, keep a close eye on the 50-day Simple Moving Average (SMA). It could hold as support, pivoting prices higher.

NZD/USD Daily Chart

NZD/USD Daily Chart


Australian Dollar Dipped After Slight Miss on Jobs Data. Where to for AUD/USD?

Australian Dollar Dipped After Slight Miss on Jobs Data. Where to for AUD/USD?

The Australian Dollar had a look lower after the unemployment rate came in at 3.5% for December against 3.4% previously and forecast.

There were -14.6k fewer jobs which were below the 25k forecast to be added and 58k prior.

Although a small miss, the unemployment rate continues to linger near multi-generational lows. Today’s numbers show that the labour market remains robust despite the Reserve Bank of Australia lifting the cash rate 3% from the pandemic emergency low.

The bank has stepped back large rate hikes and the futures market has a 50-50 chance of a 25 basis-point hike priced in for their February 7th monetary policy meeting.

Ahead of that meeting, the crucial fourth quarter CPI print will be released on Wednesday next week the 25th of January. The RBA has said that they expect it to rise to 8% later this year and if the price pressures move toward there sooner than they anticipate.

This would present a conundrum for the RBA and the projected rate path. Across the Pacific, the Federal Reserve continues to make it clear that it is going to continue tightening.

This became apparent overnight when US retail sales and PPI data were weaker than anticipated. The US Dollar initially softened and sent AUD/USD to a six-month peak at 0.7063.

Then several Fed speakers reiterated their hawkish stance and the ‘big dollar’ rallied across the board and the Aussie Dollar collapsed in the process. They mostly cited a 25 bp rise in rates as being appropriate rather than larger ones.

The Fed also has its Federal Open Market Committee (FOMC) meeting to decide on monetary policy and the market is expecting a 25 bp hike there on the 1st of February. The post-meeting commentary will be closely scrutinised for hints on rates going forward.

The next few weeks might be vital for AUD/USD and could see some clues for direction into 2023.

EUR/USD Forecast: Upcoming ECB Minutes to Augment Hawkish Bets?

EUR/USD Forecast: Upcoming ECB Minutes to Augment Hawkish Bets?

EURO FUNDAMENTAL BACKDROP

The euro has been receiving fundamental boosts from the both the U.S. and eurozone . Beginning with the EZ region, stickier inflation readings, lower energy costs and a hawkish central bank have all provided sustenance for the EUR. The European Central Bank (ECB) although late to the party in terms if their interest rate hiking cycle (relative to other major central banks) has been extremely aggressive in their stance of recent. Yesterday, the ECB’s Villeroy strongly defended President Christine Lagarde’s forward guidance in favor of a 50bps rate hike in the next meeting while this morning began with another ECB official (Klaas Knot) upholding the aggressive rhetoric by stating that “the ECB are planning to hike by 50bps multiple times.”

Later today, the President Lagarde is scheduled to speak at Davos (0930GMT) after which the ECB’s minutes (see economic calendar below) will take center stage. Both are expected to deliver the same hawkish message which could see the euro bid against the dollar.

From a USD point of view, concerns over U.S. economic growth by way of the recent misses on U.S. PPI and retail sales has cast a shadow over the greenback and has almost locked in a 25bps increment for the Fed’s next meeting in February. Hawkish Fed speakers are being largely dismissed by markets at this point which should follow the same path today with the Fed’s Collins, Brainard and Williams on the docket. U.S. building permits data are expected to push higher in December coming off extreme lows in November which may dampen dollar upside should actual data fall in line with estimates.

EUR/USD ECONOMIC CALENDAR

image1.png

EUR/USD DAILY CHART

image2.png

Daily EUR/USD price action shows a recent sideways consolidation appearing; however, yesterdays long upper wick could lead to subsequent downside – fundamentals would have to permit such a move. The euro has made a swift comeback reaching levels last seen in April of 2022 in roughly 3.5 months which may be why bulls are so wary to drive the market higher. The Relative Strength Index (RSI) echoes this sentiment with upside momentum showing signs of slowing (bearish/negative divergence). A slight dovish take on either the ECB Presidents address or the ECB’s minutes could spark a move lower.

Resistance levels:

  • 1.0900

Support levels:

  • 1.0800
  • 1.0774
  • 1.0736

BEARISH IG CLIENT SENTIMENT

IGCS shows retail traders are currently SHORT on EUR/USD, with 58% of traders currently holding short positions (as of this writing). At DailyFX we typically take a contrarian view to crowd sentiment; however, due to recent changes in long and short positioning, we arrive at a short-term bullish bias.


The US Dollar Bounces Back as Recession Fears Swirl. Where to for USD?

The US Dollar Bounces Back as Recession Fears Swirl. Where to for USD?

The US Dollar recovered from an eight-month low after soft data painted a concerning picture followed by several Federal Reserve talking tough on further rate hikes.

US retail sales for December were -1.1% month-on-month instead of the -0.9% anticipated and -0.6% prior. PPI for the same period was -0.5%, notably lower than the 0.1% forecast and 0.3% previously.

The numbers triggered fears of a recession and Wall Street finished the cash session lower with the major indices down well over a percent. Microsoft and Amazon announcing job cuts to their workforce didn’t help the mood.

Then a cavalcade of Fed speakers reminded markets of the impending rate hikes. Some pointed to 25 basis points (bp) being the most appropriate steps while St Louis Fed President James Bullard put the case forward to tighten more aggressively.

This pushed equities lower but assisted the US Dollar. The 2s 10s Treasury curve inverted another 5bp toward -0.70% on a bull flattening.

The Japanese Yen firmed today after the trade deficit for December was ¥ -1.448 billion, better than the estimates of ¥ -1.670 billion. The easing of energy prices and the impacts of an overall weaker Yen might be contributing to a better outcome for the archipelago nation.

The Bank of Japan also announced a technical tweak to its yield curve control (YCC) program that some commentators have equated to a slight easing in policy.

After making a six-month high in the New York session, the Australian Dollar stumbled on jobs data disappointment. The unemployment rate came in at 3.5% for December rather than the 3.4% anticipated and previously. Employment fell 14.k when forecasts were for 25k to be added.

Australian Commonwealth Government Bonds (ACGB) joined long-end Treasuries yields lower with the 10-year, collapsing around 30 bp. It is trading near 3.30% against 4.1% at the end of last month.

The New Zealand Dollar also slid lower after Prime Minister Jacinta Ardern announced her resignation on February 7th. She said that she ‘did not have enough in the tank’ to continue in the role.

Crude oil is under pressure with the WTI futures contract under US$ 79 bbl while Brent has traded below US$ 84 bbl today. Gold has found some shine as it approached US$ 1,910 an ounce.

Looking ahead, ECB President Christine Lagarde will be speaking from Davos and some Fed speakers will also be crossing the wires. Later on, the US will see data on housing starts, building permits and initial jobless claims.

The full economic calendar can be viewed here.

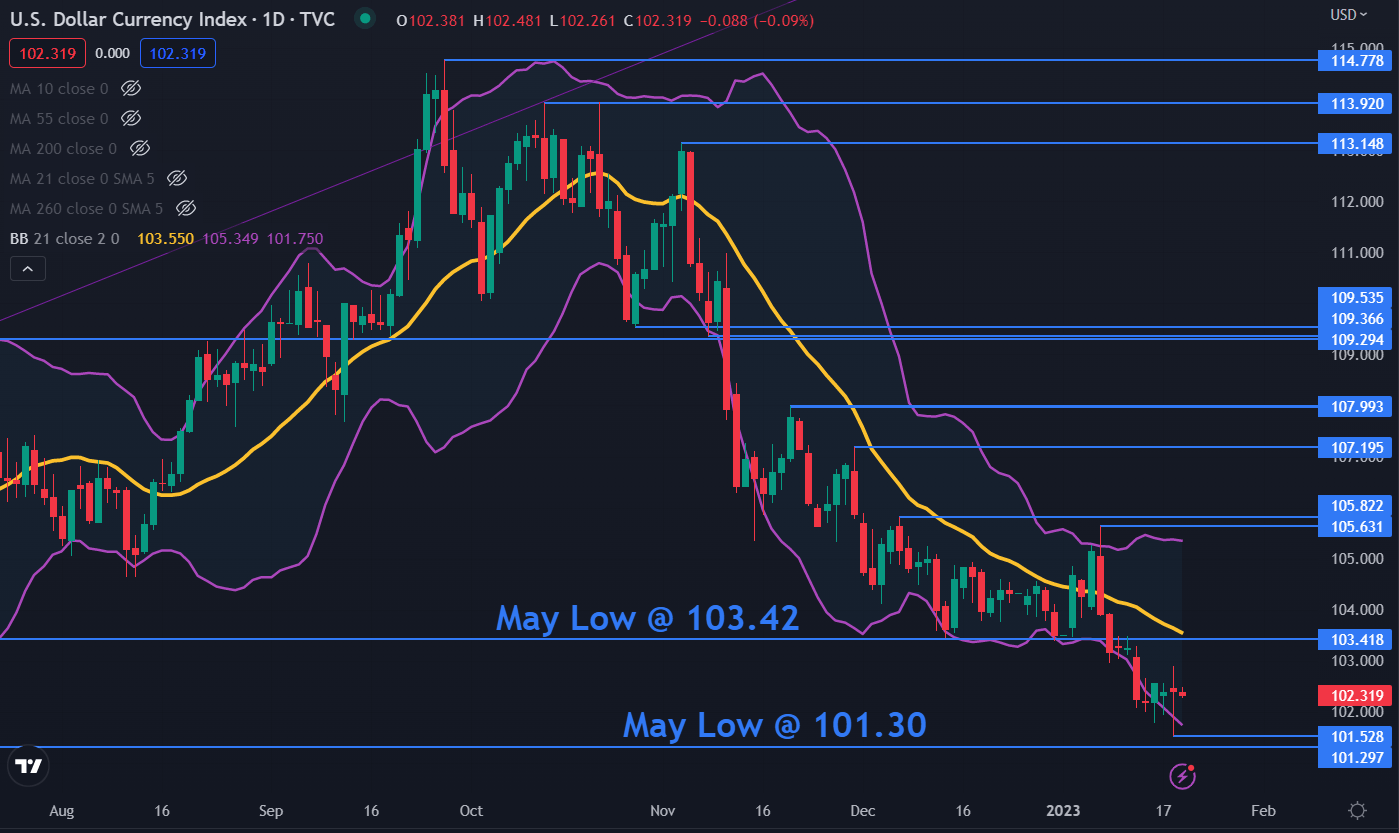
DXY (USD) INDEX TECHNICAL ANALYSIS

The DXY index made a low of 101.53 yesterday, just above the May low of 101.30. These levels may provide support.

The recent sell-off broke below the lower band of the 21-day simple moving average (SMA) based Bollinger Band. The close back inside the band might signal a pause in the bearish run or a potential reversal.

On the topside, resistance could be at the breakpoint of 103.42 or the prior peaks of 105.63 and 105.82.

image1.png