Graphical user interface, text, application  Description automatically generated

Bitcoin (BTC/USD) Drops 13% as Binance Back Out of FTX Acquisition

Bitcoin (BTC/USD) Fundamental Outlook

The cryptocurrency space as a whole has experienced a tumultuous couple of days kicked off by fears around liquidity and solvency at FTX, one of the largest players in the space. The resulting impact has seen Bitcoin and a host of altcoins post significant losses as more information came to light including a letter of intent by Binance to acquire FTX. Bitcoin dropped as low as $15650 (November 2020 price) before rallying in Asian trade back above the $16000 handle. The largest crypto by market cap currently trades around the $16400.

Rumors began filtering through early Wednesday that Binance were reluctant to go through with the rescue deal given the size of the hole in the books of FTX. Late on Wednesday afternoon Binance confirmed in a statement that it would not be proceeding with the deal due to corporate due diligence, news reports regarding the alleged mishandling of client funds and alleged US agency investigations.

Graphical user interface, text, application  Description automatically generated

According to reports FTX CEO Sam Bankman-Fried told investors in a call on Wednesday that the crypto exchange faced a shortfall of up to $8 billion dollars with $4 billion needed to remain solvent. The embattled CEO is attempting to raise further financing in the form of equity or debt as the potential of a bankruptcy filing looms. Risk assets and market sentiment suffered due to the FTX rescue deal falling through as concerns grew regarding the potential knock-on effect to other assets.

BTC/USD Daily Chart – November 10, 2022

Chart, line chart  Description automatically generated

From a technical perspective, BTC/USD had been rangebound since June trading between the $18000 and $25000 levels. The moving averages are all beginning to point to the downside which doesn’t bode well for the pair with the next key support area resting down at $12300.

Given the momentum behind the decline should the pair push higher toward the $18000 level sellers could reignite their interest with $12300 becoming a realistic target.

Whether you are a new or experienced trader, we have several resources available to help you; indicators for tracking trader sentiment, quarterly trading forecasts, analytical and educational webinars held daily, trading guides to help you improve trading performance, and one specifically for those who are new to forex.

image1.png

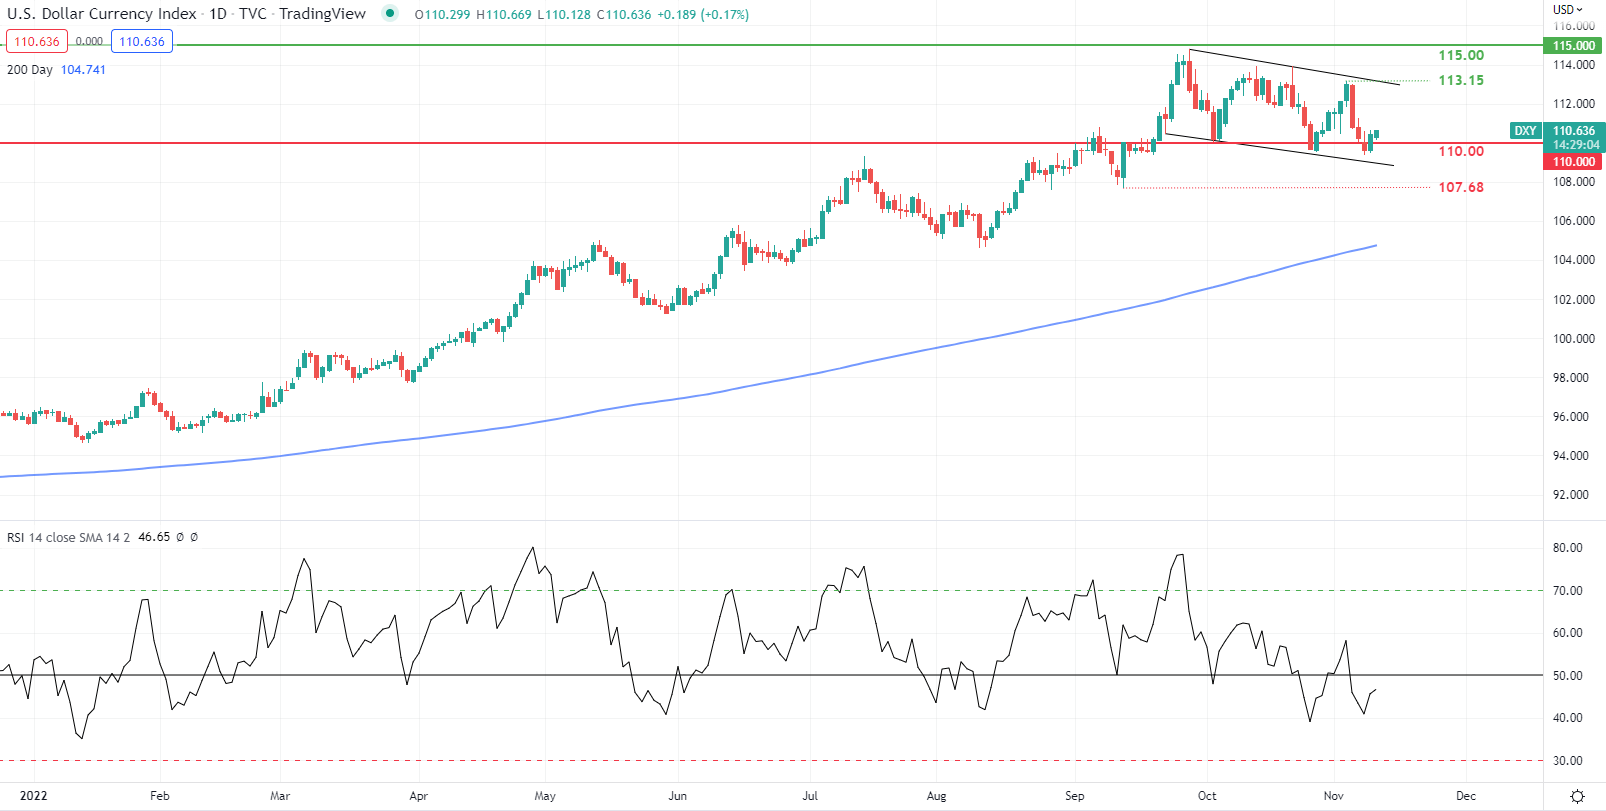
USD Forecast: DXY Prepares for U.S. CPI, 110 Support Handle in Focus

USD FUNDAMENTAL BACKDROP

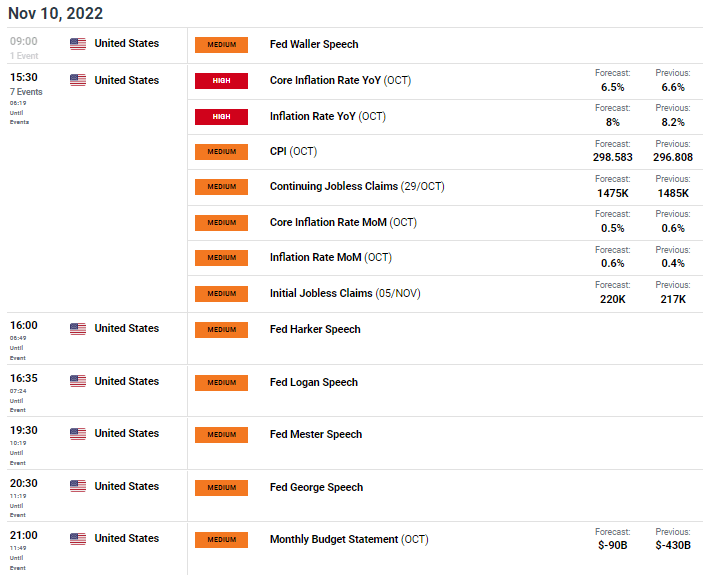
The Dollar Index (DXY) has been relatively subdued thus far this week as markets prepare for U.S. inflation later today. While the ongoing midterm elections were thought to provide a ‘red’ sweep by Republicans, this has not been the case up until now however, the House looks likely to be controlled by the Republicans which may limit President Joe Bidens and the Democrats future proposals. The expected dominance by Republicans had the dollar trading marginally softer leading up to the elections but the key metric for markets this week is the CPI print (see economic calendar below).

ECONOMIC CALENDAR

image1.png

Source: DailyFX economic calendar

Both headline and core inflation which excludes food and energy (the Fed’s preferred measure) are projected lower yet still elevated should the actual figure match estimates. Anything higher than 8% and 6.5% respectively could end the recent USD downtrend, maintaining hawkish bets for the Fed.

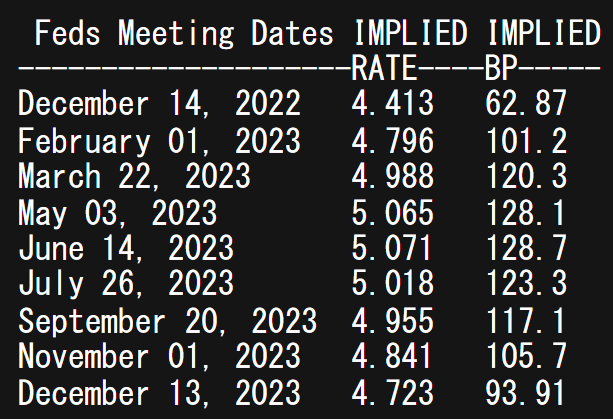
Peak rates for the Fed in 2023 has come down since last week’s FOMC meet, closer to the 5% level from 5.1%.

FEDERAL RESERVE INTEREST RATE PROBABILITIES

image2.png

After U.S. CPI, the calendar is riddled with a slew of Fed speakers who will likely react in accordance with the inflation read.

TECHNICAL ANALYSIS

U.S. DOLLAR INDEX DAILY CHART

image3.png

image1.png

Euro Breaking News: ECB Economic Bulletin Reiterates Economic Woes

Mixed to Lower Global GDP Growth Anticipated

Despite an easing in supply chains shortages, the global economy is expected to deteriorate as a whole and is expected to continue in the near-term. A decline in activity in China as a result of its zero-COVID policy, the negative effects of Russia’s invasion of Ukraine and a modest contraction in the US has hampered global GDP (excluding the euro area).

Inflationary Pressures Remain Too High

OECD measures of inflation (excluding Turkey) showed a relatively stable 7.9% in August but core inflation (excluding volatile price items like food and energy) increased to 5.3% and remains elevated in contrast with headline measures which are declining as energy prices have eased. While lower energy prices are welcomed, it also points to a rather grim economic outlook as lower economic activity leads to lower demand for energy commodities and lower output gong forward. High inflation continues to dampen spending and production by reducing purchasing power and pushing up costs for firms

Financial Market Developments

Over the review period, euro assets remained volatile as market participants revised expectations of higher policy rates as evidenced by higher sovereign bind yields in the euro area. Since then yields have declined somewhat, as the economic risks of aggressive tightening begin to stack up and systemic risk arising from the UK have been largely isolated after reactive measures from the Bank of England and UK government policy reversals.
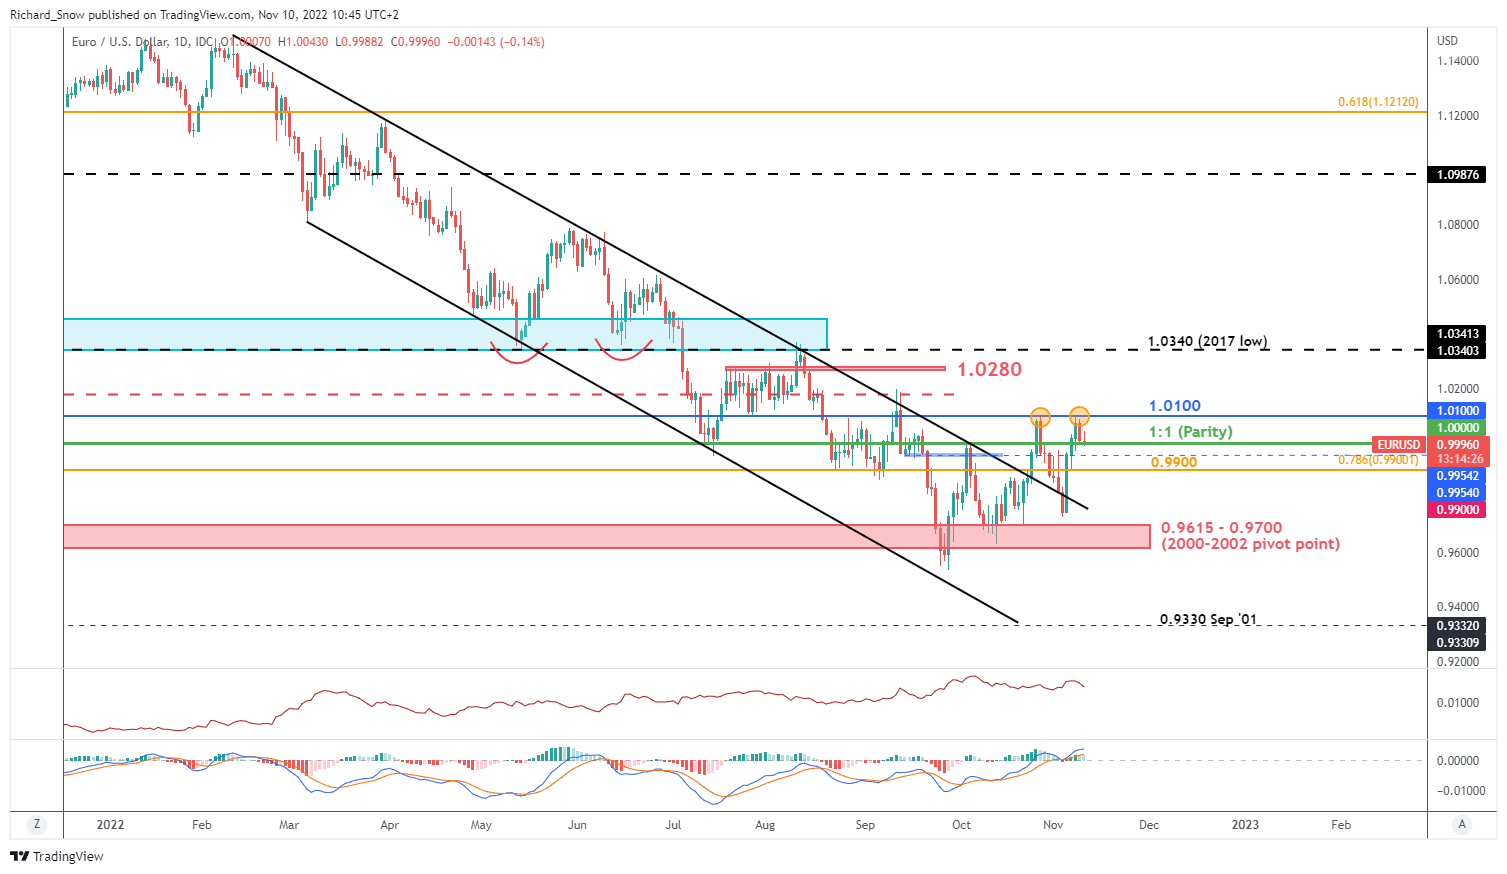
The daily chart shows EUR/USD struggling to break above parity with continued momentum, reversing at 1.1000 twice now. Today’s US CPI print is likely to influence EUR/USD direction in the event of a positive of negative surprise. A print in line with expectation is likely to leave the pair largely unchanged.

Markets are currently pricing in 56 basis points for the December ECB meeting. On the economic calendar this week we have the crucial US CPI report for October which has proven in the past to be a significant driver for the EUR/USD forex pair, particularly now after we have seen another test of parity after multiple rejections. Higher than expected inflation is likely to drive the pair lower while an undershoot could support the recent dollar decline as markets factor in the possibility of slower US rate hikes.

image1.png

UK house prices fall as rising mortgage rates temper property market

LONDON – British house prices fell for the first time in 28 months in October and rising mortgage costs threatened to put further pressure on the property market, a survey showed on Thursday.

The Royal Institution of Chartered Surveyors (RICS) house price balance, which measures the difference between the percentage of surveyors reporting price rises and those seeing a fall, tumbled to -2 in October from +30 in September.

October’s figure was the first negative number following 28 positive monthly readings, indicating that national house price growth was “grinding to a halt”, RICS said.

A measure of expectations for house prices in 12 months’ time slumped to -42 from -18.

The survey showed enquiries from new buyers fell for the sixth month running and buyer demand was negative across the country for the second month in a row.

Mortgage rates have surged in recent months, gathering speed after former prime minister Liz Truss’s “mini-budget” roiled financial markets. Banks briefly withdrew hundreds of mortgage products.

“The latest feedback to the RICS survey provides further evidence of buyer caution in the face of the sharp rise in mortgage costs,” Simon Rubinsohn, chief economist at RICS, said.

“As a result, the volume of activity is likely to slip back over the coming months and realistic pricing is now much more important to complete a sale,” he added.

While economists expect that a recent settling down in financial markets could provide some relief, it might be premature to assume lending rates will fall, Rubinsohn added.

The average time to complete home sales increased to almost 18 weeks, up from around 16 weeks a year ago.

The lettings market picked up in October as tenant demand rose with more people looking to rent. But tenants face additional concerns: survey respondents expected rents to rise by around 4% in the coming 12 months.

A separate survey published on Thursday showed consumer confidence – which is closely linked to the health of the housing market – fell for the third month in a row in October.

Confidence fell by 3.0 points to 94.7, the lowest since April 2020, early in the coronavirus pandemic, and the fourth-lowest score since records started a decade ago, polling firm YouGov and the Centre for Economics and Business Research said.

USD/CAD Climbs Back Above 50-Day SMA Ahead of US CPI

USD/CAD Climbs Back Above 50-Day SMA Ahead of US CPI

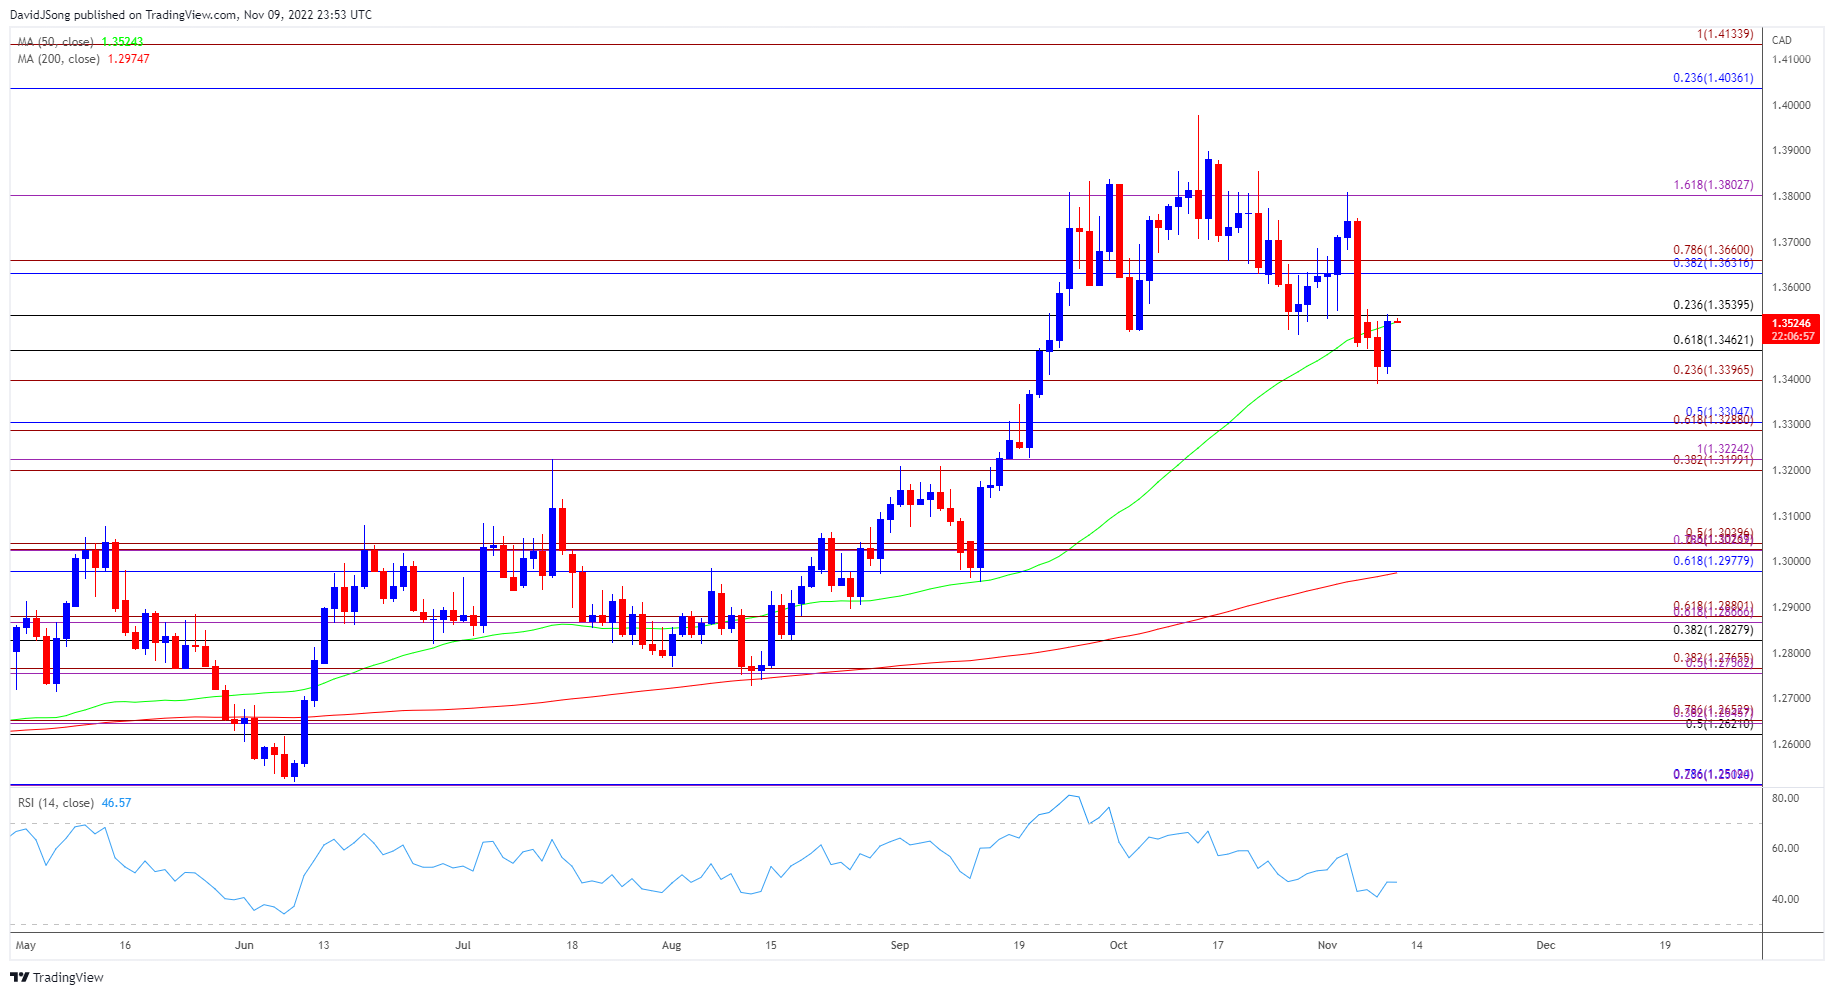
USD/CAD failed to defend the October low (1.3496) as Canada’s Employment report showed the economy adding 108.3K jobs in October, and the exchange rate may face a further pullback ahead of the next Bank of Canada (BoC) meeting on December 7 as the development puts pressure on Governor Tiff Macklem and Co. to carry the hiking-cycle into 2023.

At the same time, data prints coming out of the US may drag on USD/CAD as the both the headline and core CPI are expected to downtick in October, and signs of easing price growth may push the Federal Reserve to adjust its approach in combating inflation as the central bank tries to achieve a soft-landing for the economy.

As a result, USD/CAD may no longer respond to the positive slope in the 50-Day SMA (1.3524) as it trades below the moving average for the first time since August, but a stronger-than-expected CPI report may fuel the rebound from the monthly low (1.3387) as puts pressure on the Federal Open Market Committee (FOMC) it implement another 75bp rate hike at its last meeting for 2022.

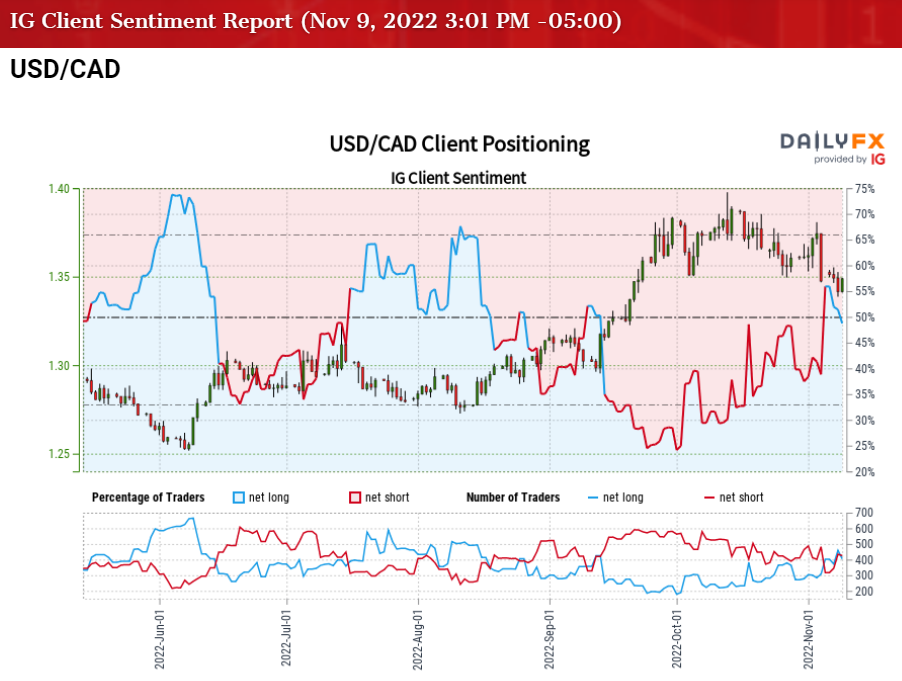
In turn, USD/CAD may continue to retrace the decline from the monthly high (1.3808) as trades back above the moving average, and a further advance in the exchange rate may fuel the recent flip in retail sentiment like the behavior seen earlier this year.

The IG Client Sentiment (IGCS) report shows 44.61% of traders are currently net-long USD/CAD, with the ratio of traders short to long standing at 1.24 to 1.

The number of traders net-long is 14.22% lower than yesterday and 16.09% higher from last week, while the number of traders net-short is 5.54% higher than yesterday and 8.04% higher from last week. The rise in net-long interest has helped to alleviate the crowding behavior as 35.70% of traders were net-long USD/CAD last week, while the rise in net-short position comes as the exchange rate rebounds from a fresh monthly low (1.3387).

With that said, the update to the US CPI may undermine the recent rebound in USD/CAD should the data print boost bets for a smaller Fed rate hike in December, but the exchange rate may track the positive slope in the 50-Day SMA (1.3524) as it trades back above the moving average.

USD/CAD Rate Daily Chart


oil chart

Crude Oil Price Forecast: China Virus Curbs Weigh on WTI, but Chart Shows Chance for Breakout

Crude oil prices are little changed in Asia-Pacific trading after falling more than 3% throughout European and US trading hours. The commodity’s demand outlook is suffering from an increase in Covid cases across China, which has forced Chinese officials to ramp up containment measures. Those virus curbs reduce economic output, thus leading to lower oil consumption.

The city of Guangzhou, a manufacturing hub in Southern China, increased restrictions on Wednesday as transmission surged despite earlier measures to stop the spread. More than half of the city’s eleven districts are under some form of lockdown, and may increase over the coming days. The city reported over 2,500 cases on Wednesday. Chongqing, a city of around 30 million, moved to tighten measures on Thursday morning in two districts.

A surprise crude oil inventory build in the United States added to the selling. The US Energy Information Administration (EIA) reported a 3.9 million barrel build for the week ending November 4. That was well above the 1.36 million barrel consensus forecast. Gasoline and distillate fuel inventories fell, although not as much as expected. And the production of those fuels increased to average 9.8 million barrels per day for gasoline and 5.2 million barrels per day for distillate fuel.

The WTI crude oil prompt spread—the difference between the current and next month’s contract prices—fell to 0.80 on Thursday, down from 1.23 at the start of November. A falling prompt spread is generally seen as a bearish sign for prices. On Wednesday, the Port Arthur, Texas, refinery started to bring its distillation unit back online after a maintenance period, according to a Reuters report. The refinery, operated by Motiva Enterprises, is the largest in the United States, capable of producing over 600k barrels of fuel per day.

WTI Crude Oil Technical Outlook

Prices fell earlier this week from the 100-day Simple Moving Average (SMA) to trade around the 86 handle. A series of higher lows since late September has carved out an Ascending Triangle pattern, with the two reaction highs from early October and this week serving as resistance. If prices rebound and pierce above the 100-day SMA, a breakout is on the cards.

WTI Crude Oil Daily Chart

oil chart


.

FX Update: US Dollar volatility to continue

The USD has been rangebound lately, even with a hawkish Fed. Markets are interpreting any “softer” data in favor of a Fed pivot, sending EURUSD up. However, a high CPI print tomorrow may send EURUSD down while the dust around US election settles.

In the last month, EURUSD has trended higher trading in the range 0.97-1.01 as investors have shifted their focus towards the end of the Fed’s aggressive hiking cycle. Sentiment has also lifted EURUSD with the prospect of a divided US Congress while the expected Republican Red sweep seems not to have materialized, and a rumored Chinese reopening brightening the gloomy global growth outlook.

Chart 1: EURUSD has been rangebound lately

Admittedly, the latest upward swing EURUSD is in contrast to our view for a stronger USD ahead, but we think recent price action is a reflection of tactical positioning rather than a change of fundamentals. If anything, the reopening of China – when it eventually comes – will complicate the inflation picture by putting new upwards pressure on commodity prices, in particular energy. Moreover, who is in charge of Congress is a topic that will wane. The topic that will not wane any time soon is the Fed’s fight against inflation. The Fed has said clearly that a pause of its rate hikes is off the table so long as inflation is high. The fight against inflation means higher rates and more pain for risk assets and the real economy. It seems that stock markets investors refuse to get the memo and are interpreting any “softer” data in favor of a Fed pivot, leading to risk on and a weaker USD. Eventually the tide should turn and investors will again feel the pain and remember the old adage: “don’t fight the Fed.”

Looking ahead, EURUSD will likely continue to have a bumpy ride but we still hold our view for a lower EURUSD towards the end of this year (around 0.95). What we are seeing now is that investors are becoming more divided when interpretating economic data and implications for monetary policy. Confirmation bias surrounding the incoming data makes some certain of a Fed pivot even if the data shows otherwise. Several central banks slowing the pace of hikes has led to a belief that rate cuts are not far away either. Some are emphasizing the risks of overtightening, however, the Fed sees a risk of not tightening enough or pausing too early to bring inflation under control.

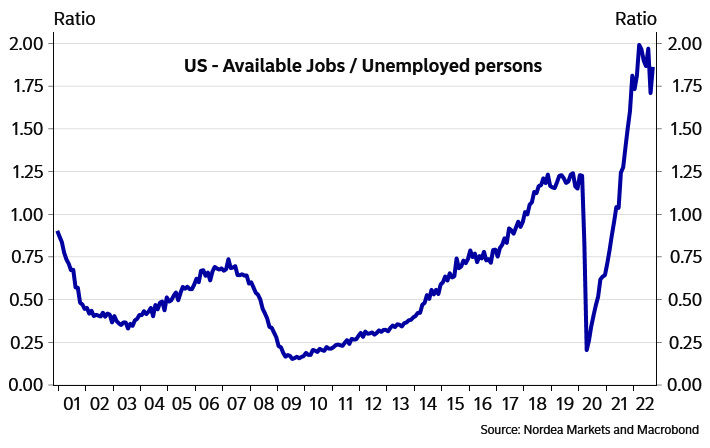
Ahead of the December FOMC, the decisive data will be the two inflation reports and two job-market reports. Looking at the latest US economic data we see little suggesting that a pause of rate hikes is in sight. On the contrary – as Chair Powell alluded to – strong economic data warrants more tightening ahead than expected at the September FOMC meeting. We have already had the first Nonfarm Payrolls report out last Friday, which was stronger than expected with a creation of some 575.000 new jobs over the last two months. Labour market participation fell slightly to 62.2%, below 63.4% before the pandemic. More worrying, monthly wage growth accelerated to 0.4% from 0.3%. All of this points to a tighter labour market and wage growth that is way too high for inflation to come back to 2%. Some have focused on the fact that the US unemployment rate rose to 3.7% from 3.5% and year-over-year wage growth fell to 4.7% from 5%. The Fed will likely trust the nonfarm payroll ‘establishment’ data compared to the unemployment data which is a result of a household survey. Moreover, year-over-year wage growth is no longer the thing to look at due to base effects kicking in. In sum, if you think the US labour market and wage growth are softening, then look over the data again.

Chart 2: US labour market remains tight

.

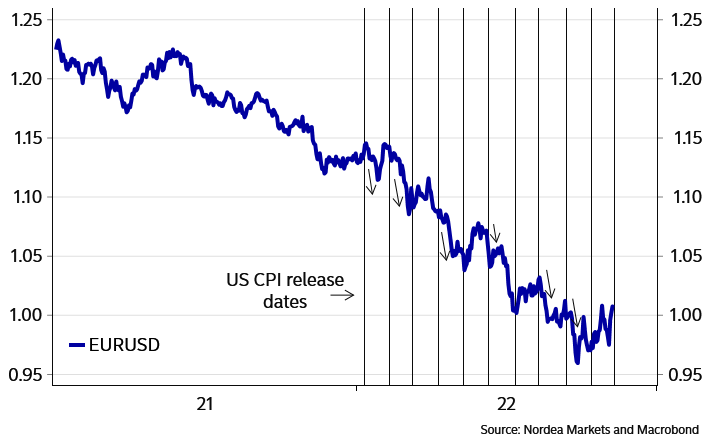
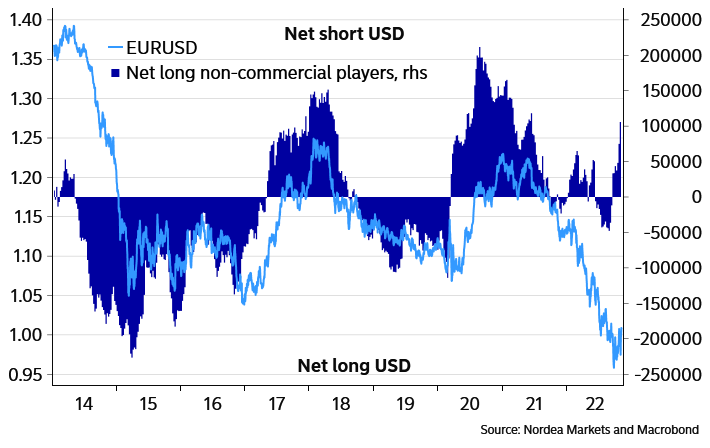
Tomorrow’s CPI inflation report is the next key figure in the short-term. The rise in CPI will likely slow on a year-over-year basis, but the Fed has shifted their focus to the monthly readings because of base effects. And that is where markets risk being disappointed again. We expect the October Core CPI to rise by 0.5% from the prior month – pointing to inflation well above the Fed’s mandate – with housing and service categories pulling up inflation, while supply-side categories, like used cars, and health insurance prices should become a drag. Higher-than-expected inflation figures have been a trigger for a stronger USD (6 out of the last 10 CPI releases this year – see Chart 3) and that could easily be the case this week as well, especially when the data shows that financial actors are net short USD – see chart 4.

Chart 3: EURUSD has fallen 6 out of the last 10 times after the release of the CPI data

.

Chart 4: Positioning data shows non-comercial players are net short USD

.

image1.png

What Dollar Impact to Expect from US CPI and Is This Crypto’s Lehman Moment?

S&P 500 Leads Risk Retreat as Midterms Pass, Beware the Crypto Markets Feedback

There was little relief from the market’s distraction through the start of this week. Where the passing of the US midterm elections lifted one future milestone throttling speculative interests, the more ‘binary’ potential of the consumer price index (CPI) release Thursday effectively picked up the baton to keep speculative conviction in check. Yet, that event too will soon pass. In evaluating the sentiment tide leading into the top US economic docket listing Thursday, there was some notable – but nascent – traction to be registered from the S&P 500 through Wednesday’s session. The -2.1 percent drop was the first drop from the US index in four trading sessions. It would also come with the headwind in the form of an upswing in in the VVIX ‘volatility of volatility’ index. A further erosion continued in the ratio of the once-speculative favorite Nasdaq 100 (populated by the top market cap FAANG members) relative to the stoic Dow Jones Industrial Average. The NDX-DJIA ratio edged down to a fresh two-and-a-half year low through Wednesday’s close.

Chart of S&P 500 with Volume Overlaid with the VVIX Index and 1-Day ROC (Daily)

image1.png

While the dominant fundamental focus around ‘risk assets’ over the past weeks and months has reasonably focused on the fallout on monetary policy’s impact as well as the probability of recession moving forward, it is important to keep a wary eye open for the unexpected sparks that can ignite unforeseen financial fires. Just such an embryonic threat seems to be bubbling up through the crypto market. The news earlier this week that cryptocurrency exchange FTX was struggling under heavy customer withdrawals seemed to find balance when it was reported that Binance was stepping in to essentially rescue the struggling company. That reassurance fell apart, however, this past session after Binance withdrew its acquisition offer. The implications are not good. This unfavorable turn begs the question: how systemically important is FTX to the crypto currency. It is a large player, but the real threat is the potential for contagion in the space. Should stress tests heaped on other critical players in the asset class foster critical pressure, technical placement will matter little. As for what this means for the broader financial system, the fact that this happening in the crypto space matters little if it triggers a general panic in speculative appetite general. I don’t operate expecting grey swans, but it would be foolish to ignore the flare ups that seem as if they could readily escalate.

image2.png

US CPI and the Dollar’s Exposure to the Rate Implications

With the passing of Wednesday’s session, we have further put space between the market’s speculative focus and the US midterm elections. That doesn’t mean that the political landscape in the US is clear – in fact, the outlook for Congress looks to depend on some key recounts and possible runoffs. However, for its overall speculative influence, I believe the short-term potential for this event has come and gone (the long-term influence will likely play out for some time but over a more glacial pace). Yet, with the alleviation of the election distraction, we see the focus of the speculative rank shift to yet another scheduled event in the immediate future: the US October CPI. The economist forecasts call for a very modest moderation of the inflation clip. This indicator series carries serious weight given the FOMC this past week made its plans for extending the timeline and peak rate for its hawkish regime ambiguous after last week’s 75 basis point rate hike. That influence can make the event a meaningful market mover whether the actual reading beat or miss expectations.

Critical Macro Event Risk on Global Economic Calendar for Next Week

image3.png

When it comes to the market’s response to the inflation report, the impact is likely to stretch broadly across the financial system; but the Dollar is perhaps my principal focus. Below is the DXY Dollar Index chart which each of the past 8 months’ CPI releases highlighted. The direction of the market takes after the inflation update depends significantly on the direction and intensity of the data’s surprise. That said, the market response to the updates has tended to skew towards significance. Given the extended series of significant rate hikes and the Federal Reserve’s warnings that it would act principally to control price pressures, the potential for significant volatility around this event remains very high.

 Chart of US Dollar with CPI Release Dates, 100-Day SMA and 1-Day ROC (Daily)

image4.png

EURUSD and USDJPY: Differing Potential Should Inflation Stir Market Response

When it comes to evaluating whether the inflation statistics will beat, meet or miss expectations; I don’t presume to have a meaningful insight into how the data will print. As such, my approach is to scope out options for the different outcomes. In the event that the CPI reading meets expectations, the tempo on the headline (8.0 percent) and core (6.4 percent) would still be extremely high and likely default to an essential assessment of a hawkish reading. That would be a negative catalyst for ‘risk’ and benefactor for the Dollar. Assessing an S&P 500 or Dow bearish course is fairly straight forward, but evaluating a strong Greenback beneficiary is a different matter given the currency is not far from its multi-decade highs set last month. One candidate that seems well positioned is EURUSD, but not for the revival of its overall bear trend. Rather, a swing over its past 8 week range would seem feasible.

 Chart of EURUSD (Daily)

image5.png

To truly disappoint through the US inflation report, the slowing in the CPI would likely need to be significant. Something on the order of a 7.0 percent headline clip could certainly achieve that designation – though it is a more extreme scenario. Such a downgrade in inflation pressures could give the Fed scope to ease up on its inflation fight and shift its attention back towards a throttling of economic conditions. Yet, for the US Dollar, the implications could be a little more immediate and dramatic. Among crosses that would be more exposed to a dramatic and intense reaction to a Dollar retreat, I consider USDJPY the most disposed to action. There is a risk sensitivity to this pair, but the macro fundamental sensitivity is principally a reflection of the Dollar’s fortunes. Therefore, an earnest Greenback breakdown would be particularly charged here.

Chart of USDJPY with 50 and 100-Day SMAs with 20-Day ATR and Historical Range (Daily)

image6.png

\