USDCAD’s upside could be tested

USDCAD’s upside could be tested

USDCAD has been on the sidelines this week, constrained between the familiar 1.3450 resistance and key upward-sloping line from August 2021 at 1.3400.The technical picture is leaning softly to the bullish side as the RSI is flattening slightly above its 50 neutral mark. Meanwhile, the MACD is gradually recovering above its red signal line but within the negative zone, while the Stochastic oscillator has already reached its 80 overbought level, reflecting fading upside pressures ahead of the Canadian employment report.

Nevertheless, sentiment will remain jittery if the pair continues to face limitations around the 23.6% Fibonacci retracement of the 1.2006-1.3976 upleg at 1.3511. The tentative resistance trendline from October’s top of 1.3976 is cementing that ceiling. Hence, a clear close above that wall would attract buyers’ attention, likely lifting the price straight to the 1.3600 number. Then, another victory here may prompt an extension towards the 1.3700-1.3745 boundary.

In the event of a downside reversal, the bears will fight for a break below the 1.3400 floor and the 20-day simple moving average (SMA) with scope to reach the support trendline from June’s low at 1.3330. Slightly lower, the 200-day SMA could immediately calm selling tendencies near the 38.2% Fibonacci of 1.3223. If it fails, the decline may pick up steam towards the 1.3130 handle.

Summing up, USDCAD is maintaining a neutral short- and medium-term outlook. A decisive close above 1.3511 or below 1.3330 could navigate the market accordingly.

UK economy narrowly avoids recession despite December hit from strikes

UK economy narrowly avoids recession despite December hit from strikes

A negative figure would have met the technical definition of a recession because the economy contracted over the previous three months to September as the cost of living crisis took a heavy toll on consumer spending.

Economic activity has stalled largely as a result of energy-led price pressures on households and businesses – with the Bank of England even predicting in November last year that the economy was already likely in recession.

The narrow miss, which is subject to revision by the ONS when more data becomes available, reflects an economy that is stagnating at best in the face of a continuing squeeze on spending power.

Output in December fell by 0.5% compared to the previous month, the ONS said, with contributions to the decline also coming from some early winter snow disruption and strikes including the Royal Mail dispute.

Businesses had reported a drop in orders due to delivery uncertainties across the month.

The report also pointed to a negative impact from the World Cup, having credited strong bar sales for lifting output during November.

ONS director of economic statistics, Darren Morgan, said of the performance: “The economy contracted sharply in December meaning, overall, there was no growth in the economy over the last three months of 2022.

“In December public services were hit by fewer operations and GP visits, partly due to the impact of strikes, as well as notably lower school attendance.

“Meanwhile, the break in Premier League football for the World Cup and postal strikes also caused a slowdown.

“However, these falls were partially offset by a strong month for lawyers, growth in car sales and the cold snap increasing energy generation.

“Despite recent squeezes in household incomes, restaurants, bars and travel agents had a strong year. Meanwhile, health and education also began to recover from the effects of the pandemic”.

Economists widely believe that recession during the first half of this year is inevitable, with the International Monetary Fund predicting last month that the UK would be the worst performer in the developed world including sanctions-hit Russia.

However, others have argued that a recession could be avoided despite continued pressure on budgets from inflation.

The government’s critics are urging the chancellor to use his spring budget next month to boost activity, accusing him of taking a miserly approach to the public finances.

Jeremy Hunt said in response to the ONS figures: “The fact the UK was the fastest growing economy in the G7 last year, as well as avoiding a recession, shows our economy is more resilient than many feared.

“However, we are not out of the woods yet, particularly when it comes to inflation.

“If we stick to our plan to halve inflation this year, we can be confident of having amongst the best prospects for growth of anywhere in Europe.”

Gold Prices Held Hostage by Fed Expectations – What Next for XAU?

Gold Prices Held Hostage by Fed Expectations – What Next for XAU?

Gold futures have struggled to recover from last week’s declines which drove XAU/USD below $1900. After climbing to a nine-month high of $1975.2 last week, the release of strong US economic data and a break of trendline support ended the three-month rally that has been driving the recovery from the October low of $1618.3.

Visit DailyFX education to learn more about gold trading and factors influencing gold prices

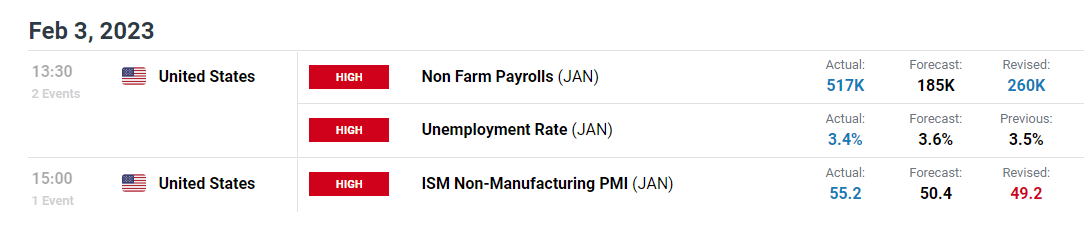
In response to the robust job data and positive ISM figures, recession fears were overshadowed by prospects of further rate hikes. As the 22% rally from the October lows fizzled out, both technical and fundamental factors contributed to Gold’s decline.

DailyFX Economic Calendar

Although gold and silver are safe-haven assets that are often used as a hedge against inflation, the non-yielding commodities are sensitive to rising interest rates.

After the Federal Reserve announced a softer 25 basis-point rate hike at the FOMC meeting earlier this month (1 Feb), gold prices temporarily surged before peaking at $1975.2. With investors interpreting the slower rate hike as a sign that the Fed could continue to slow down the pace of tightening, the announcement did not catch markets off-guard.

Trading Forex News: The Strategy

Trading Forex News: The Strategy
Recommended by Tammy Da Costa
Trading Forex News: The Strategy
Get My Guide

Gold (XAU/USD) Technical Analysis

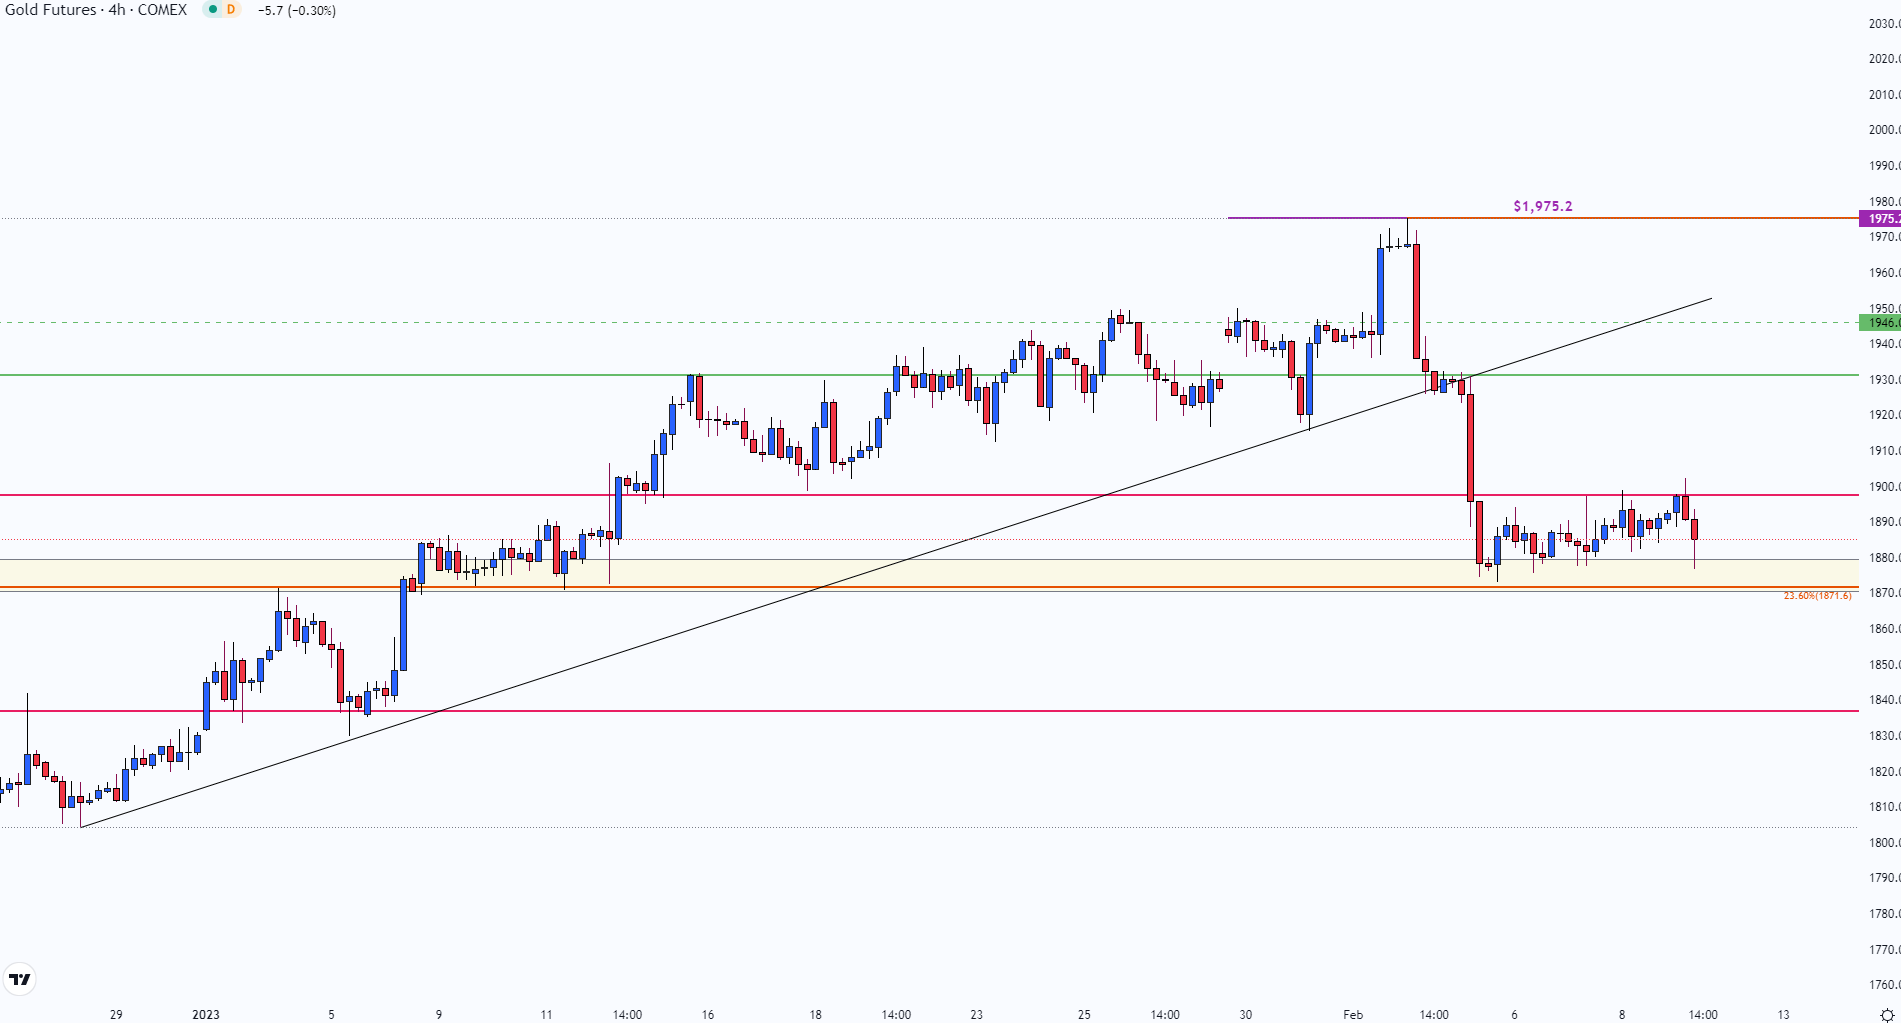
Since market participants had already priced in a 99% probability of a 25-basis point rate hike, gold’s upside was limited. As gold futures rose above the March 4th 2022 high of $1974.9, a series of doji candles appeared on the four-hour chart, indicative of indecision.

With the 24 February 2022 (the onset of the war in Ukraine) high holding at $1976.5, the firm barrier of resistance held firm, allowing bulls to go no further than $1975.2.

Gold (XAU/USD) four-hour chart

Chart, histogram  Description automatically generated

Chart prepared by Tammy Da Costa using TradingView

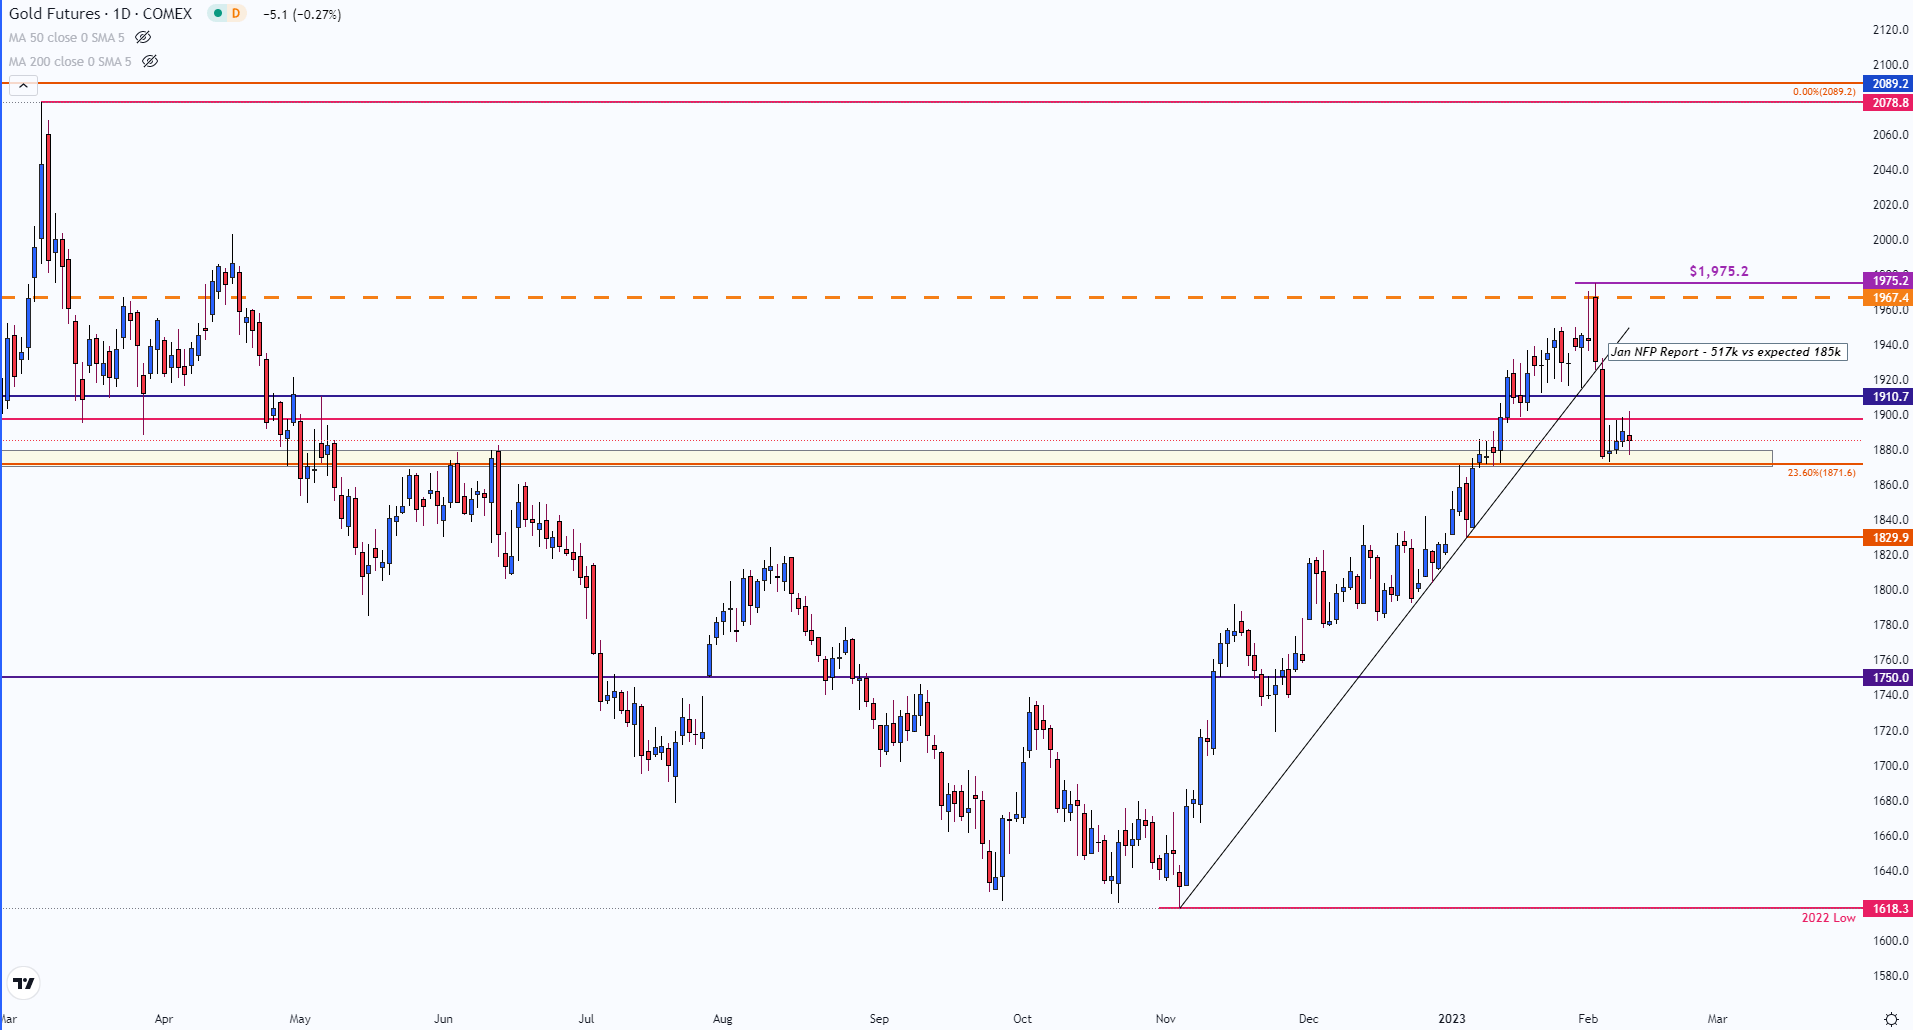
As sellers forced prices lower, a break of prior trendline support (from the October low) drove XAU/USD back below $1930. Then, there was the release of the US NFP report which came in well-above estimates. With 517,000 jobs being added to the US economy in January, Gold prices continued to decline before stabilizing around $1880.

Gold Daily Chart

Graphical user interface, chart, line chart  Description automatically generated

Chart prepared by Tammy Da Costa using TradingView

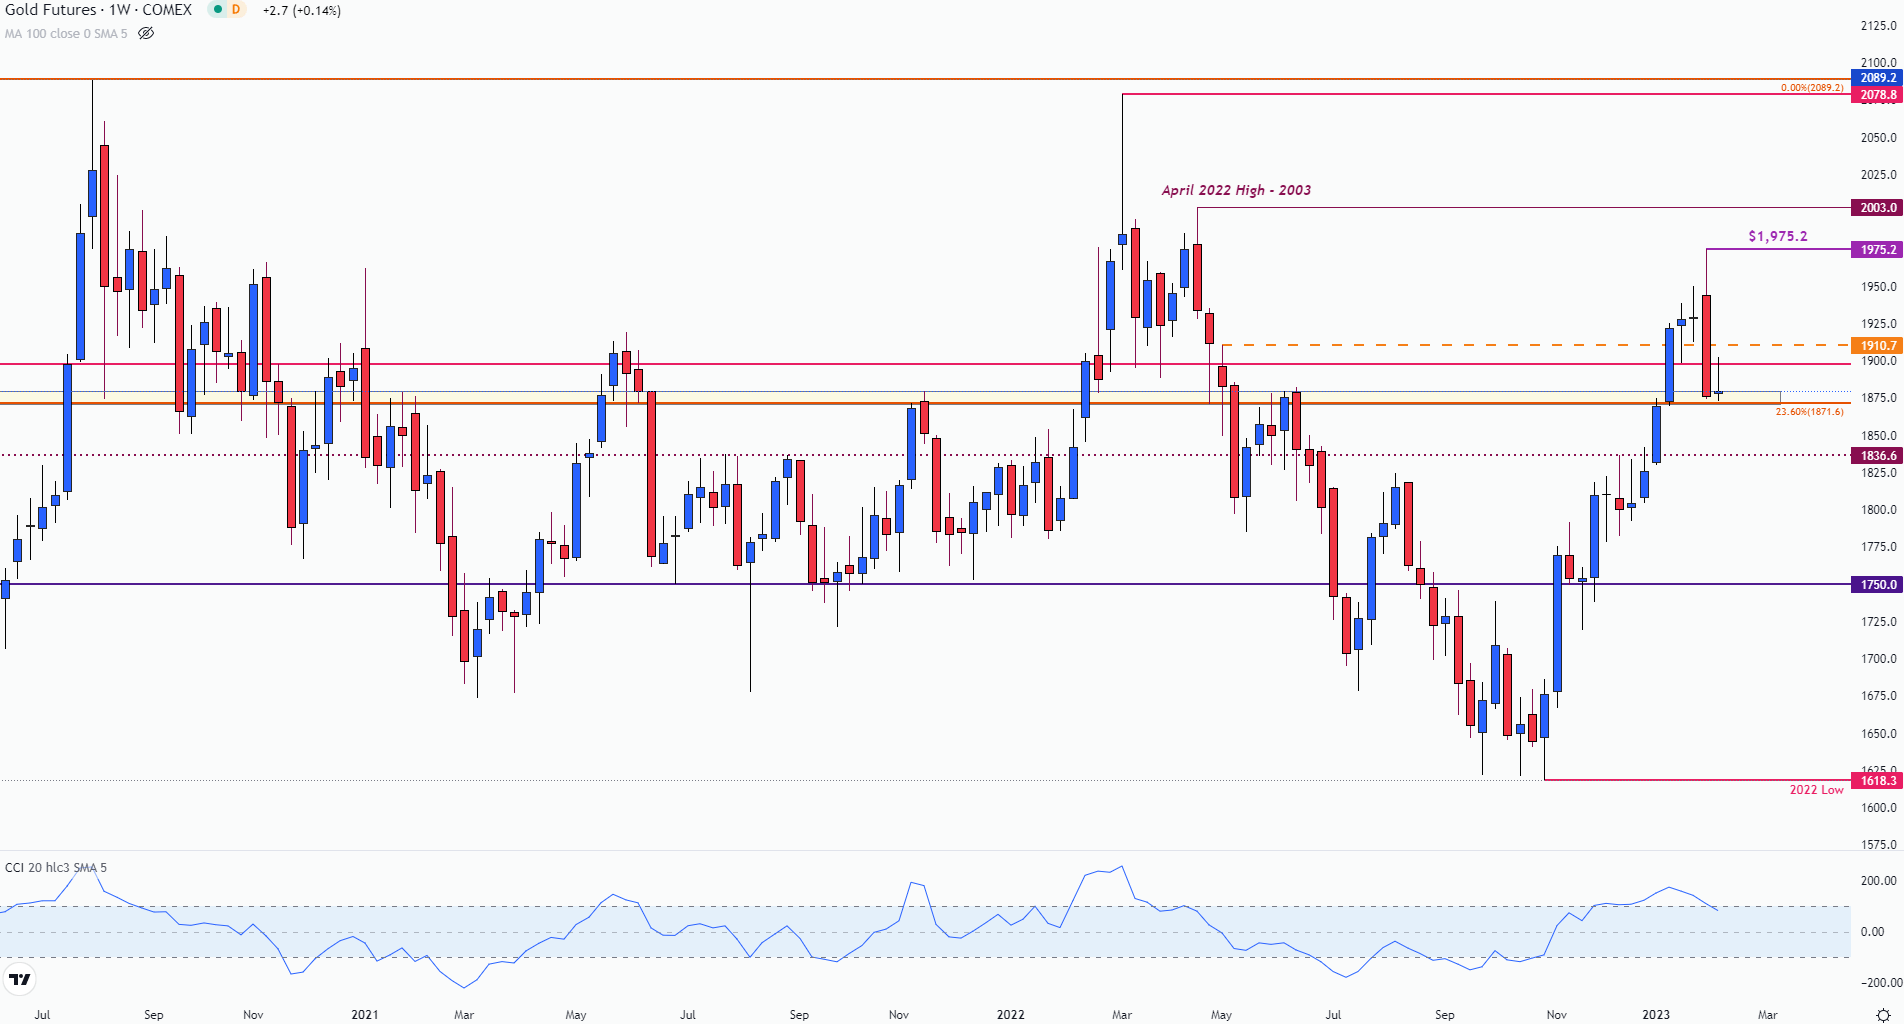
On the weekly chart below, a rejection of the upper wick at the current monthly high was accompanied by a sharp pullback and a retest of $1873.2. Simultaneously, the weekly CCI (commodity channel index) eased back from overbought territory suggesting that bulls had run out of steam. With the current weekly candle showing little movement, a tight range has formed between $1873 and $1880.

Gold (XAU/USD) Weekly Chart

Chart, bar chart, histogram  Description automatically generated

Chart prepared by Tammy Da Costa using TradingView

Just below that, the 23.6% Fibonacci of the 2018 – 2020 move has formed an additional zone of support at $1871.6. If prices fall below this level, prices could continue to decline, towards the next support target of $1836.6.

Gold Prices Sink as US Dollar Rallies on Fading Fed Pivot Bets, Where to?

Gold Prices Sink as US Dollar Rallies on Fading Fed Pivot Bets, Where to?

Asia-Pacific Market Briefing – Gold Prices Sink as Treasury Yields Climb

Gold prices sank 0.77% on Thursday which was the worst single-day performance in almost one week. The yellow metal sank as the US Dollar and front-end Treasury yields climbed during the Wall Street trading session. XAU/USD tends to function as the anti-fiat trading instrument in financial markets. That is because of its lack of yield when holding the precious metal outside of expected returns.

XAU turned lower following a couple of notable events. The first is that we had commentary from Federal Reserve Bank of Richmond President Thomas Barkin. He said that it is important to continue tightening to rein in inflation. We also had weekly US jobless claims cross the wires. While the 196k outcome was higher than the 190k estimate, it remains historically low.

All this continues to pour cold water on market expectations that the central bank will pivot to interest cuts later this year. This follows last week’s non-farm payrolls report blowout, which underscored a relatively tight labor market that might be able to withstand the most aggressive tightening in decades. Since then, the markets have been pricing rate hikes back in.

Friday’s Asia-Pacific trading session is notably quiet in terms of economic data. That may continue allowing general risk appetite to set the tone for markets. If bond yields and the US Dollar continue climbing, this may pressure gold prices heading into the University of Michigan sentiment data later today. A higher-than-expected print would likely further compound this dynamic.

Gold Technical Analysis

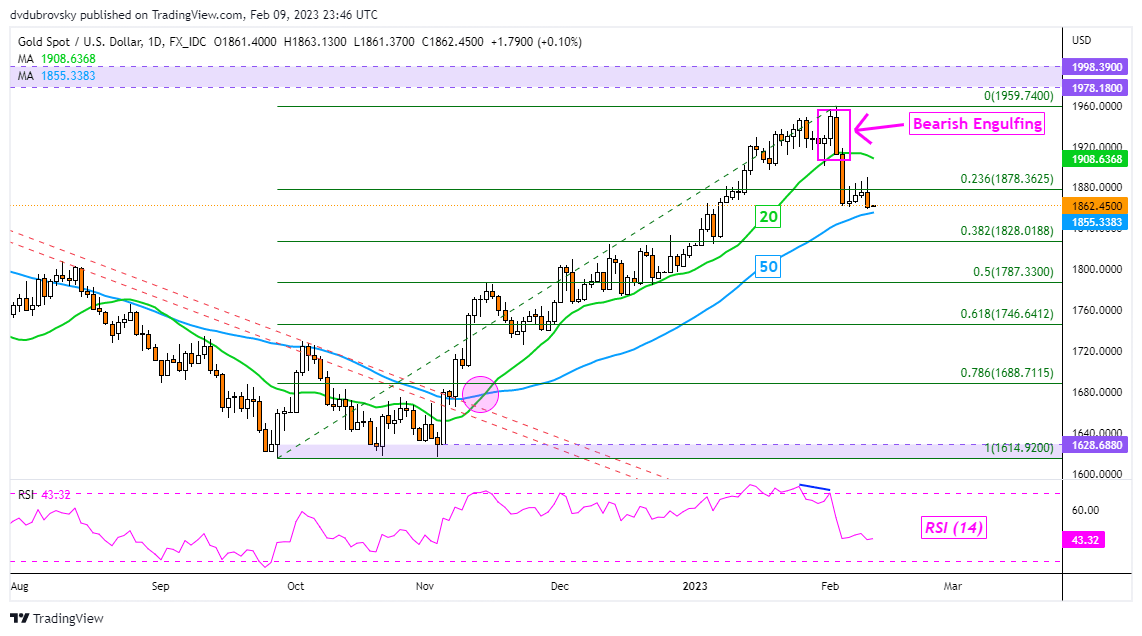
On the daily chart, gold has closed at its lowest since January 6th, just barely taking out lows from earlier this week. Still, prices remain above the 50-day Simple Moving Average (SMA). The latter may hold as support, maintaining the upside focus. That would undermine the Bearish Engulfing from earlier this month. Otherwise, extending lower would increasingly offer a bearish posture.

XAU/USD Daily Chart

XAU/USD Daily Chart

Swedish Krona Bolts Higher, Norwegian Krone Follows. Where to for EUR/SEK and EUR/NOK?

Swedish Krona Bolts Higher, Norwegian Krone Follows. Where to for EUR/SEK and EUR/NOK?

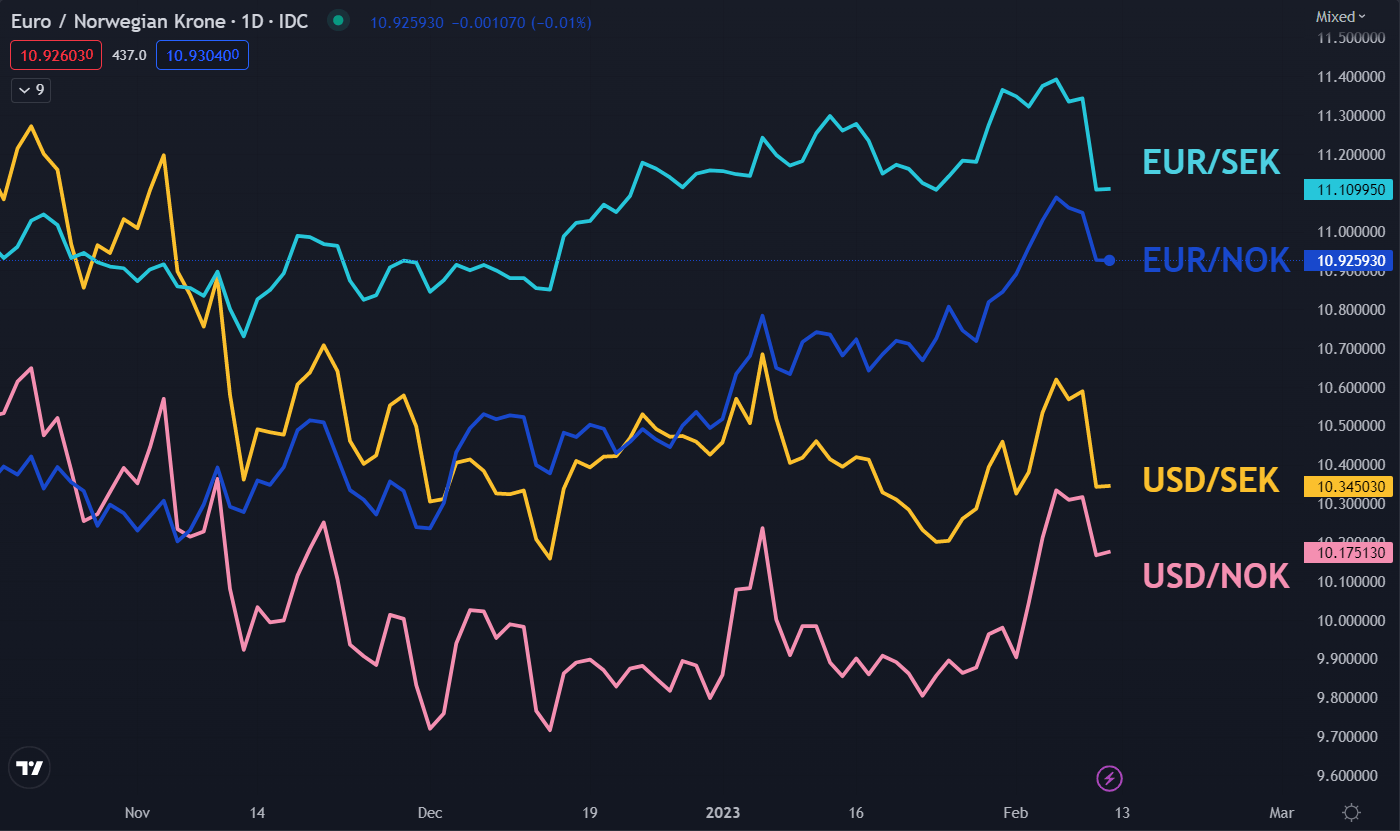
The Swedish Krone piled on a staggering rally in the aftermath of the Riksbank lifting its target rate to 3.0% from 2.5% and paved the way for further tightening of monetary policy.

Before the meeting, the market had been leaning toward a pause in the hiking cycle, but it signalled that it is now looking at more rate rises at the next meeting in April and beyond.

The bank said that inflation remains too high. CPI year-on-year to the end of December was 12.3%. In addition, PPI is running rampant, coming in at 18.7% for the same period.

USD/SEK hit an all-time high last October at 11.4964 but SEK has since recovered around 10%. However, EUR/SEK was at a 13-year high of 11.4425 on Monday and the bank acknowledged the problem of a weakening domestic currency that can lead to importing inflation.

Although the hike had mostly been anticipated, the world’s oldest central bank (founded in 1668) also announced that it would pick up the pace of reducing its asset holdings.

They will continue to sell government bonds from their stockpiles. The action is essentially a quantitative tightening (QT).

The re-acceleration of tightening comes after the European Central Bank (ECB) also re-asserted its effort to rein in inflation with a 50 bp lift in its target rate last week. They also signalled that similar size moves could be forthcoming at future meetings.

Not to be left out, neighbouring Norway saw their currency go for a gallop with EUR/NOK sliding away from the 27-month high seen earlier in the week.

Norges bank left rates unchanged at 2.75% at their January meeting and don’t gather again until late March. They do not face the same inflation problem that Sweden and the Euro-zone are staring at.

The NOK is more prone to sways in global sentiment due to its massive supply of energy. Crude oil prices eased overnight after recovering from a 2-month low through the early part of this week.

Globally, it appears that the race is on in many countries to get the inflation genie back in the bottle. The central bank’s policy adjustments may play a large role in currency movements going forward

EUR/SEK, USD/SEK, EURNOK, USD/NOK

image1.png

Hang Seng Index Technical Outlook: A Pause, not a Reversal

Hang Seng Index Technical Outlook: A Pause, not a Reversal

HANG SENG INDEX TECHNICAL OUTLOOK – BULLISH

The recent retreat in Hong Kong shares appears to be a pause and not a reversal of the uptrend. Indeed, breadth market indications and technical charts continue to paint a bullish story over the coming weeks.

Price Facts, Sentiment, Narrative

image1.png

As of Thursday, 96% of the members in the Hang Seng Index (HSI) were above their respective 100-day moving averages (DMAs), not too far from 100% a week ago. Data from 2001 onwards suggests that when 100% of the members are above their respective 100-DMAs, the index has been up 60% of the time over the subsequent 120 days (see distribution plot of returns).

Distribution Plot of Returns Over 120 Days

Source data: Bloomberg; Chart created by Manish Jaradi using Python.

On technical charts, HSI has pulled back from stiff resistance on a horizontal line from early 2022 (at about), coinciding with the 89-week moving average. The drop below the lower edge of a rising channel from October confirms that the upward pressure has faded somewhat in the short term (somewhat because of the steepness of the channel. That is, even sideways price action can lead to a break below the channel, but it may not be necessarily bearish).

Hang Seng Index Daily Chart

image3.png

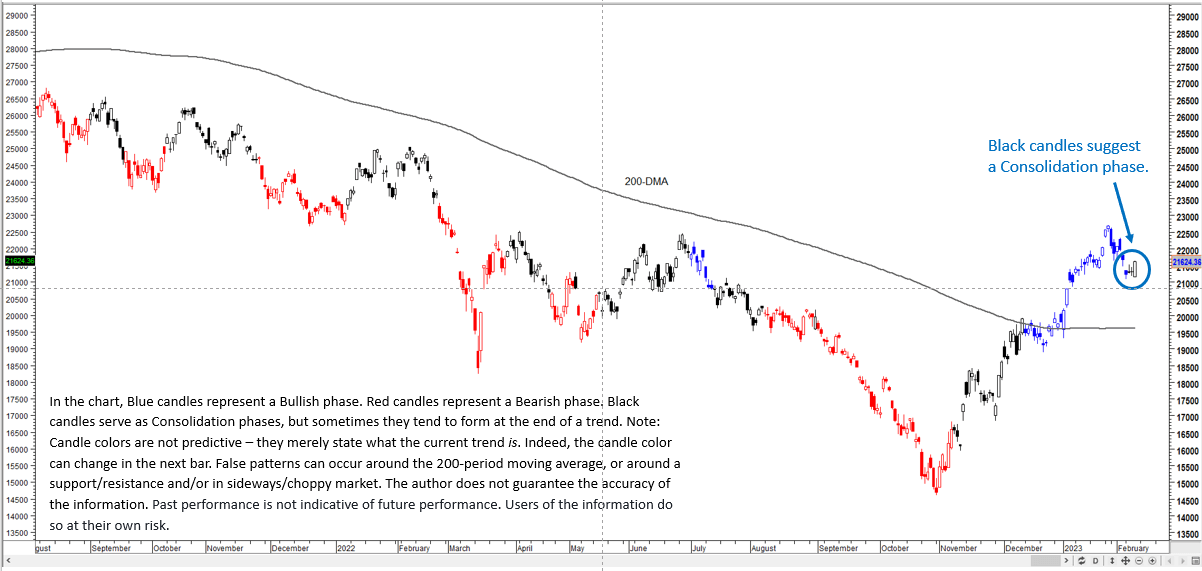
However, the broader trend continues to be bullish, (see previous update for more details) as reflected by the Moving Average Convergence Divergence indicator in the positive territory and the color-coded candles. Having said that, consolidation doesn’t necessarily mean that the index can’t fall further – it could, but generally not deep enough to alter the broader trajectory.

Hang Seng Index Daily Chart

image4.png

In this regard, there is quite a strong converged cushion at the early-December high of 19926, coinciding with the 89-day moving average (DMA) and the 200-DMA. Stronger support is on the lower edge of the Ichimoku cloud cover (now at about 18000).

Dow Jones, S&P 500 Outlook: Retail Traders Boost Net-Long Bets. A Warning Sign?

Dow Jones, S&P 500 Outlook: Retail Traders Boost Net-Long Bets. A Warning Sign?

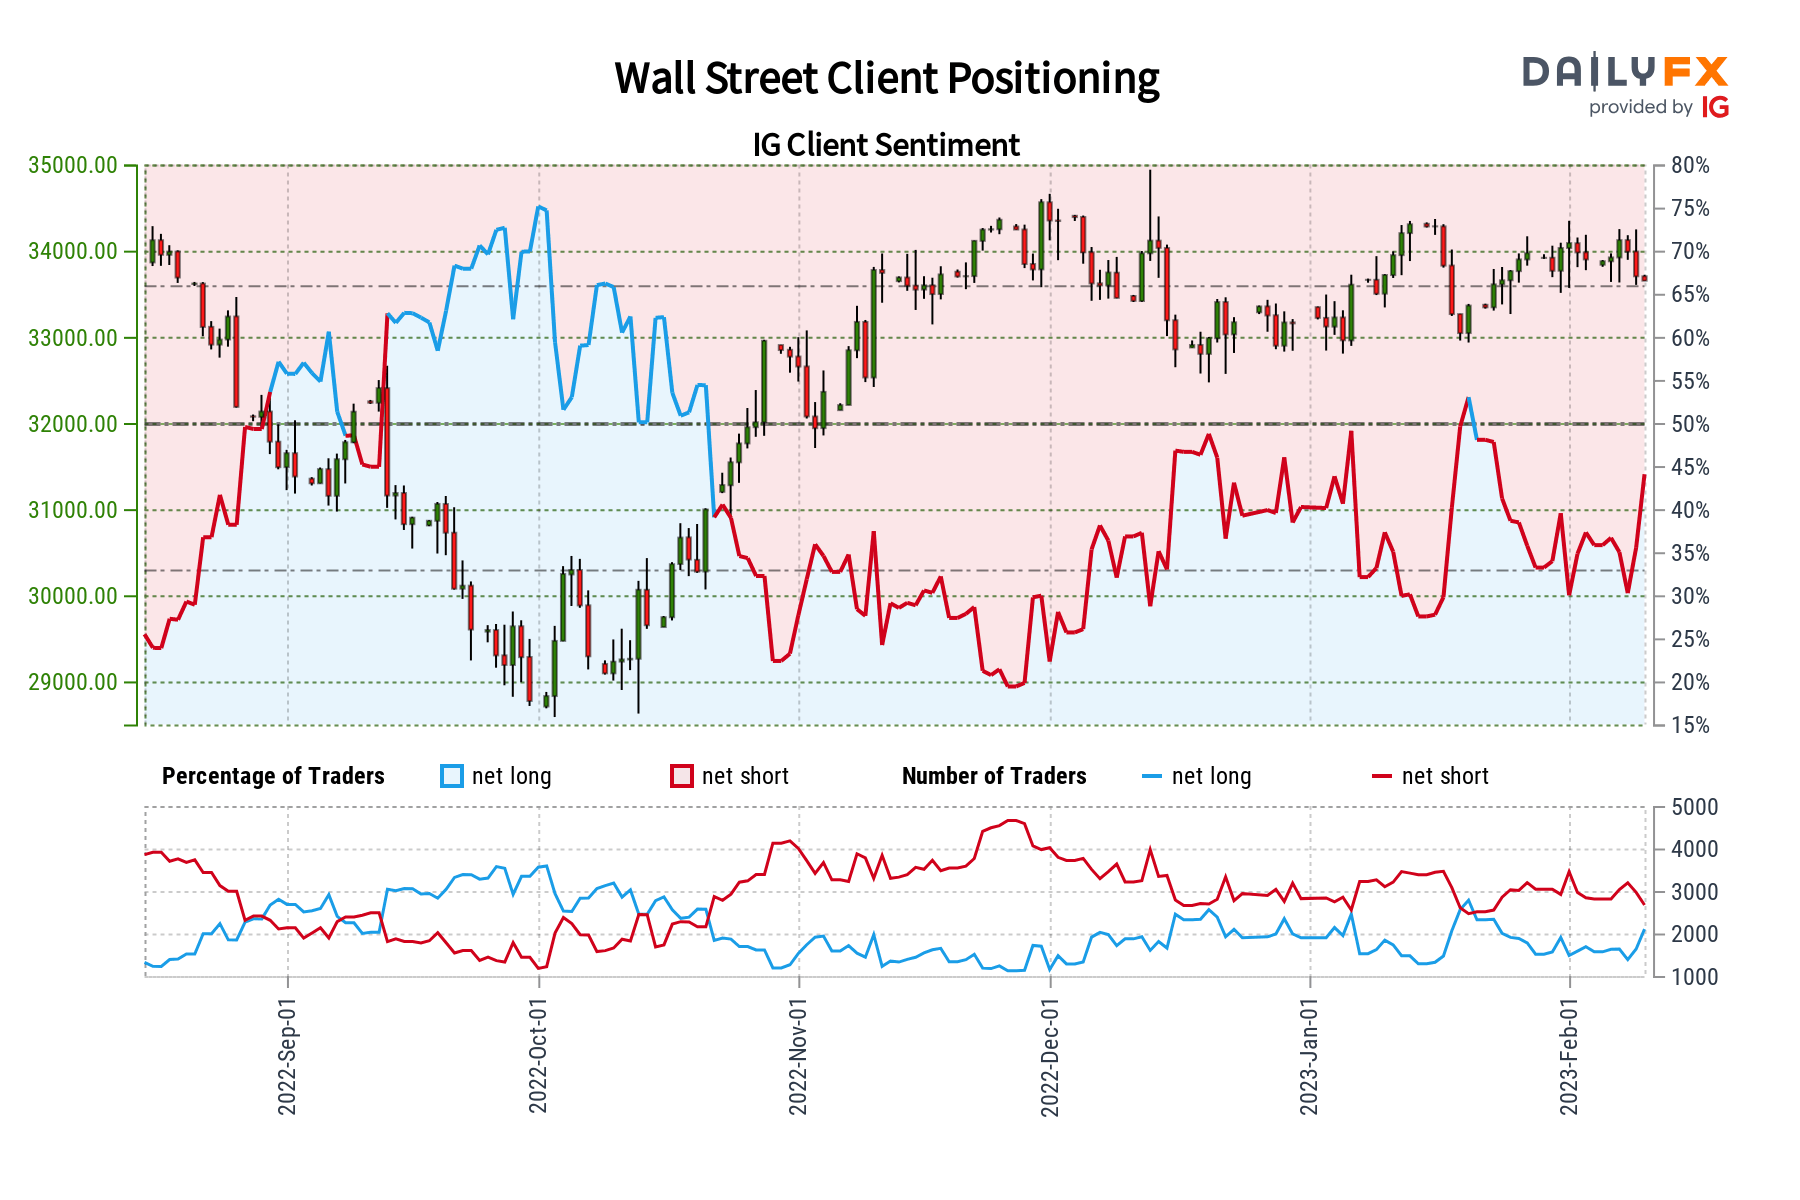
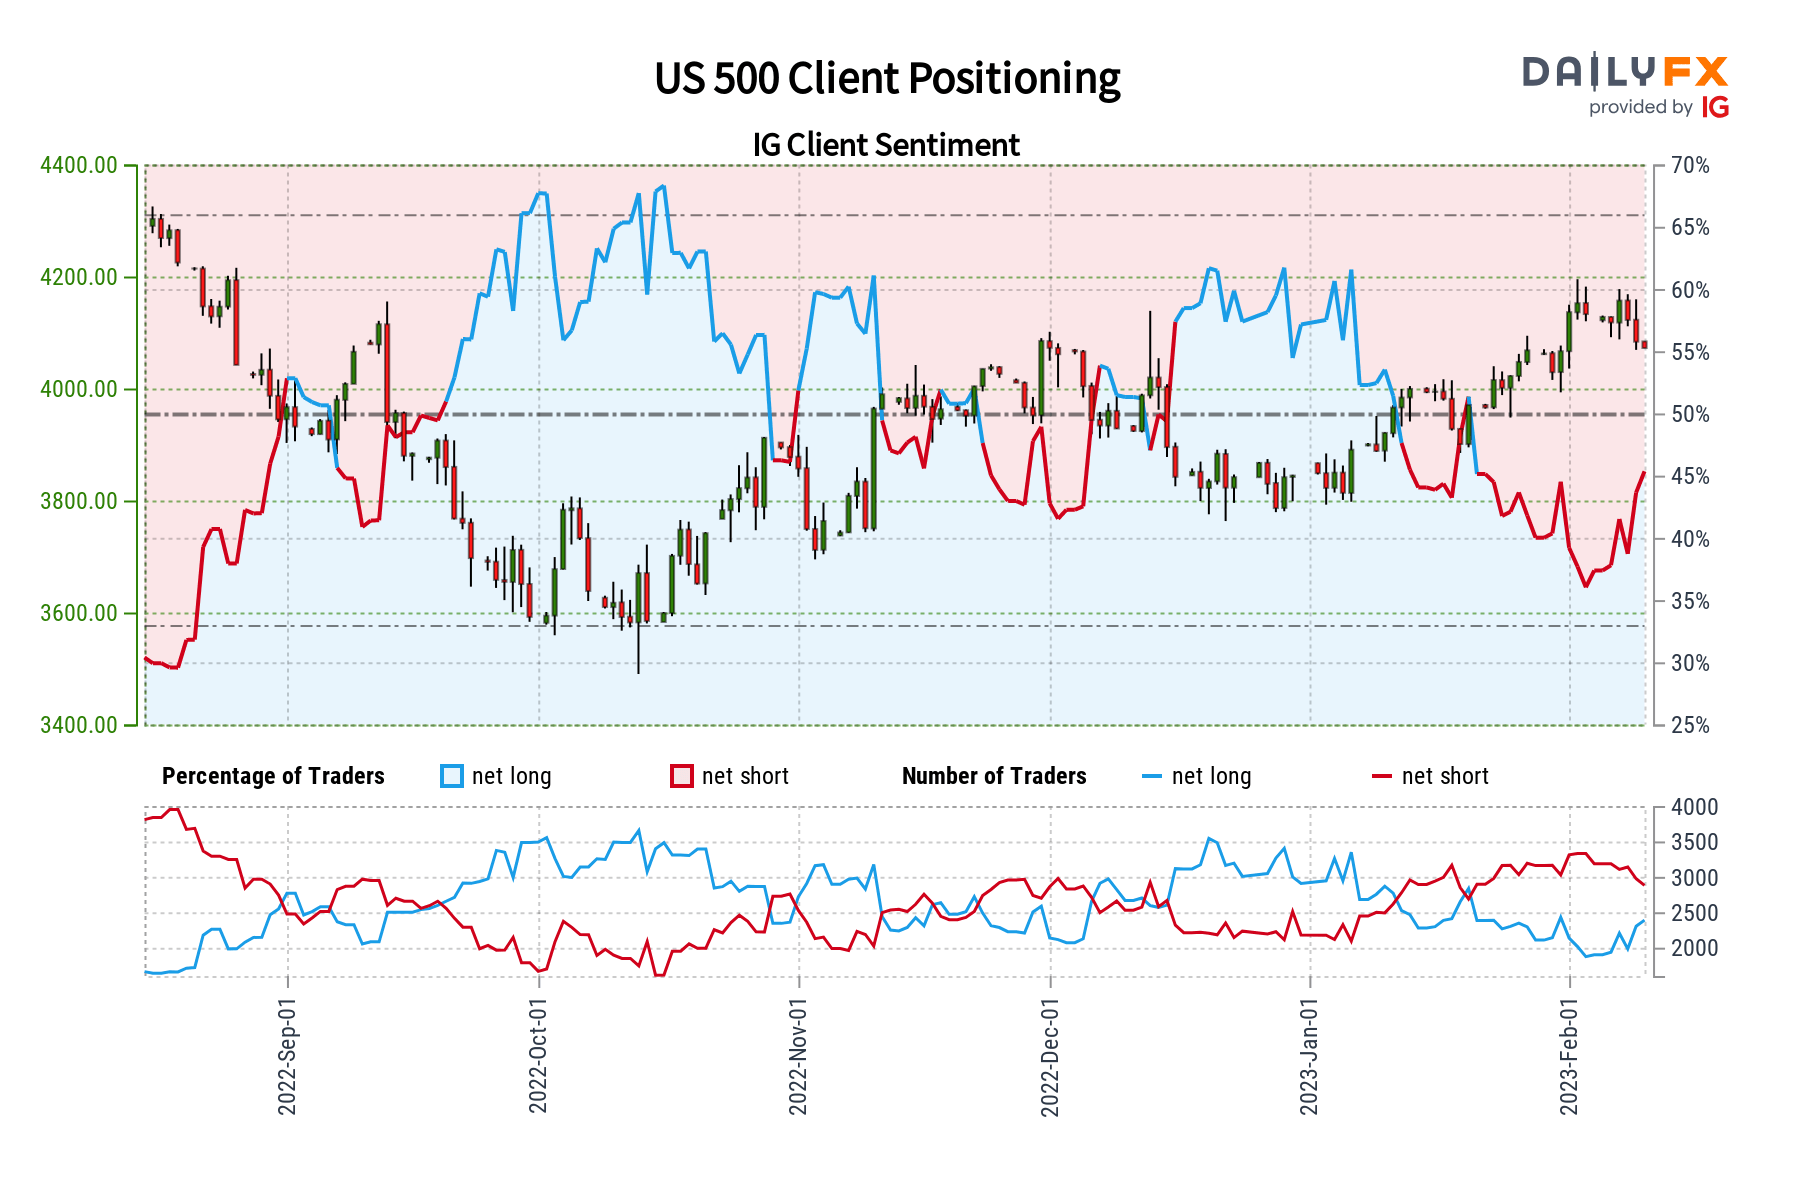
In recent days, the Dow Jones and S&P 500 have been aiming lower. In response, retail traders have been slowly increasing their net-long exposure on Wall Street. This can be seen through the lens of IG Client Sentiment (IGCS), which tends to function as a contrarian indicator. As such, if this trend in positioning continues, further losses may be in store for equities.

Dow Jones Sentiment Outlook – Bearish

According to IGCS, about 44 percent of retail traders are net-long the Dow Jones. Since most traders are net-long, this hints prices may continue rising. However, upside exposure has increased by 30.05% and 27.68% compared to yesterday and last week, respectively. With that in mind, recent changes in exposure hint that prices may soon reverse lower despite overall positioning.

Dow Jones Sentiment Outlook - Bearish

Dow Jones Futures Technical Analysis

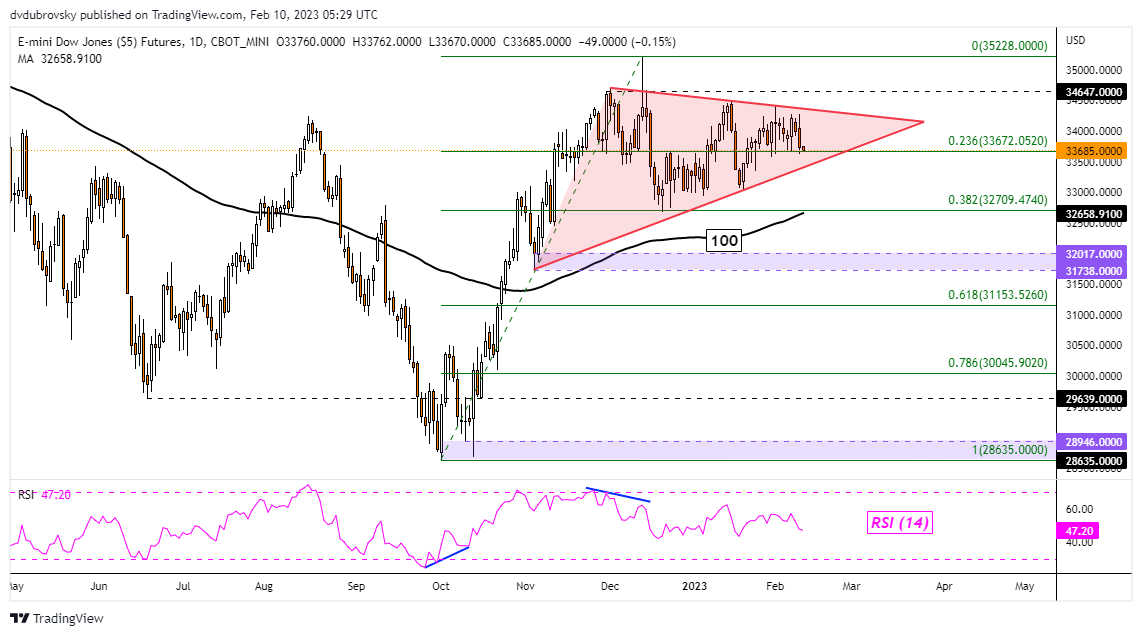
On the daily chart, the Dow Jones appears to be consolidating within the boundaries of a Symmetrical Triangle. Prices recently rejected resistance, turning lower towards the rising floor of the chart formation. The direction of the pattern’s breakout could be key for the following trend. Extending losses lower would open the door to resuming the dominant downtrend from last year. That would place the focus on the 100-day Simple Moving Average (SMA).

Dow Jones Futures Technical Analysis

S&P 500 Sentiment Outlook – Bearish

According to IGCS, about 45% of retail traders are net-long the S&P 500. Since most of them are still net-long, this hints prices may continue rising. However, net-long exposure has increased by 4.35% and 26.62% compared to yesterday and last week, respectively. With that in mind, recent changes in positioning warn that prices may reverse lower despite the overall balance of exposure.

S&P 500 Sentiment Outlook - Bearish

S&P 500 Futures Technical Analysis

S&P 500 futures appear to be trading within the confines of a bearish Rising Wedge from October. Recently, prices rejected the ceiling, setting the stage for a retest of the floor of the chart pattern. While the index remains within the wedge, the near-term trend may remain biased higher. However, confirming a breakout would open the door to resuming the dominant downtrend from 2022.

S&P 500 Futures Technical Analysis

Breaking News: UK GDP Data in Line with Estimates, GBP/USD Steady

Breaking News: UK GDP Data in Line with Estimates, GBP/USD Steady

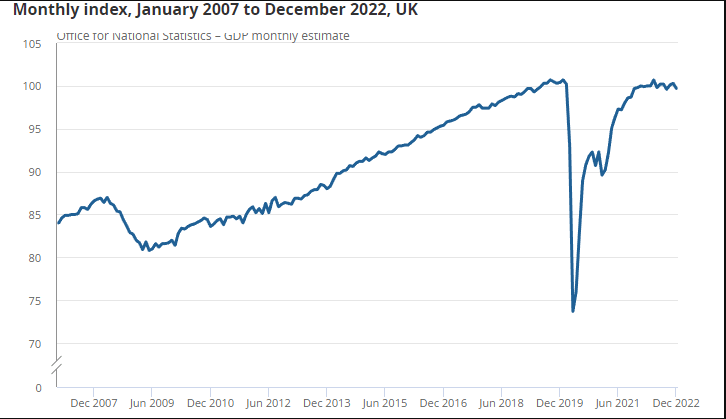
UK GDP preliminary data for Q4 2022 indicated a definite slowdown despite matching estimates. Monthly real gross domestic product (GDP) is estimated to have fallen by 0.5% in December 2022 while the bigger picture showed that GDP was flat in the 3 months to end December 2022. As a whole 2022 GDP came in at 4.1%.

Graphical user interface, text, application, email  Description automatically generated


image2.png

Customize and filter live economic data via our DailyFX economic calendar

The services sector fell by 0.8% in December 2022, after unrevised growth of 0.2% in November 2022; the largest contributions to this fall came from human health activities, education, arts, entertainment and recreation activities, and transport and storage. Output in consumer-facing services fell by 1.2% in December 2022 while production output grew by 0.3% in December 2022 compared to 0.1% in November. The main contributor to this growth was electricity, gas, steam and air conditioning supply.

Chart, line chart  Description automatically generated

Source: Office for National Statistics

UK GDP GROWTH PROSPECTS FOR 2023

The International Monetary Fund (IMF) recently upgraded its global GDP Forecasts for 2023 with the UK economy seen growing at -0.6% for the year. This would represent a sharp downturn following a largely resilient 2022 with the UK economy facing significant headwinds in 2023. The ongoing worker’s strikes, Government debt and ongoing issues around Brexit are all set to weigh on any attempted recovery in 2023.

The IMF emphasized that among its concerns for the UK economy moving forward is energy prices, employment levels and monetary policy with further tightening expected to fight inflation. Energy prices have since fallen sharply adding a ray of hope, however employment is yet to recover to pre-pandemic levels as the labor market remains tight but has not absorbed as many people back into employment as it had before. This is likely to result in less output and production in 2023.

MARKET REACTION

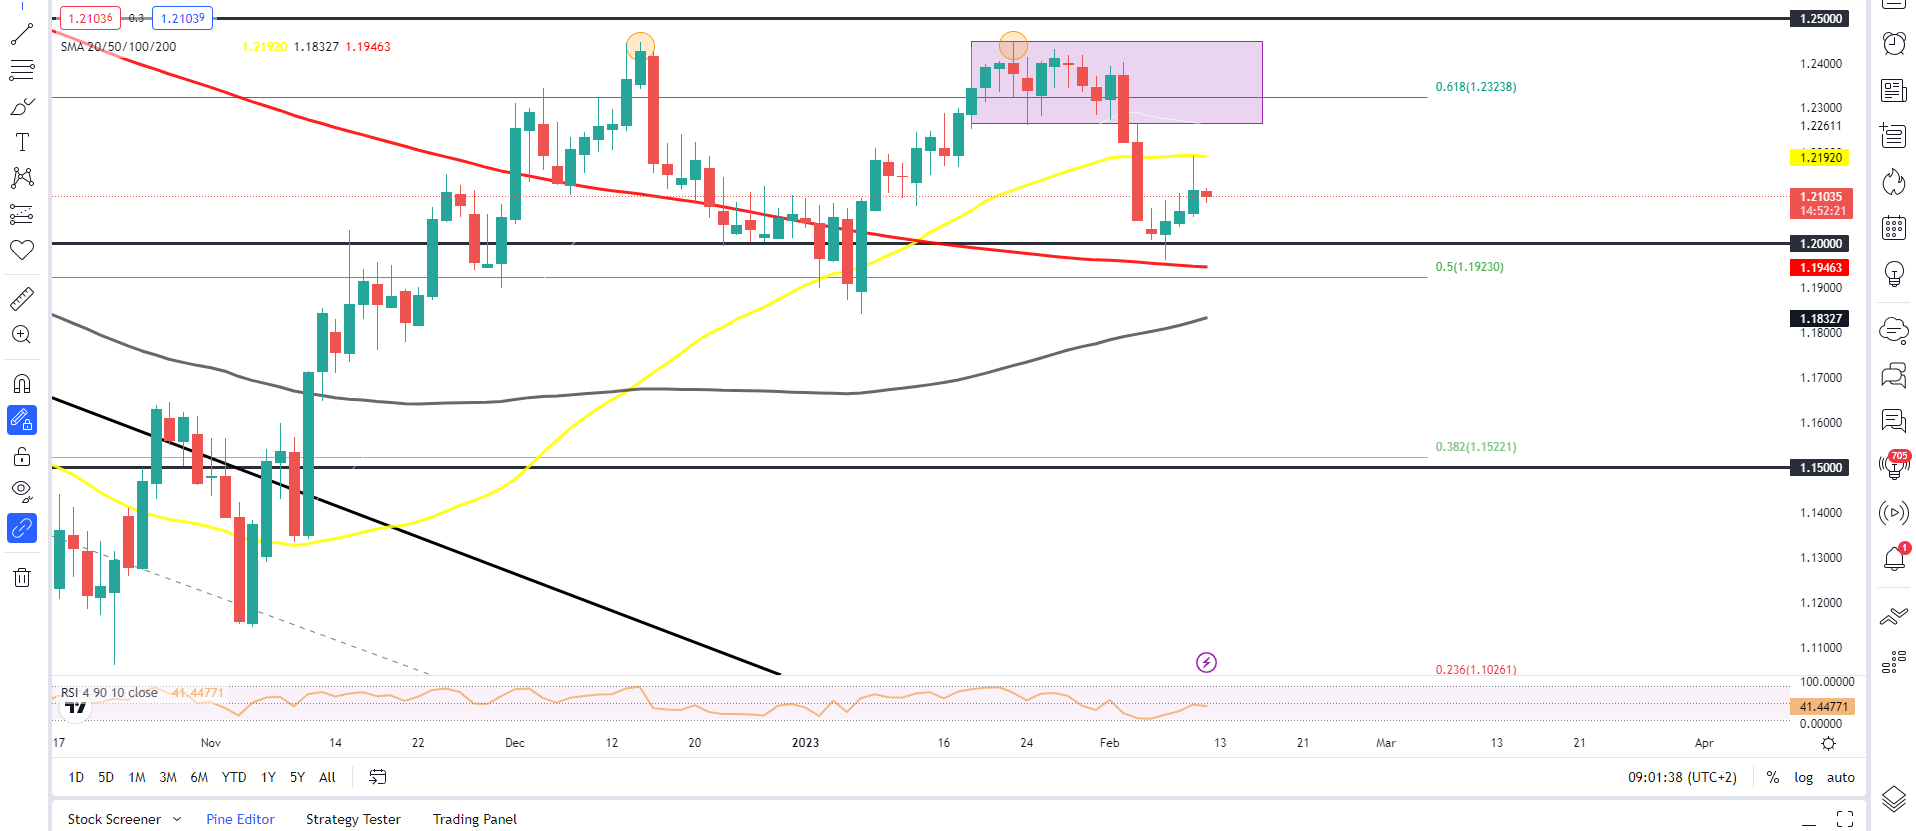
The initial market reaction following the news has seen GBPUSD decline 15 pips. Looking at the bigger picture from a technical perspective, GBPUSD price has bounced off the 200-day MA following it selloff toward the end of last week. Yesterday we saw resistance come into play around the 50-day MA at 1.21920 with the price hovering between the two MAs. Further downside remains more appealing over the medium term, however a break above the 50-day MA and retest of the range or the psychological 1.2500 area cannot be ruled out before the next leg to the downside unfolds.

GBPUSD Daily Chart, February 10, 2022

Chart  Description automatically generated

USD/CAD bulls attack 1.3470 hurdle as Oil price retreats, BoC contradicts Fed

USD/CAD bulls attack 1.3470 hurdle as Oil price retreats, BoC contradicts Fed

USD/CAD remains on the front foot for the second consecutive day, extending the previous day’s rebound from the weekly low to refresh the intraday top near 1.3455 during early Thursday. In doing so, the Loonie pair justifies the divergence between the monetary policy outlook at the Bank of Canada (BoC) and the US Federal Reserve (Fed). Also fuelling the quote could be the latest weakness in the Oil price, Canada’s key exports, and the mixed sentiment.

On Wednesday, the BoC released its monetary policy meeting minutes for the first time and highlighted the growing discussions among the policymakers to pause the rate hikes. On the same line, BoC Governor Tiff Macklemd asked for time to gauge how households and businesses adapt to higher rates before further moves. The policymaker also said, “Rate hikes have hit homeowners hard.”

Elsewhere, Fed Governor Christopher Waller teased a long fight with a 2.0% inflation target by citing expectations of tighter monetary policy for longer than expected. New York Federal Reserve President John Williams was almost on the same line while saying that the labor market is still very strong and noted that they have more work to do on rates; adding data will determine the path of rate hikes. Fed Governor Lisa Cook said that the central bank remains focused on restoring price stability, as inflation is still running too high. She added that they would need a restrictive monetary policy for some time.

It’s worth noting that the US diplomats also highlighted concerns that defend the higher Fed rates and fuel the USD/CAD price. US Treasury Secretary Janet Yellen mentioned, “While inflation remained elevated, there were encouraging signs that supply-demand mismatches were easing in many sectors of the economy.” Elsewhere, US President Joe Biden said during a PBS interview that there will be no US recession in 2023 or 2024.

On a different page, easing fears surrounding the US and China joins the firmer US Dollar Index (DXY) to weigh on the Oil prices, down 0.05% around $78.50 by the press time, which in turn allows the USD/CAD buyers to keep the reins.

No significant data/events are there for publishing on the calendar; hence, the central bankers’ comments and other risk catalysts will be critical for the USD/CAD pair traders to watch for clear directions.

Technical analysis

USD/CAD pair’s successful trading beyond the convergence of the 50-SMA and a weekly ascending trend line near 1.3370 keeps buyers hopeful of overcoming the immediate resistance line stretched from January 19 surrounding 1.3470.

Biden says Xi faces ‘enormous problems’

Biden says Xi faces ‘enormous problems’

WASHINGTON: President Joe Biden on Wednesday said his Chinese counterpart Xi Jinping faces “enormous problems,” including a fragile economy.

In an interview with PBS NewsHour, Biden said China was constrained in its ability to confront the United States by the need to protect international trade and that Xi himself is in an unenviable position.

“Can you think of any other world leader who’d trade places with Xi Jinping? I can’t think of one,” Biden said.

“This man has enormous problems,” Biden said.

The Democrat, who frequently describes the US-China relationship as the most consequential in the world, added that Xi “has also great potential.”

However, Biden said “so far, he has an economy that is not functioning very well.”

According to Biden, Xi recognizes his limited ability for maneuver in confrontation with Western countries.

Pointing to China’s so far relatively muted support for ally Russia in its invasion of Ukraine, Biden said “everyone assumed that China would be all in with Russia” – but “they’re not all in.”

The reason, according to Biden, is that Xi has drawn lessons from the overwhelming Western response against Russia, including imposition of powerful economic sanctions.

Biden vows ‘to protect’ country, refers to China balloon

“I called him this summer to say, ‘This is not a threat, just an observation – look what’s happened to Russia,’” Biden recalled.

Biden said he underlined in that conversation with Xi that 600 US corporations had quit Russia since its invasion began in Ukraine a year ago.

“I said, ‘You’ve told me all along that the reason why you need relationships with the United States and Europe is so that they invest in China.’ I said: ‘Who’s going to invest in China if you engage in the same kind of deal?’”

Biden met in person with Xi last November on the sidelines of the G20 summit in Bali for the first time since he became US president in 2021. They have also talked in five phone or video calls during that time.

US Secretary of State Antony Blinken last week announced a last-minute cancelation of a trip to Beijing as tensions flared again over the appearance of a high-altitude Chinese balloon over the United States – and its shooting down by the US Air Force on Saturday.

The United States says the balloon, which flew over sensitive military sites, was an espionage device. China says the balloon was just studying weather.