Japanese Yen Technical Outlook: Is USD/JPY Building a Base?

Japanese Yen Technical Outlook: Is USD/JPY Building a Base?

USD/JPY SHORT-TERM TECHNICAL FORECAST – NEUTRAL

The Japanese yen’s slide against the US dollar in recent days confirms that the upward pressure has faded for now, but it doesn’t alter the broader uptrend trend established in recent months.

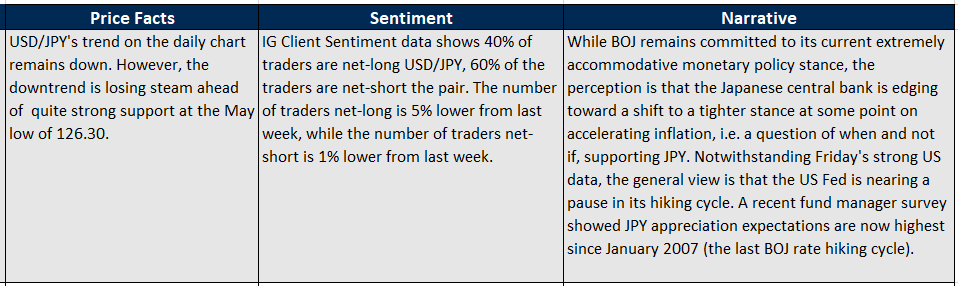
Price Facts, Sentiment, Narrative

image1.png

USD/JPY is up after US Fed last week hiked interest rates by 25 basis points and Chair Powell said the central bank could conduct a few more rate hikes to bring down inflation to its target.

US jobs and services data beat expectations, triggering a repricing higher in US rate expectations. In addition, reports that Bank of Japan Deputy Governor Masayoshi Amamiya could succeed incumbent Haruhiko Kuroda as central bank governor have provided some support to USD/JPY as BOJ’s ultra-easy policy is expected to continue.

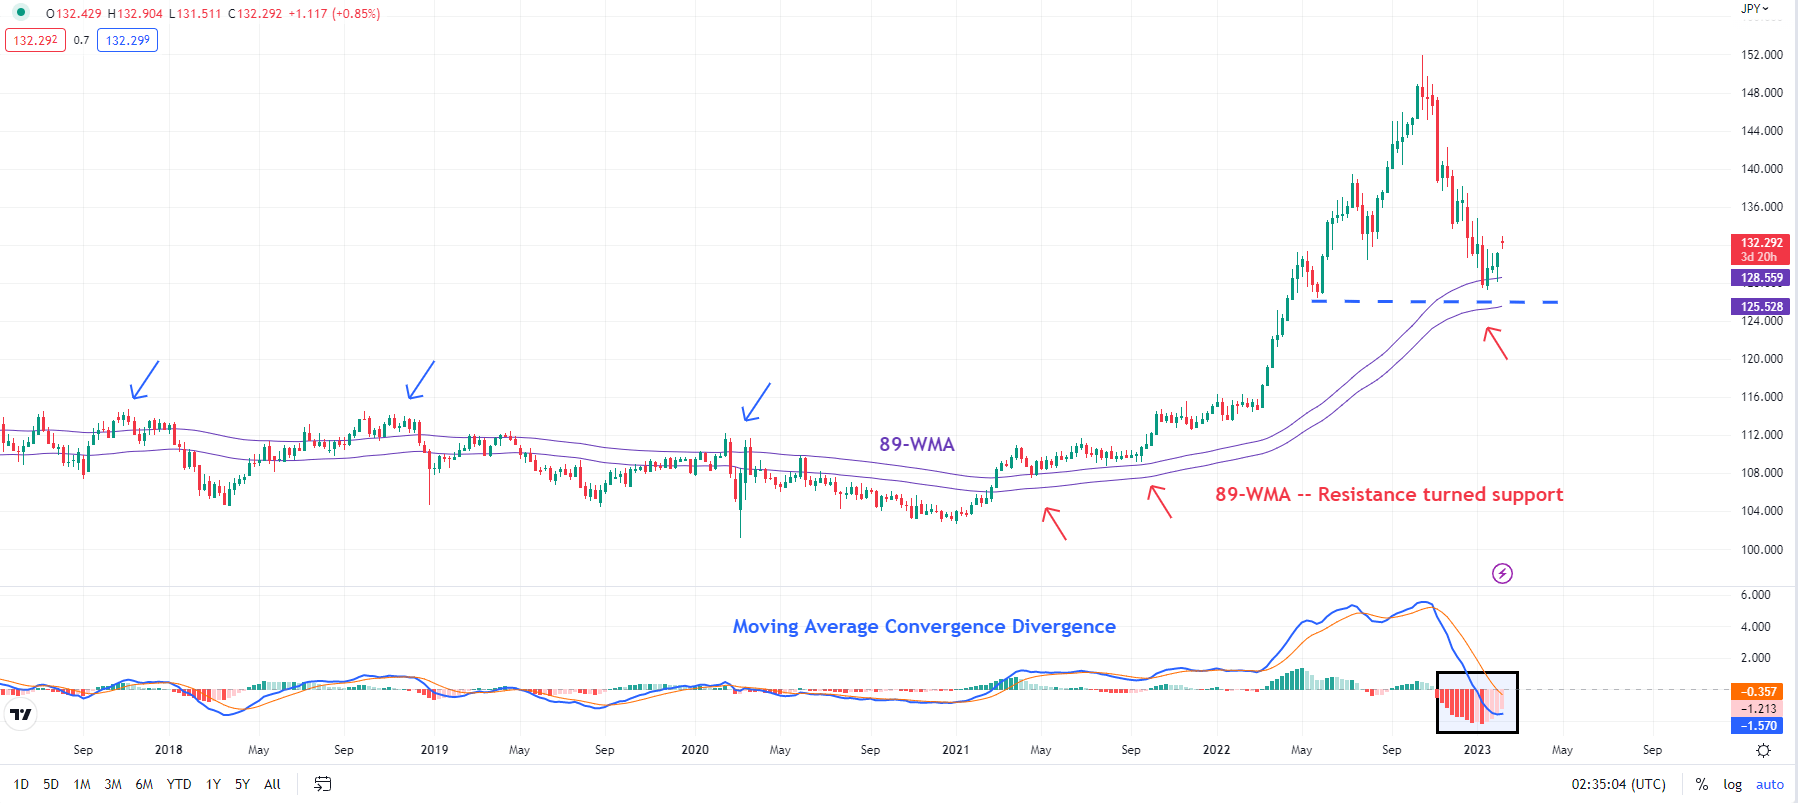
USD/JPY Weekly Chart

image2.png

On technical charts, USD/JPY’s slide has been losing steam in recent weeks,as highlighted in the previous update. The subsequent break above the 89-period moving average on the 240-minute chart, near the upper edge of a declining channel since November, confirms that the three-month-long downward pressure has faded somewhat in the short term (see mid-January updatehighlighting the scenario).

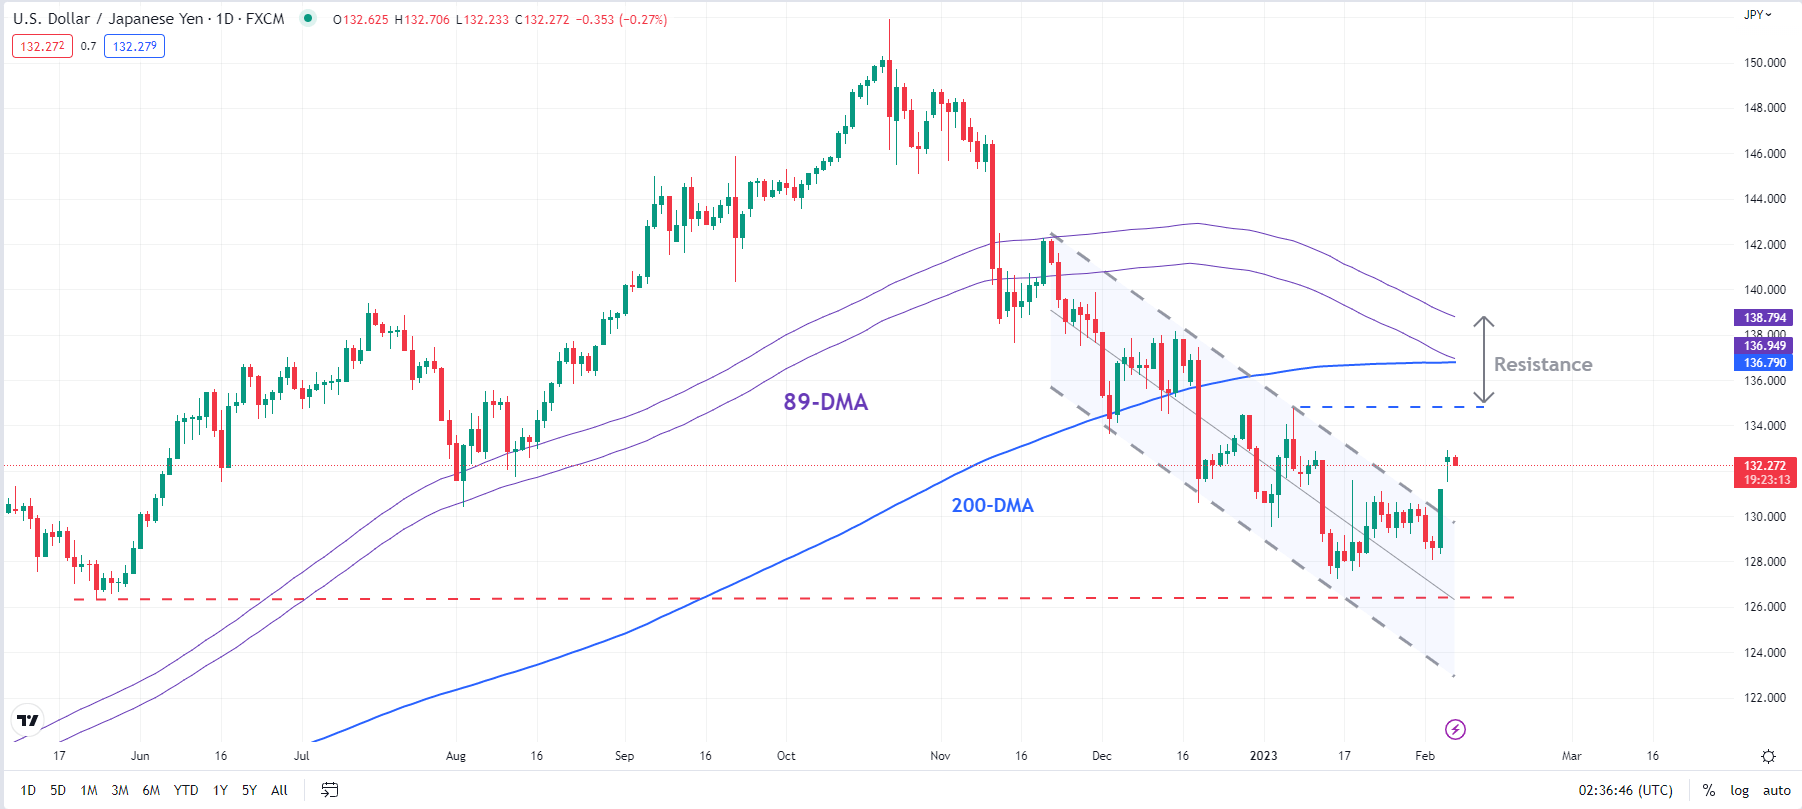
USD/JPY Daily Chart

image3.png

However, zooming out a bit, on the daily chart, the recent bounce looks corrective. Unless USD/JPY is able to clear a stiff barrier at 134.00-137.00, including the 89-day moving average, the 200-day moving average, around the early-January high, the broader trend remains down (see the daily chart).

What the MACD Indicator is and How it Works

What the MACD Indicator is and How it Works

What is MACD?

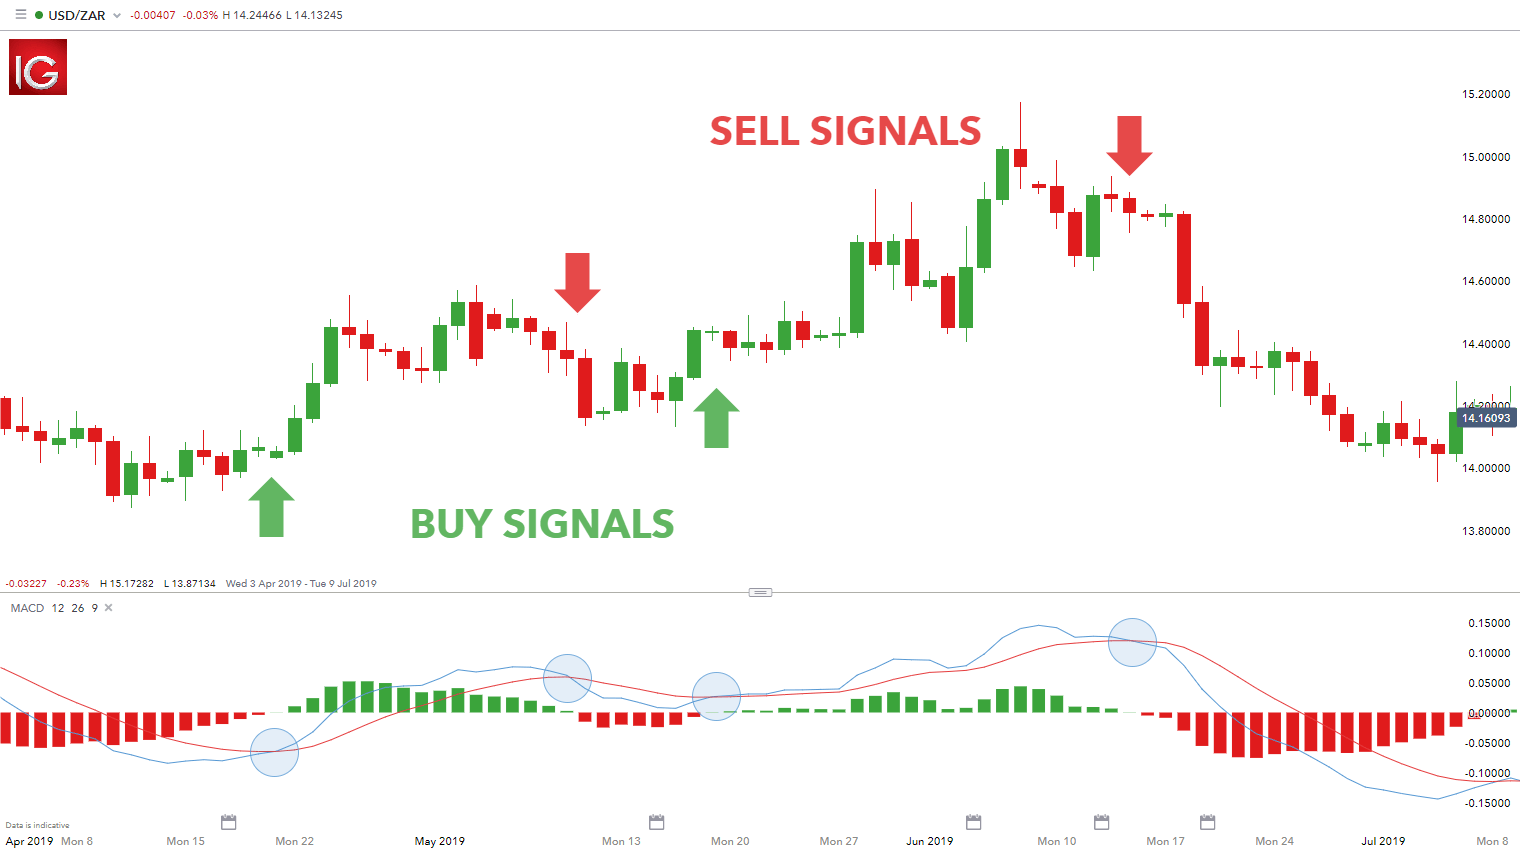
The Moving Average Convergence Divergence (MACD) is a technical indicator which simply measures the relationship of exponential moving averages (EMA).The MACD displays a MACD line (blue), signal line (red) and a histogram (green) – showing the difference between the MACD line and the signal line.

MACD indicator

The MACD line is the difference between two exponentially levelled moving averages – usually 12 and 26-periods, whilst the signal line is generally a 9-period exponentially smoothed average of the MACD line.

These MACD lines waver in and around the zero line. This gives the MACD the characteristics of an oscillator giving overbought and oversold signals above and below the zero-line respectively.

What does MACD measure?

The MACD measures momentum or trend strength by using the MACD line and zero line as reference points:

  • When the MACD line crosses ABOVE the zero line, this signals an UPTREND
  • When the MACD line crosses BELOW the zero line, this signals an DOWNTREND

In addition, the MACD signals buy or sell orders which are given when the two MACD lines cross over as outlined below:

  • When the MACD line crosses ABOVE the signal line, traders use this as a BUY indication
  • When the MACD line crosses BELOW the signal line, traders use this as a SELL indication

USD/ZAR MACD trading signals

How is MACD calculated?

Most charting platforms offer the MACD indicator, and implement this calculation using the aforementioned default periods. The formula below breaks down the varying components of the MACD to make it comfortable for traders to apply.

MACD formula calculation

As mentioned previously, the MACD histogram plots the difference between the two moving average lines. The histogram fluctuates in and around the zero designation on the MACD indicator. When the MACD line is above the signal line, then the histogram will be positive. The opposite is true when the MACD line sits below the signal, whereby the histogram will plot below the zero as a negative value. A zero value on the histogram indicates a crossing over of the two moving average lines thus marking buy/sell signals.

Limitations of MACD

The MACD indicator is considered to work best in trending markets. This limits its use for traders depending on their trading strategies. For example, range bound/consolidating markets will generally give flawed signals when using the MACD. Traders will need to truly understand the MACD as well as when to employ the indicator for optimal use. Novice traders may find this indicator difficult to use initially, which is why going through basic moving average and EMA fundamentals will benefit traders who are looking to make use of the MACD indicator.

The variations that can be implemented with the MACD indicator is almost infinite which makes it very personal to the trader. This subjective nature of the MACD will mean that results differ from trader to trader which take away any consistency. Traders will need to follow a basic outline when using the MACD:

  • Selecting EMA parameters
  • Using an appropriate time frame, as MACD may function differently across time frames

MACD Indicator: A Summary

The MACD is unique in that it serves as an oscillator as well as MACD crossover indicator. This dual purpose gives two signals in one indicator allowing for a less cluttered chart. Traders may find this useful which makes understanding the MACD worthwhile.

Become a Better Trader with Our Trading Tips

  • Learn about other oscillators and indicators to enhance your trading for both beginner and experienced traders:
  1. Relative Strength Index (RSI)
  2. Exponential Moving Average (EMA)
  3. Simple Moving Average (SMA)
  • Technical traders have different  styles  and  forex trading strategies. Explore these thoroughly to find out if this type of analysis suits your personality
  • If you are just starting out on your trading journey it is essential to understand the basics of forex trading in our new to forex guide
US Dollar Bumped by Hawkish Fed and the RBA Joins the Rate Hike Party. Higher USD?

US Dollar Bumped by Hawkish Fed and the RBA Joins the Rate Hike Party. Higher USD?

The US Dollar is treading water so far today after massive gains across the board thanks to Fed commentary for higher rates raising the prospect of a hawkish Fed Chair later today.

Yesterday, Atlanta Fed President Raphael Bostic highlighted that the tight labour market seen in Friday’s data might mean that the peak in rates could be higher than where the market is currently pricing.

Futures and swaps markets are now pricing a 2023 peak in US rates above 5.10%, up from below 4.90% last week.

The comments lifted Treasury yields across the curve with the short end seeing the largest bump. The benchmark 2-year note fell just short of 4.50% in the US session and all bond yields have eased a touch in the Asian session so far today, in line with a softening US Dollar.

Wall Street finished their day lower with the Nasdaq notching a 1% decline. APAC equities have had a quiet day with Australia’s ASX 200 slightly in the red, Japan’s Nikkei 225 fairly flat and Chinese markets scratched out small gains

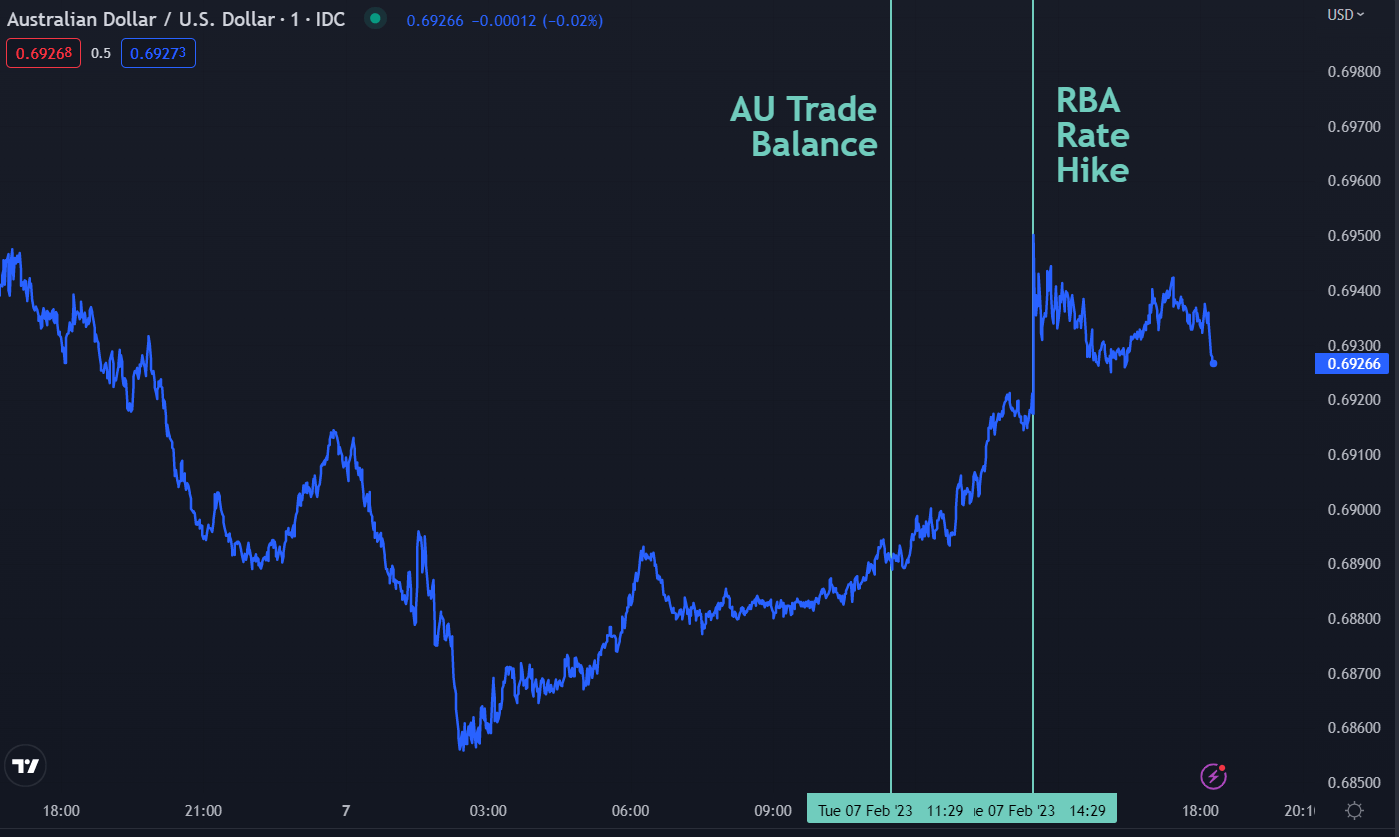
The RBA hiked rates by 25 basis points today in a somewhat pastiche approach to monetary policy after the Fed’s re-acceleration toward hawkishness. The move boosted the Aussie Dollar and has been the biggest gainer against the greenback.

It is being reported that Washington is planning to slap a 200% tariff on Russian Aluminium in the next week or 2.

The Japanese Yen is firmer after solid wage data raised speculation that the Bank of Japan might reconsider its ultra-loose monetary policy stance.

Crude oil is slightly firmer with the WTI futures contract near US$ 74.75 bbl and the Brent contract is a touch above US$ 81.50 bbl. Gold is steady at around US$ 1,875 an ounce at the time of going to print.

In other news, the New York Stock Exchange (NYSE) has agreed to pay 60% of claims from the trading glitch last month.

The focus later today will be Fed Chair Jerome Powell’s speech at the Economic Council in Washington. The very strong labour market, and Bostic’s comments yesterday might have laid the groundwork for stronger hawkish rhetoric from the chief rate setter.

The full economic calendar can be viewed here.

DXY (USD) INDEX TECHNICAL ANALYSIS

The DXY Index is testing the upper band of an ascending trend channel today after it recovered from a seven-month low seen last week.

The 55-day simple moving average (SMA) is just above the trend line and may offer resistance.

Further resistance could be at the prior peaks of 105.63, 105.82, 107.20 and 107.99.

On the downside, support may lie at the breakpoint of 101.30 or down at the previous lows of 100.82, 9957 and 99.42.


US Stocks Battered in the Aftermath of NFP’s – S&P 500, Nasdaq Sink

US Stocks Battered in the Aftermath of NFP’s – S&P 500, Nasdaq Sink

S&P 500, Nasdaq 100 Disheartened by Rate Expectations & USD Strength

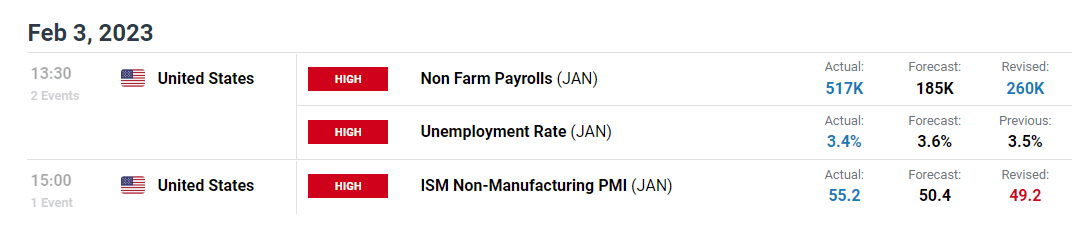
US stock indices have continued to trade lower after Friday’s NFP (non-farm payroll) report sent shivers through the equity market. As the unemployment rate fell to 3.4% (down from 3.5%), an additional 517k jobs were added to the US economy last month (far above the estimated 187k).

Graphical user interface, text, application, email  Description automatically generated

Although the data reflects a resilient economy, it also presents the opportunity for the Federal Reserve to continue to hike interest rates more aggressively.

This places pressure of stocks which have a negative correlation (move in the opposite direction) to rate expectations which favors higher yielding assets.

S&P 500 Technical Analysis

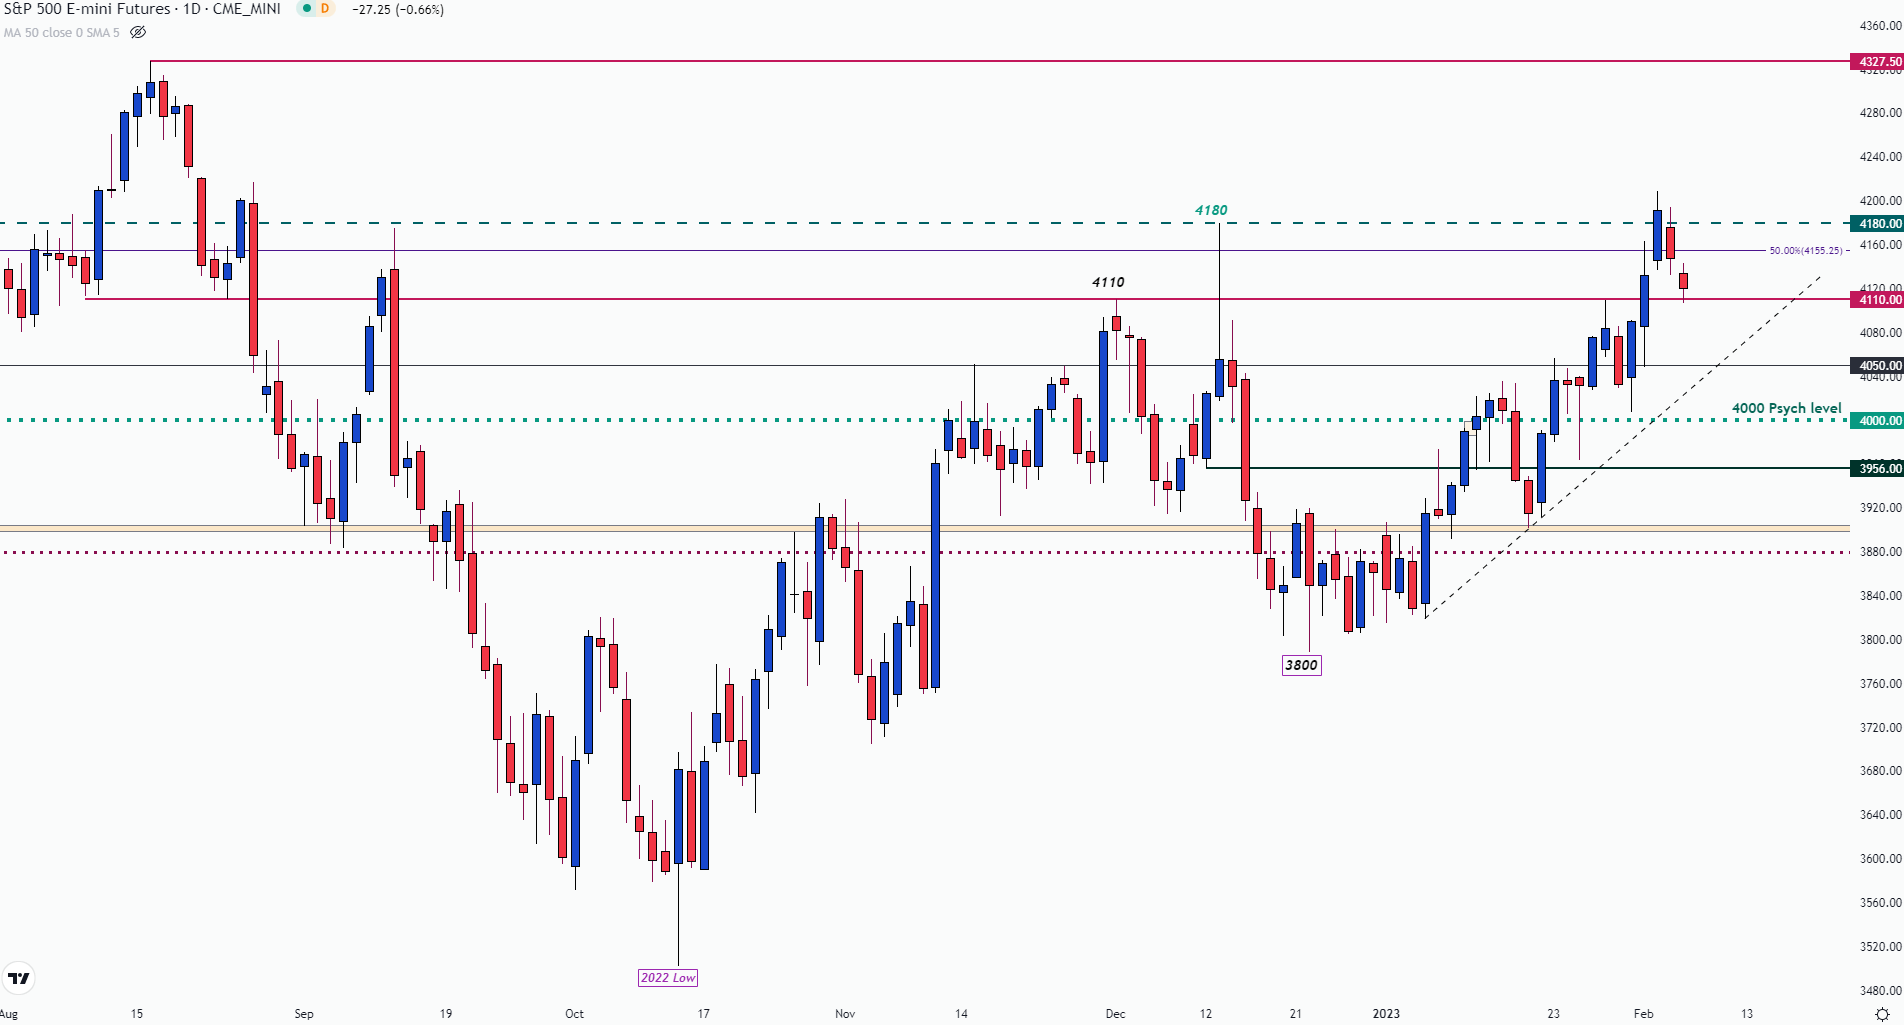
While a softer 0.25% rate hike at last week’s FOMC helped drive S&P futures to a high of 4208.5, the resurgence of USD strength has pushed prices back towards prior resistance at 4110. From the daily chart below, the same level capped the upside move at the beginning of December and held the upper wick of the candlestick on 27 Jan.

S&P (US 500) Futures Daily Chart

A picture containing text, indoor, screenshot  Description automatically generated

With support at prior resistance, a move lower could open the door for the next zone of psychological support at 4000. Meanwhile, the midpoint of the 2022 move has stepped in as immediate resistance around 4155. If bulls break through this barrier, the December 13 high holds at 4180 with a move higher bringing 4200 back into play.

Nasdaq 100 Technical Analysis

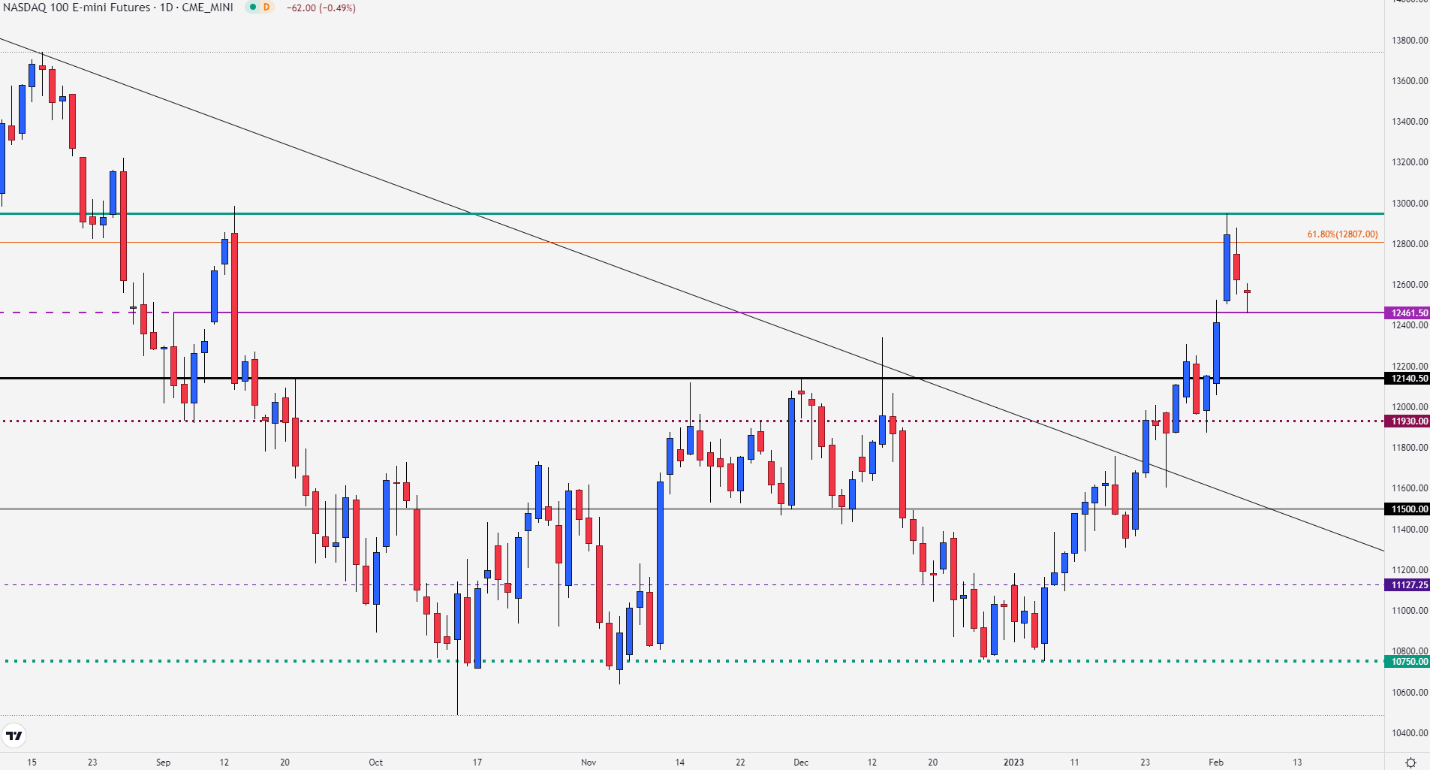
For Nasdaq 100 futures, failure to gain traction above 12950 allowed bears to pressure the uptrend, forcing prices below 12500. With the 12950-handle limiting prior historical moves (last year June and September), this could prove to be a difficult hurdle for bulls.

Nasdaq 100 (US Tech) Daily Chart

Chart, histogram  Description automatically generated


EUR/USD IG Client Sentiment: Our data shows traders are now net-long EUR/USD for the first time since Jan 06, 2023 when EUR/USD traded near 1.06.

EUR/USD IG Client Sentiment: Our data shows traders are now net-long EUR/USD for the first time since Jan 06, 2023 when EUR/USD traded near 1.06.

EUR/USD Client Positioning

Number of traders net-short has decreased by 25.77% from last week.

SYMBOL TRADING BIAS NET-LONG% NET-SHORT% CHANGE IN LONGS CHANGE IN SHORTS CHANGE IN OI
EUR/USD BEARISH 50.00% 50.00% 9.54% Daily

16.69% Weekly

3.71% Daily

-25.77% Weekly

6.54% Daily

-9.26% Weekly

EUR/USD: Retail trader data shows 50.00% of traders are net-long with the ratio of traders long to short at 1.00 to 1. In fact, traders have remained net-long since Jan 06 when EUR/USD traded near 1.06, price has moved 1.40% higher since then. The number of traders net-long is 9.54% higher than yesterday and 16.69% higher from last week, while the number of traders net-short is 3.71% higher than yesterday and 25.77% lower from last week.

We typically take a contrarian view to crowd sentiment, and the fact traders are net-long suggests EUR/USD prices may continue to fall.

Our data shows traders are now net-long EUR/USD for the first time since Jan 06, 2023 when EUR/USD traded near 1.06. Traders are further net-long than yesterday and last week, and the combination of current sentiment and recent changes gives us a stronger EUR/USD-bearish contrarian trading bias.

Hawkish vs Dovish: How Monetary Policy Affects FX Trading

Hawkish vs Dovish: How Monetary Policy Affects FX Trading

You have probably heard a financial news presenter say something along the lines of “The central bank governor came out slightly hawkish today after bouts of strong economic data”. The terms Hawkish and Dovish refer to whether central banks are more likely to tighten (hawkish) or accommodate (dovish) their monetary policy.

Central bank policy makers determine whether to increase or decrease interest rates, which have significant impact on the forex market. Policy makers increase interest rates to prevent an economy from overheating (to prevent inflation from going too high) and they decrease interest rates to stimulate an economy (to prevent deflation and stimulate GDP growth).

Hawkish and dovish policies affect currency rates through a mechanism central bankers like to call “forward guidance”. This is policy makers trying to be as transparent as possible in their communications to the market about where monetary policy may be heading.

Keep reading to learn more about hawkish and dovish policies and how to apply this knowledge to your forex trades.

What does hawkish mean?

The term hawkish is used to describe contractionary monetary policy. Central bankers can be said to be hawkish if they talk about tightening monetary policy by increasing interest rates or reducing the central bank’s balance sheet. A monetary policy stance is said to be hawkish if it forecasts future interest rate increases. Central bankers can also be said to be hawkish when they are positive about the economic growth outlook and expect inflation to increase.

Currencies tend to move the most when central bankers shift tones from dovish to hawkish or vice versa. For example, if a central banker was recently dovish, stating that the economy still requires stimulus and then, in a later speech, stated that they have seen inflation pressures rising and strong economic growth, you could see the currency appreciate against other currencies.

Some words that could be used describing a hawkish monetary policy include:

  • Strong economic growth
  • Inflation increasing
  • Reducing the balance sheet
  • Tightening of monetary policy
  • Interest rate hikes

Generally, words used that indicate increasing inflation, higher interest rates and strong economic growth lean towards a more hawkish monetary policy outcome.

What does dovish mean?

Dovish refers to the opposite. When central bankers are talking about reducing interest rates or increasing quantitative easing to stimulate the economy they are said to be dovish. If central bankers are pessimistic about economic growth and expect inflation to decrease or become deflation and they signal this to the market through their projections or forward guidance, they are said to be dovish about the economy.

Some words that could be used to describe a dovish monetary policy, include:

  • Weak economic growth
  • Inflation decreasing/deflation (negative inflation)
  • Increasing the balance sheet
  • Loosening of monetary policy
  • Interest rate cuts

Hawkish vs Dovish Explained

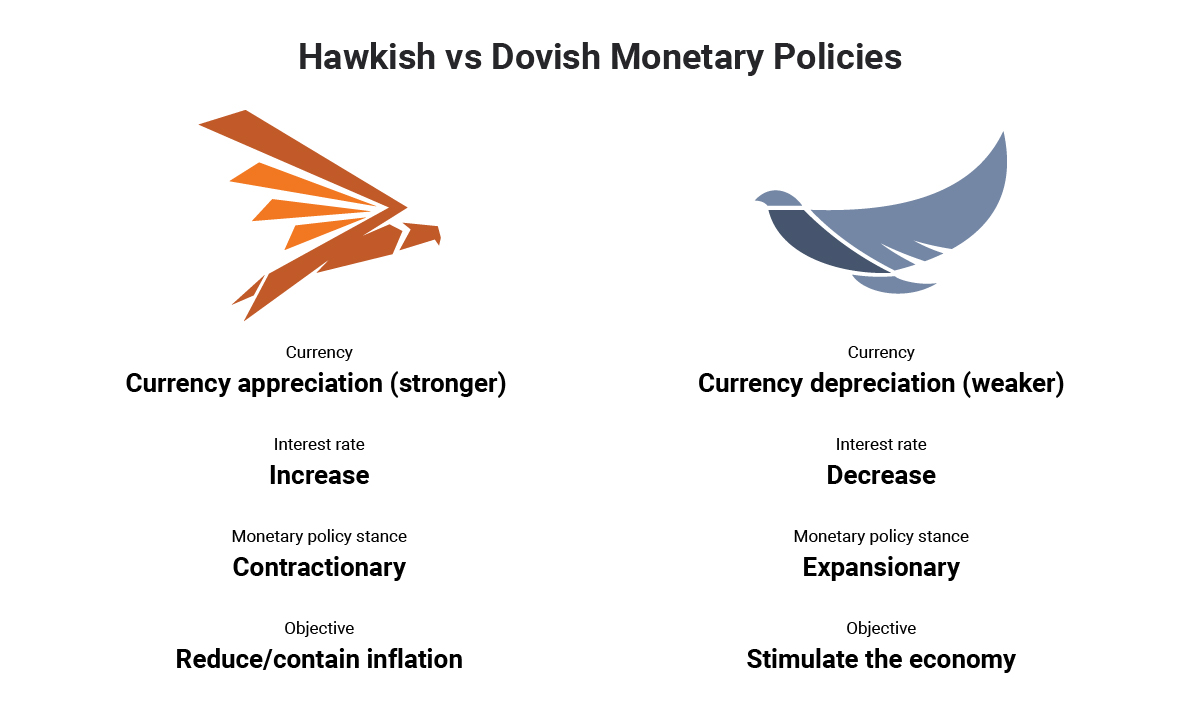
The below graphic provides a snapshot of the main differences between hawkish and dovish monetary policy:
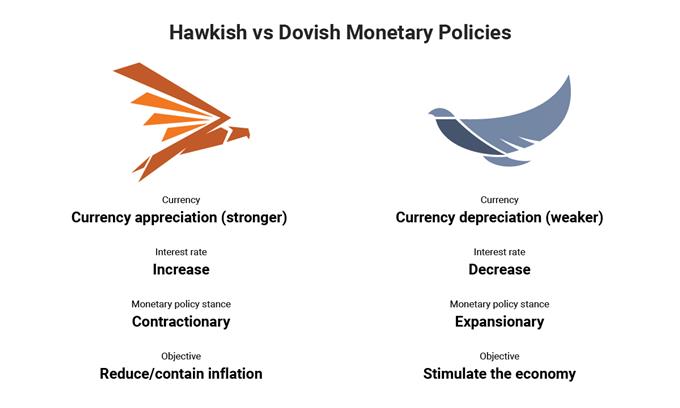
hawkish vs dovishThe table below provides a more in depth comparison on dovish vs hawkish monetary policies, highlighting the differences between the two and how they impact currencies.

Hawkish monetary policies Dovish monetary policies
Increasing interest rates to stem inflation pressures

→ Currency could appreciate as capital flows to higher interest rate currency

Decreasing interest rates to stimulate the economy

→ Currency could depreciate as capital flows to a lower interest rate currency

Reducing the Federal Reserve balance sheet by selling mortgaged backed securities (MBS) and treasuries

→ Currency could appreciate as selling of treasuries and MBS could increase interest rates

Increasing the Federal Reserve balance sheet through quantitative easing (QE). QE is the purchasing of MBS and treasuries that increase the money supply in the economy to stimulate it.

→ Currency could depreciate as an increase in money supply decreases demand for the currency

Forward guidance from central banks include positive statements about the economy, economic growth, and inflation outlook.

→ Currency could appreciate as investors forecast further interest rate hikes

Forward guidance from central banks include negative statements about the economy, economic growth, and signs of deflation.

→ Currency could depreciate as investors forecast interest rate cuts

How to trade a Hawkish or Dovish Central Bank

A slight shift in tone from a central banker could have drastic consequences for a currency. Traders often monitor Federal Open Market Committee meetings and minutes to look for slight changes in language that could suggest further rate hikes or cuts and attempt to take advantage of this.

Monetary policy leaning dovish to hawkishMonetary policy standing as at 1 January 2019

The image above shows the different central banks current monetary policy stance. When a central banks’ monetary policy stance moves more towards the left (dovish) their currency could depreciate against other currencies. If the monetary policy stance moves more towards the right (hawkish) their currency could appreciate.

Trading a hawkish or dovish central bank isn’t as easy as buying a hawkish central bank currency or selling a dovish central bank currency. It has to do with changing interest rate expectations. Let’s look at two scenarios:

Scenario 1:

If a central bank is currently in a rate hiking cycle, the market will have already forecasted future interest rate hikes. It is the job of the trader to watch for clues and economic data that could shift the tone of the central bank to either more hawkish than currently, or to dovish. Currencies could move a large amount when the monetary tones shift from what they are currently.

Scenario 2:

Likewise, if a central bank is currently cutting rates and economic data hasbeen negative, the market would have priced-in the current dovish monetary stance. Traders would have to watch the central bankers forward guidance and economic data, which you can find on an economic calendar, for clues to whether they may become more dovish than currently, or hawkish.

In late 2018 the federal reserve was quite hawkish. Federal Reserve Chairman, Jerome Powell, stated that “we’re a long way away from neutral at this point” which the market perceived as hawkish (2 Oct 2018). This implied that the Federal Reserve still had to hike rates many more times to get to the neutral rate. Then on the 28th of November, the FOMC released their statement of monetary policy in which Jerome Powell said he saw rates at “just below neutral”. This shift in tone is like scenario 1 above, where the central banks shifts tone from hawkish to slightly dovish. Leading to a depreciation of the currency- see the charts below that show what happened to the Dollar Index (DXY) on the October 2, 2018 and then on the November 28, 2018.

October 2, 2018 – Federal Reserve Chairman, Jerome Powell says “We’re a long way away from neutral at this point” leading to appreciation of the Dollar.

15min US Dollar index chart, vertical line indicating October 2, 2018.
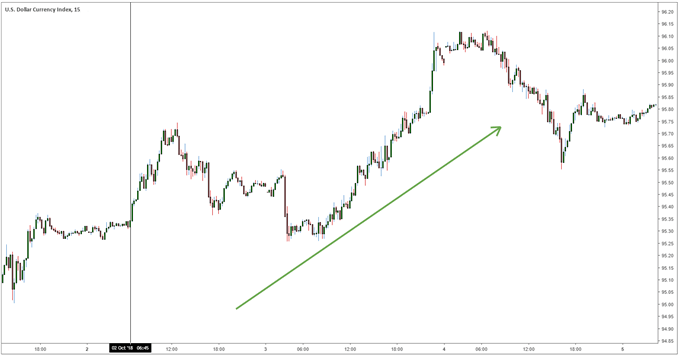
2nd October Federal Reserve chairman states that rates are a far away from neutralNovember 28, 2018 Federal Reserve Chairman says that interest rates are “just below neutral” indicating a shift in tone from hawkish to dovish. Dollar depreciations.

15min USD Dollar index chart
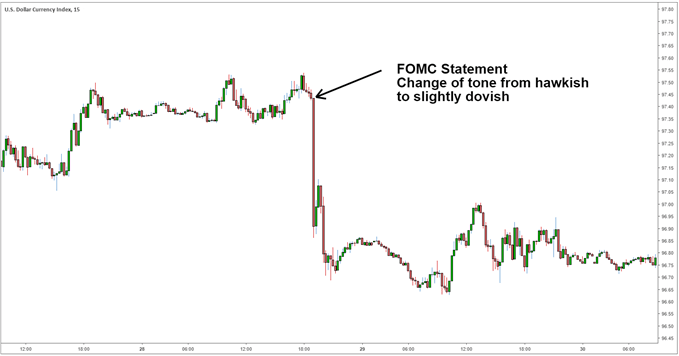
Federal reserve chairman Jerome Powell states that rates are just below neutralKeeping up to date with central banks can be difficult. At DailyFX we have a Central Bank Weekly Webinar where we analyze central bank decisions and keep you up to date with central bank activity.

If you are just starting out on your trading journey it is essential to understand the basics of forex trading in our New to Forex guide. We also offer a range of trading guides to supplement your forex knowledge and strategy development.

Senior Analyst, Tyler Yell of DailyFX sat down with former Federal Reserve Advisor, Danielle Dimartino Booth in a podcast that covered global central bank developments and Danielle’s biggest lesson she learned as a Fed insider.

EUR/USD Technical Outlook: Short-term Setback

EUR/USD Technical Outlook: Short-term Setback

EUR/USD SHORT-TERM TECHNICAL FORECAST – NEUTRAL

The sharp fall toward the end of last week could be a sign that the Euro’s four-month-long rally is losing steam.

EUR/USD dropped after US jobs and services data beat expectations, leading to a repricing higher in US rate expectations. Rate futures now indicate the Fed to hike at least two more rate hikes, taking the benchmark to above 5%. Before Friday’s data, the market was expecting the benchmark rate to peak below 5%.

image1.png

This follows a 25 basis points hike by the US Federal Reserve and a 50 basis points hike by the European Central Bank (ECB) last week. While the Fed acknowledged early signs of disinflation, Chair Powell said the central bank could conduct a few more rate hikes to bring down inflation to its target. The ECB, on the other hand, maintained its hawkish stance. On balance, while ECB wasn’t incrementally hawkish, the Fed wasn’t as dovish as some had expected, weighing on EUR/USD.

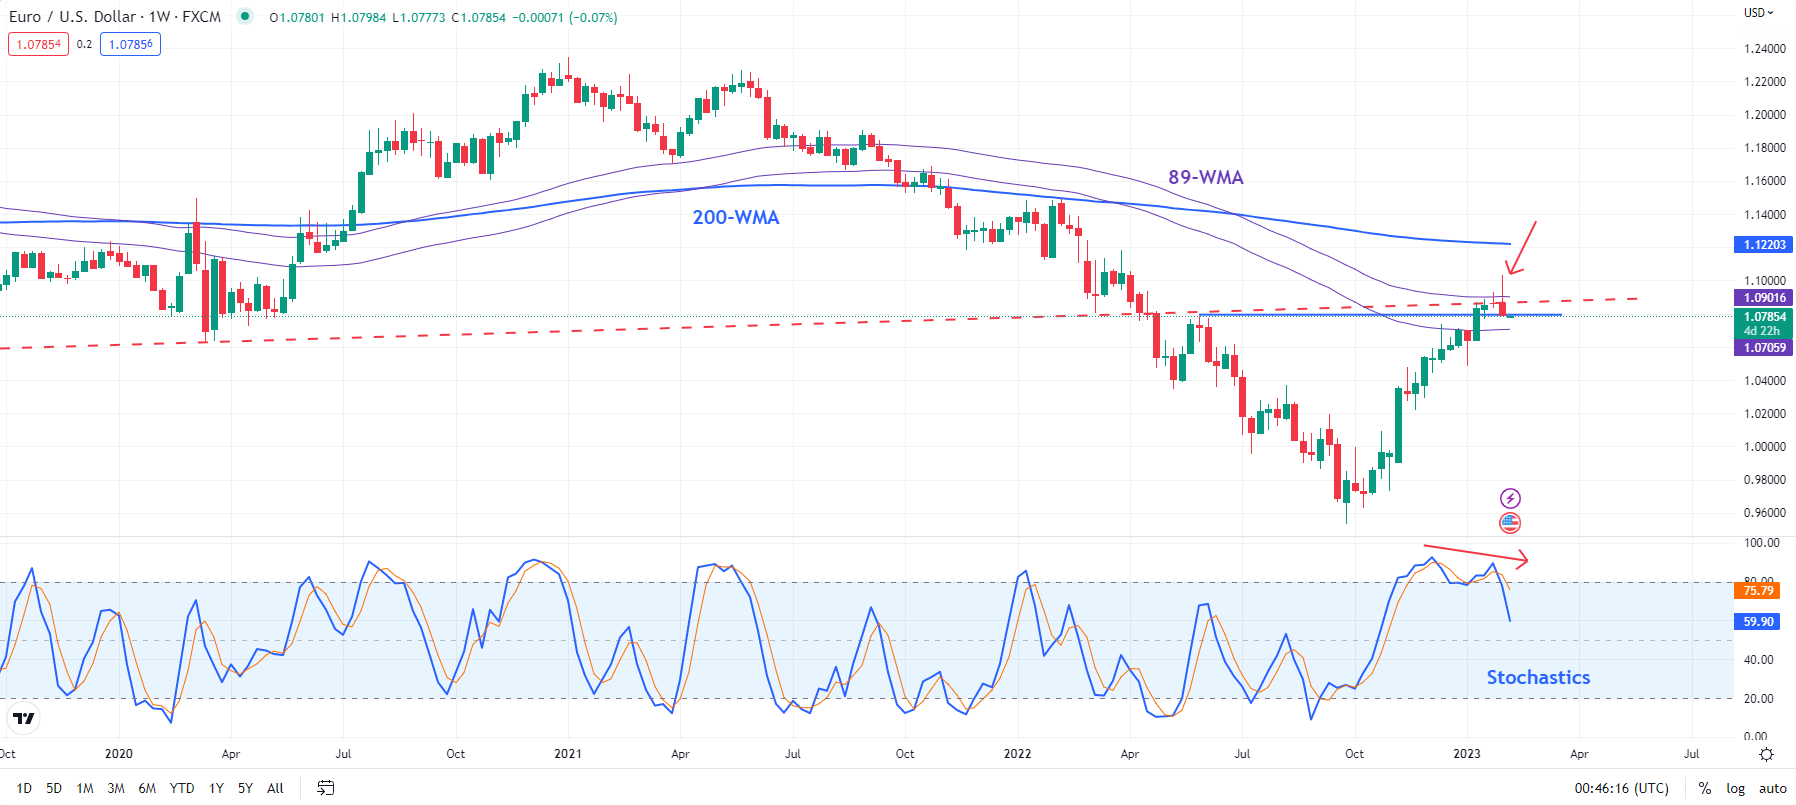
EUR/USD Weekly Chart

image2.png

On technical charts, EUR/USD had been struggling to extend gains in recent weeks ahead of stiff resistance around 1.0900, including the 89-week moving average and a slightly upward-sloping trendline from 2017,as pointed out a couple of weeks ago. Moreover, a negative momentum divergence on the daily and weekly charts (softening Stochastics as the spot has made new highs) raised the odds of a pause/minor setback in the near term, as highlighted last week.

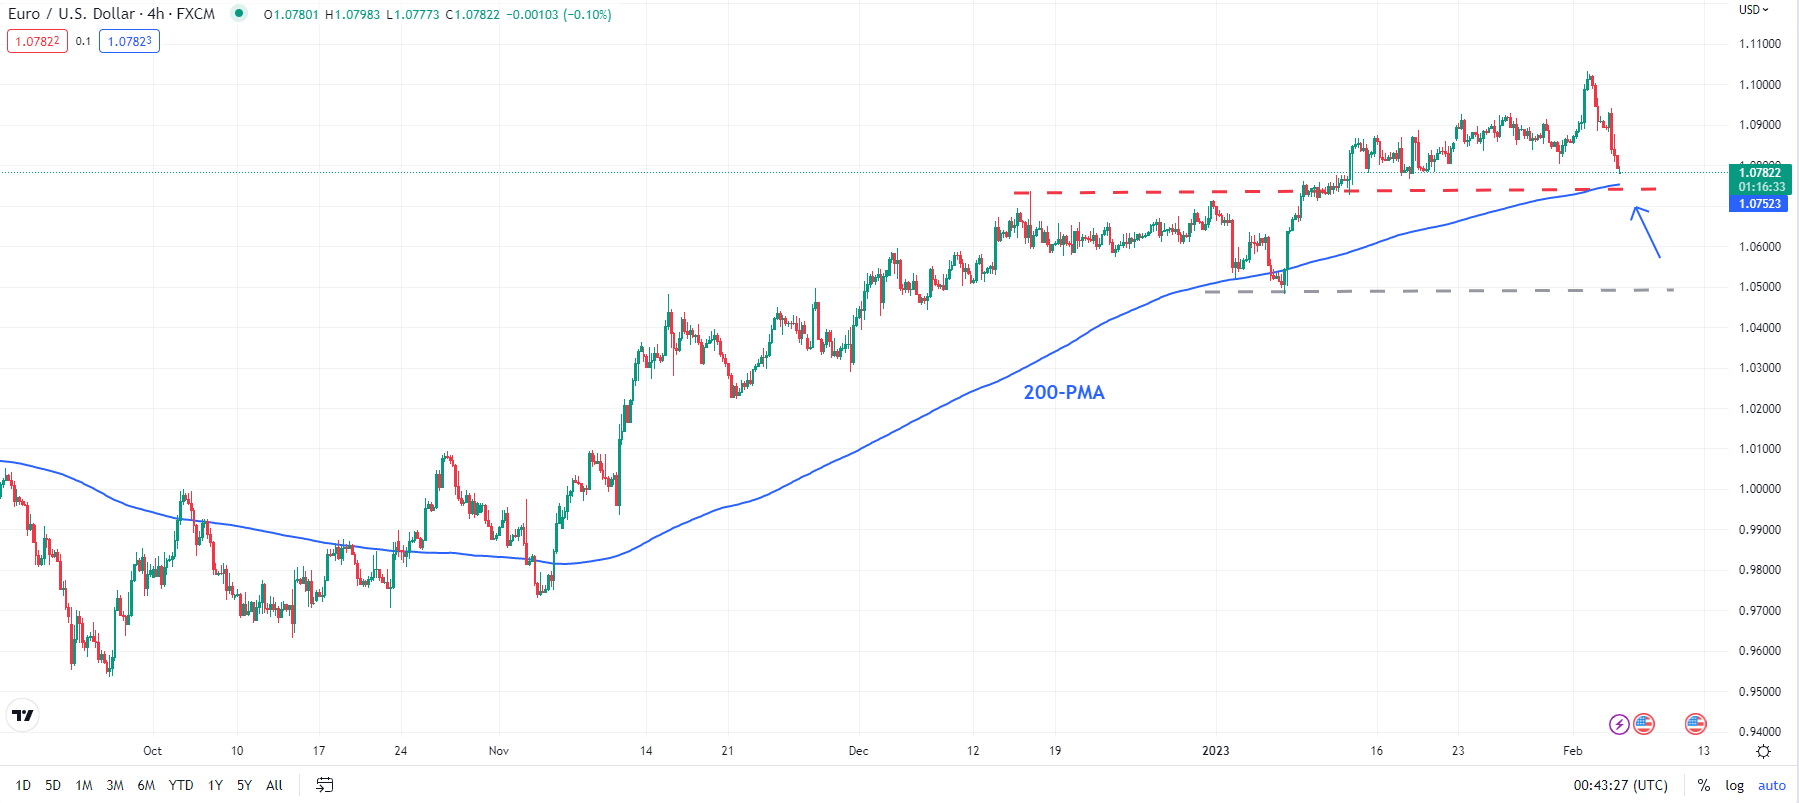
EUR/USD Daily Chart

image3.png

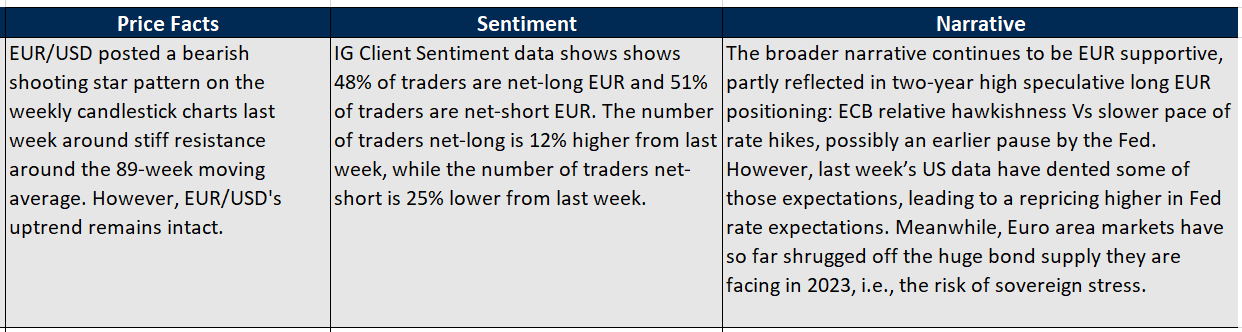
EUR/USD posted a bearish shooting star pattern on the weekly candlestick charts and is now approaching important support at about 1.0700-1.0750 (see the 240-minute chart). EUR/USD hasn’t been able to decisively break below the 200-period moving average on the 240-minutes charts, suggesting that 1.0700-1.0750 could be tough to break, at least in the first attempt.

However, any break below the support would confirm that the upward pressure had faded, pointing to the possibility of an extended range in the short term. Subsequent support is at the January low of 1.0480. Strong support is on the 200-day moving average (now at about 1.0320). The uptrend since late 2022 is unlikely to reverse while EUR/USD holds above the long-term moving average.

Australian Dollar Tanks as US Dollar Roars Back to Life Ahead of RBA. Lower AUD/USD?

Australian Dollar Tanks as US Dollar Roars Back to Life Ahead of RBA. Lower AUD/USD?

The Australian Dollar collapsed on Friday after blistering US non-farm payrolls (NFP) data lifted the US Dollar.

The statistics revealed a US labour force that is running hot, and the market was forced to recalibrate expectations for the peak in the Federal Reserve’s rate hike cycle.

517k jobs were added in January according to the US Bureau of Labour Statistics, way above the 188k anticipated and last month’s read of 223k was also revised up to 260k. This put the unemployment rate at 3.4%, below the 3.6% forecast and 3.5% previously.

With the Fed now seen to be tightening further than previously thought, equity markets and risk assets, in general, are under pressure to start the week.

AUD/USD is in the thick of the melee along with many of the commodities that Australia export. Namely gold, copper and iron ore. The rolling over is apparent in the chart below when the greenback launched highe

With the Fed now poised to take rates higher, the focus will be on Fed Chair Jerome Powell when he speaks on Tuesday.

Last week at the post-Federal Open Market Committee (FOMC) meeting press conference, the market interpreted his remarks as less hawkish than he has been previously.

In light of the NFP data, his commentary will be closely scrutinised for clues on how far rates need to be boosted to rein in inflation.

Before he speaks, the RBA will have made their decision on the cash rate. Futures are pricing a 25 basis point hike. Similar to the Fed, the focus will turn to Governor Philip Lowe and his remarks post-decision.

Australian CPI is an uncomfortable 7.8% year-on-year to the end of 2022, well above the mandated target range of 2-3%. They previously said that they expected inflation to hit 8% by the end of 2023.

The re-acceleration of price pressures into the end of last year will not sit well with the board and it might be possible that they will need to turn more hawkish. Should this unfold, it could have implications for the Aussie Dollar.

CHART – AUD/USD, COPPER, GOLD, IRON ORE (SGX), DXY (USD) INDEX


image1.png


Natural Gas Price Forecast: 7 Weeks of Losses, Momentum Shows Few Signs of Slowing

Natural Gas Price Forecast: 7 Weeks of Losses, Momentum Shows Few Signs of Slowing

Weekly Chart – Prices Plunge for a 7th Week

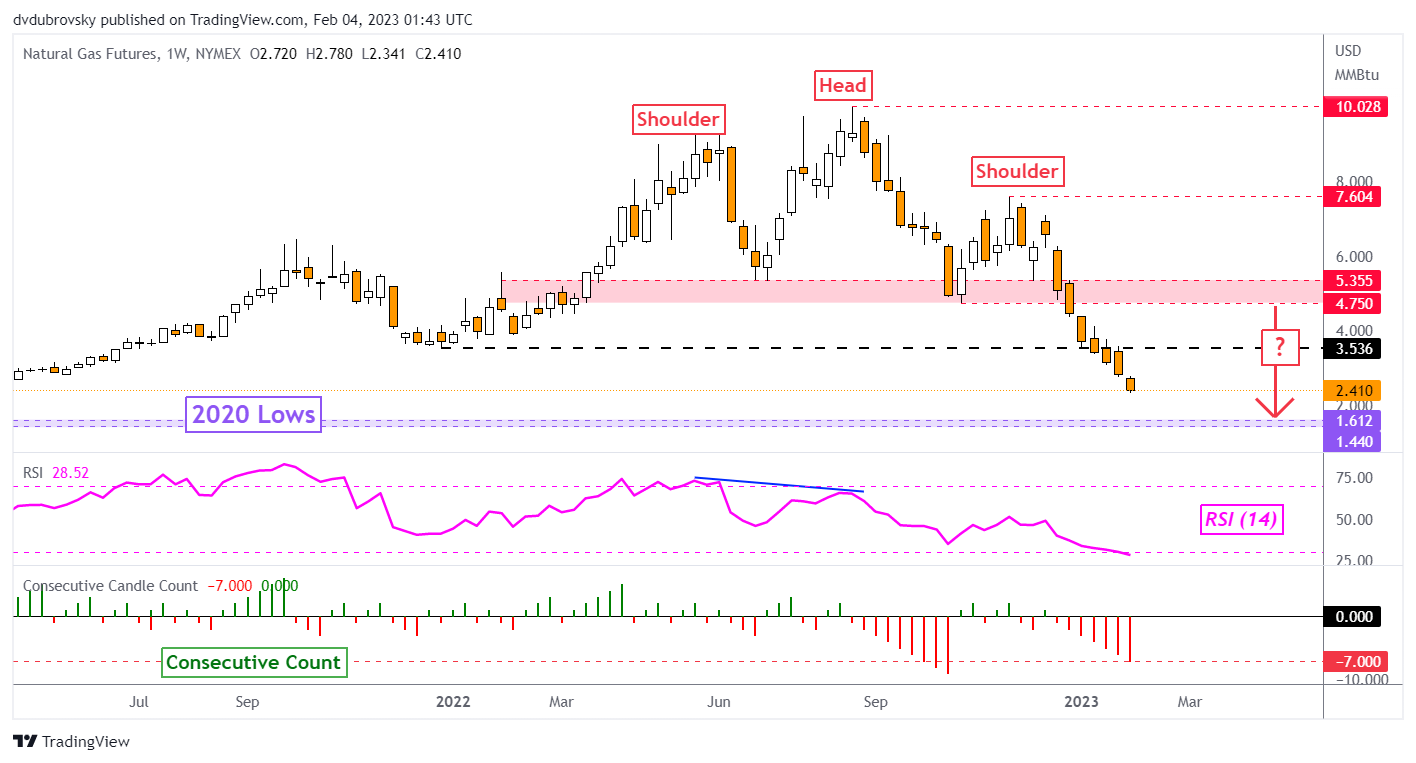
Natural gas prices are down 46.15% since the beginning of this year. If losses hold throughout February, the heating commodity will be looking at its worst 2-month performance since 2001! This past week alone was the 7th consecutive decline, marking the longest losing streak since the beginning of October. Natural gas fell 15.41% last week amid a milder United States weather upgrade.

Looking at the chart below, prices are continuing lower in the direction of the bearish Head & Shoulders implied target. If natural gas follows the outlook of the chart formation, we could see prices reach lows from 2020. That makes for a range of support between 1.44 and 1.61. Let us take a closer look at the daily chart to see what are key levels to watch in the week ahead.

Weekly Chart – Prices Plunge for a 7th Week

Chart Created Using TradingView

Daily Chart – Another Doji Emerges

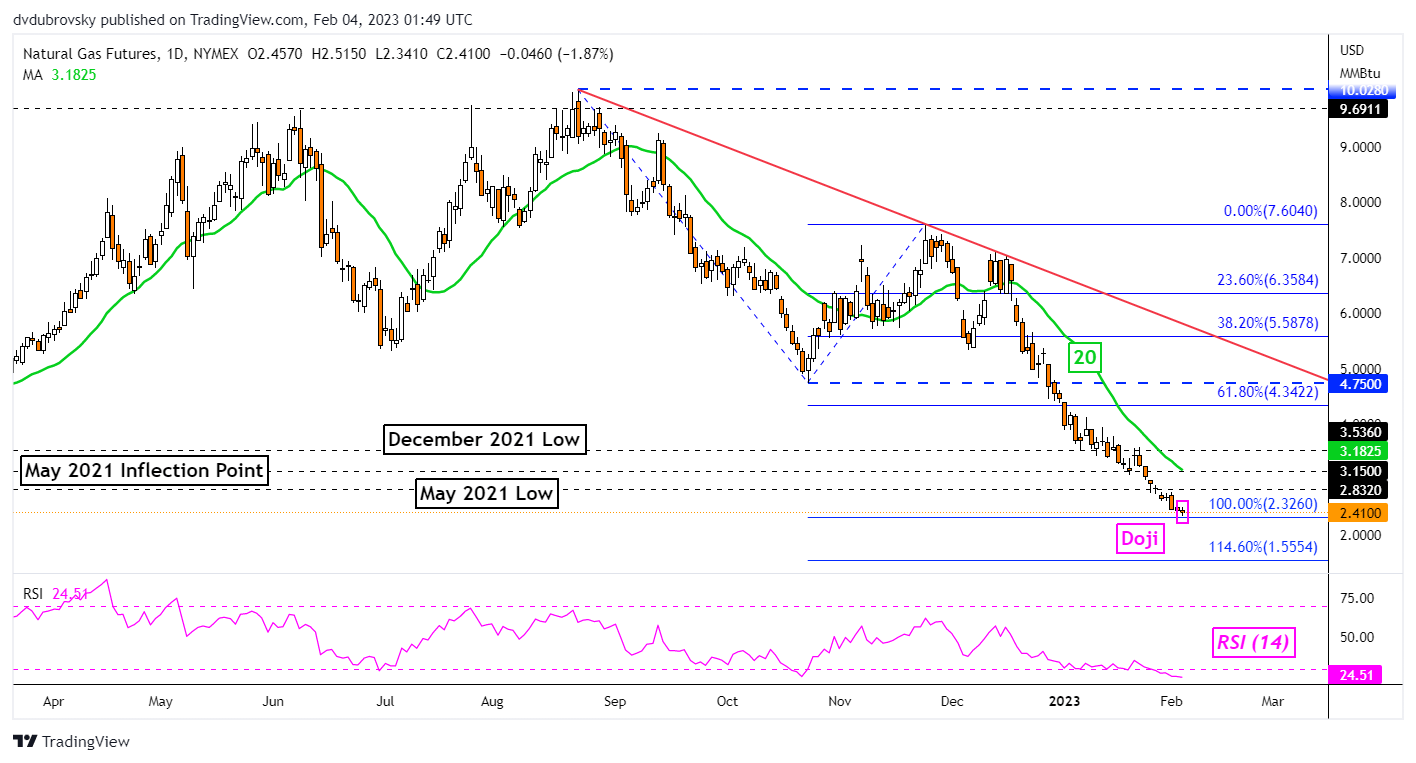
Another Doji candlestick pattern made itself present after prices closed on Friday. This is not the first time we have seen a Doji in a while. In fact, something like the latter has appeared on numerous occasions throughout the most recent downtrend since December. The Doji is a sign of indecision, not necessarily a reversal warning.

What matters is after the Doji. Upside follow-through could be an increasing sign of a turn higher. At this time, momentum is favoring the downside given a lack of RSI divergence. Prices now face immediate support which is the 100% Fibonacci extension level at 2.326. A confirmatory breakout under this price exposes the 114.6% level at 1.555.

In the event of a turn higher, keep a close eye on the 20-day Simple Moving Average (SMA). The latter is helping maintain the near-term downside focus. It may hold as resistance, pivoting natural gas back lower. Otherwise, extending gains would place the focus on the December 2021 low at 3.536. The latter may establish itself as new resistance.

Daily Chart – Another Doji Emerges

EUR/USD Forecast: No Let Up for Euro Post-NFP, What Fed Pivot?

EUR/USD Forecast: No Let Up for Euro Post-NFP, What Fed Pivot?

EURO FUNDAMENTAL BACKDROP

The euro really suffered at the hands of the USD last week post-Non-Farm Payrolls (NFP) which showed a significant rise in jobs (517000) for January over the expected figure (188000) thus reinforcing the tight labor market in the U.S..

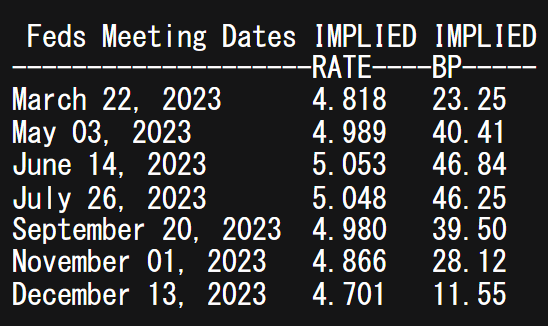
Money markets have already pushed the 2023 Fed terminal rate up above 5% for the first time in many weeks (see table below), now underpinning what the Fed has been saying all this time? Leading up to the Fed’s interest rate decision last week, guidance from the majority of Fed officials have been rather hawkish with frequent reference to the 5% mark however, at the time markets had dismissed any such counsel leaving upbeat releases on data points open to large upward swings in the greenback.

FEDERAL RESERVE INTEREST RATE PROBABILITIES

image1.png

The day ahead looks to be centered around the eurozone with retail sales data and yet another address from the ECB’s President Christine Lagarde. It is likely we will receive more aggressive talk from Lagarde citing higher core inflation and growth(GDP) forecasts within the region but it could be too early to impact a surging dollar.

EUR/USD ECONOMIC CALENDAR

image2.png

Source: DailyFX economic calendar

Throughout the week, attention will be largely directed to Fed officials who are scheduled to speak throughout. Hawks will surely come out in force but it will be interesting to see how less aggressive individuals react to the recent data.

This Monday also involves a hint of risk-off sentiment stemming from U.S.-China tensions after the U.S. shot down an alleged Chinese spy balloon so it will be important to monitor the situation closely as any further escalation could bolster the greenback.

TECHNICAL ANALYSIS

EUR/USD WEEKLY CHART

image3.png

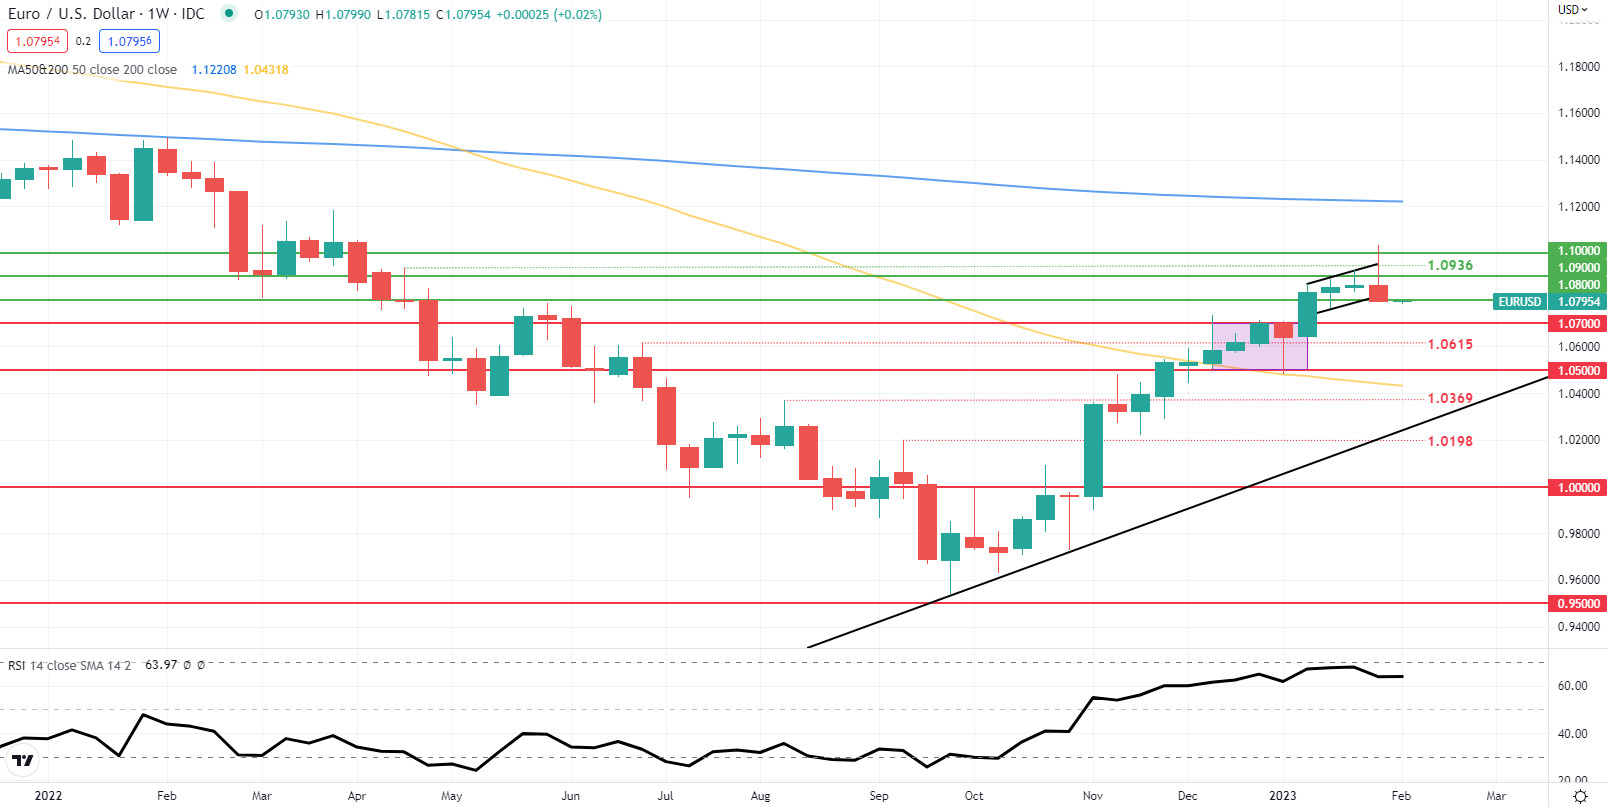
The EUR/USD weekly chart above shows price action hovering around overbought territory as indicated by the Relative Strength Index (RSI). Last week’s candle closed with a long upper wick that traditionally points to subsequent downside leaving support zones in danger of being breached.

EUR/USD DAILY CHART

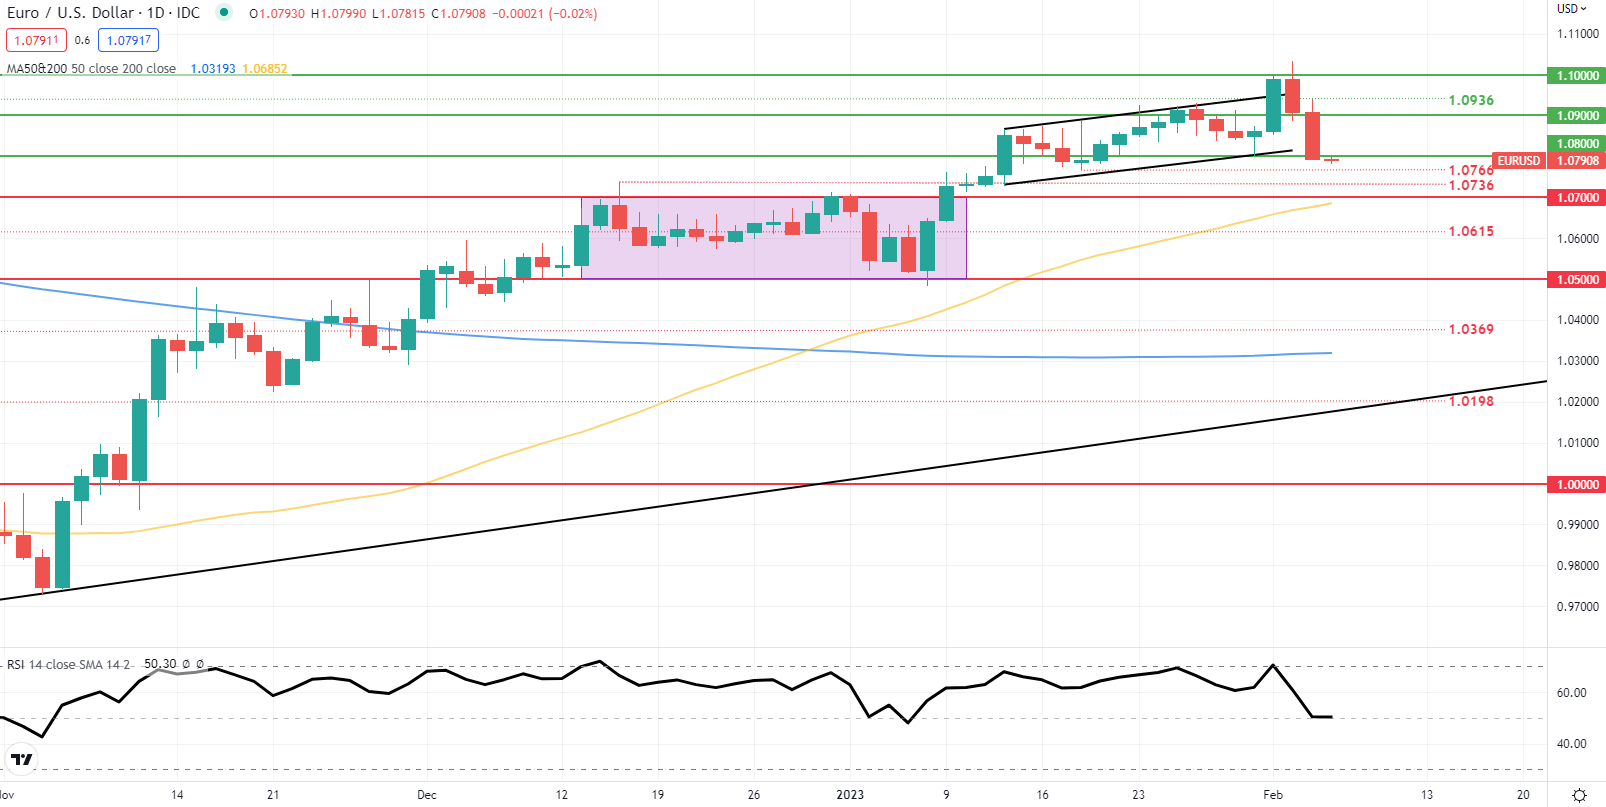
image4.png

The shorter-term daily chart emphasizes the recent break below the 1.0800 psychological handle and today’s candle close could point to a near-term directional bias. A close below 1.0800 could find the euro slipping down towards 1.0700 and possibly testing the 50-day SMA as well (yellow).