US Dollar Slides as SVB Repercussions Stalled by the Fed and the Treasury Department

US Dollar Slides as SVB Repercussions Stalled by the Fed and the Treasury Department

The US Dollar is under the pump to start the week as uncertainty from the fallout of the collapse of Silicon Valley Bank (SVB) permeates markets.

Signature Bank also fell into receivership over the weekend, but the Federal Reserve and the US Treasury Department have moved swiftly to provide a backstop to minimise contagion.

Nonetheless, everything from credit default swaps to Asian tech companies to Argentinian bonds is facing scrutiny today.

While the greenback is under pressure, Wall Street futures are notching up gains as the market appears to be comfortable at this stage with the steps that authorities have taken so far.

Most notably, authorities have reassured depositors at these banks that they will be able to withdraw their money and that the Federal Reserve will provide liquidity for eligible financial firms.

The Federal Reserve announced that “it will make available additional funding to eligible depository institutions to help assure banks can meet the needs of all their depositors.”

Furthermore, they said, “additional funding will be made available through the creation of a new Bank Term Funding Program (BTFP), offering loans of up to one year in length to banks, savings associations, credit unions, and other eligible depository institutions pledging U.S. Treasuries, agency debt and mortgage-backed securities, and other qualifying assets as collateral.”

Authorities have made it clear that any government assistance will be going to depositors and will not be used to bail out bond or equity investors.

The Treasury Department has recognised that other banks are in a similar position as SVB and Signature Bank, but they have said that it is a very different situation to 2008.

US President Joe Biden will be speaking on Monday morning US time on the SVB situation, and his administration will be briefing Congress.

This episode has disrupted the outlook for rates going forward ahead of next week’s Federal Open Market Committee (FOMC) meeting on the 22nd of March. The market had previously been leaning toward a 50 basis point hike but now sees 25 bp as more likely.

To complicate matters, the Fed has gone into a blackout period, meaning that board members will not be making any public comments until after the meeting.

Expectations of the terminal rate of the Fed funds target rate have been lowered from near 5.70% last week to around 5.13% today. The 2s 10s yield curve is inverted by only -75 bp, more than 30 bp tighter than last Wednesday.

The strong US jobs numbers on Friday paled against the small banking crisis and US CPI on Tuesday may not have the impact on the FOMC meeting that it previously would have.

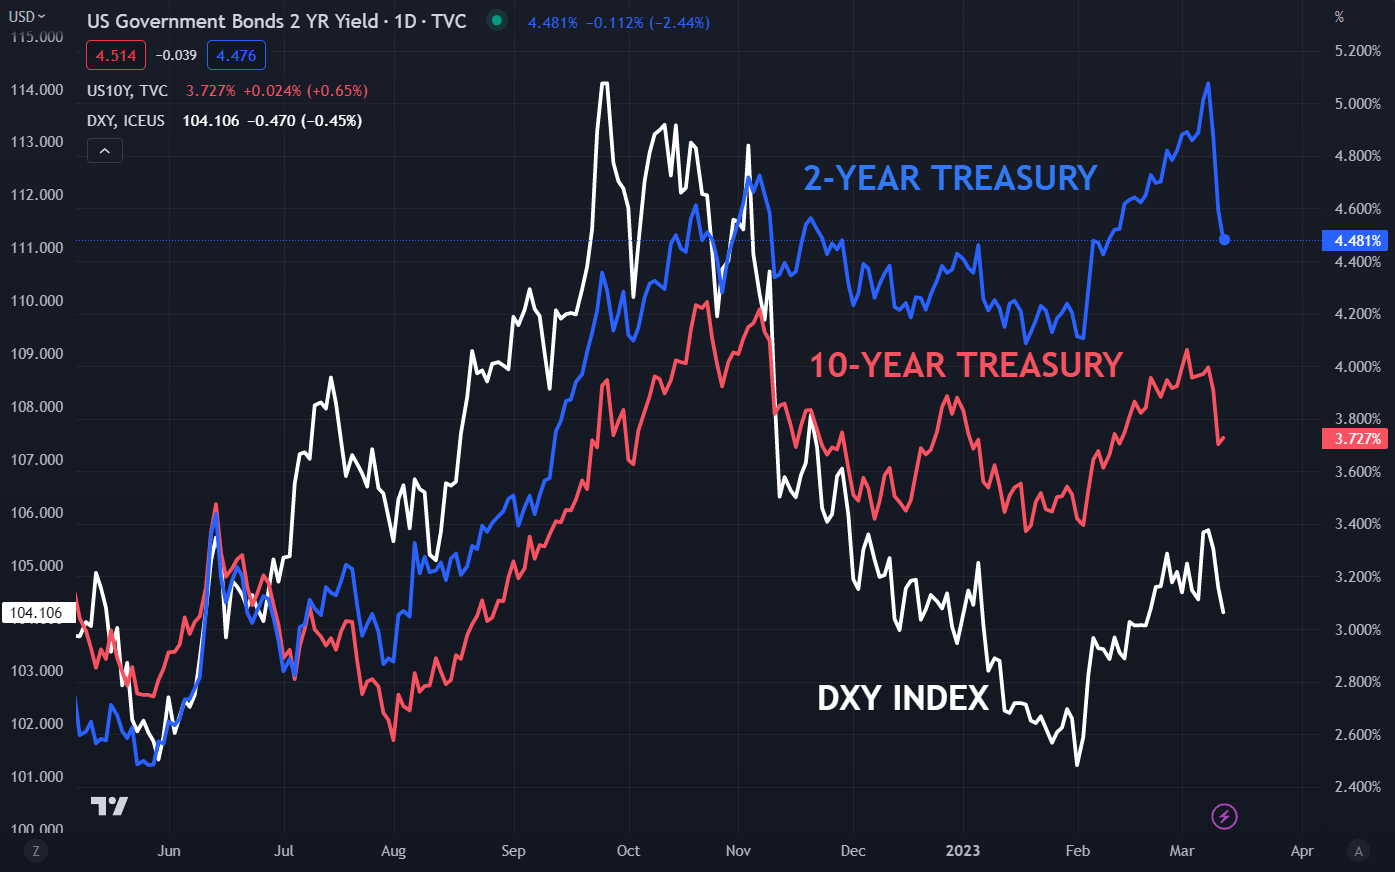
Treasury yields have collapsed and if they continue to trade lower, The US Dollar might be further undermined. The 2-year note is now around 70 bp lower than the peak of 5.08% last week, which was the highest yield since July 2007.

Conversely, if the authorities are successful in corralling contagion risks, Treasury yields might find support.

DXY (USD) INDEX AGAINST TREASURY 2- AND 10-YEAR YIELDS

image1.png

Chart Created in TradingView

Trading Economic Data Means Looking Past the Numbers

Trading Economic Data Means Looking Past the Numbers

Economic Data, Foreign Exchange Trading, Central Banks – Talking Points

  • All fundamental trading strategies are rooted in economic data
  • But reactions to that data can be puzzling, and complex
  • The likely effect of any number on monetary policy is often most important

The foreign exchange market’s reaction to economic data is one of the most important subjects for traders to consider, but also one of the most vexed.

The monthly round of official and private releases from around the world covers everything from inflation and employment to the forward-looking views of corporate purchasing managers. Together with central bank pronouncements, it forms what we might call the framework of foreign exchange trading.

Major Economic Releases Can Dominate Trade

Markets may well hunker down, losing both volume and volatility, in the run-up to an eagerly anticipated number. Official US labor market statistics are perhaps the most obvious example here. When the trading community expects serious gains or crushing losses the session can be subdued from Asia’s open and right across Europe as participants nurse suspicions or hopes. Even when the market expects neither many traders will – in financial journalism’s enervating cliché – “wait and see.”

This makes sense of course, enervating or not. Obviously, there’s a link between the economic performance of a country with a freely floating currency and the performance of that currency against its peers. At the most basic level a strong piece of economic data will boost a currency, a weaker one will tend to see it fall.

However, to take the matter no further would be a grave error. For one thing, individual pieces economic data tend to influence currencies in a very fleeting way. The gains provided by even a blockbuster, expectation-shattering number can be undone by the end of a day’s session, and well before that in some cases. It may even mean no more than a few minutes’ spike one way or another.

So, there’s clearly more to know about data and its effects.

The first and perhaps most important thing is that, while data provide the rhythm, the world moves to a monetarist cadence and central banks will always play lead. So, ultimately, the longer-term effects any piece of economic news must be considered with a view to how it might change monetary policy. No single data release is ever likely to do that, and markets would have caused to worry if it did. Central banks like to be ahead of the numbers, ready to tighten or loosen policy as needed before trends turn.

Therefore, we might see the markets only very briefly cheer strong retail sales, say, or powerful job creation. They might be great for the politicians, but, if inflation remains docile, they might not mean anything at all in terms of central bank policy changes. And if rates aren’t going up or coming down, then the longer-term effect of the data on the currency won’t amount to much.

Of course, these days docile inflation is little more than a happy memory across much of the world as war in Ukraine boosts both food and fuel prices at a time when post-Covid supply chain storms are still raging.

Currencies Can Fall Even When Interest Rates Rise

In July of this year, the United States Federal Reserve delivered a three-quarter point interest rate rise, something which would have been considered extraordinary monetary action for most of the past thirty years. And yet the US Dollar actually lost ground by the end of the session for, in its post-rate-hike remarks, the Fed left markets reasonably sure that future actions were going to be a lot more measured.

So, we can on occasion see the phenomena of a ‘dovish’ rate hike, or even a ‘hawkish’ rate cut. That’s when a central bank takes action but strongly implies that it has finished doing so, or that the barrier to more is extremely high. Higher interest rates have not been terribly helpful to rare-breed Sterling bulls this year either. The United Kingdom’s political and economic turmoil has left the market wondering if its economy can bare higher borrowing costs. The US certainly looks much better placed to do so.

With all this in mind, merely watching and reacting to pieces of economic news is unlikely to make for a satisfactory trading strategy. Indeed, the Dollar’s broad gains this year have rendered data watching all-but meaningless in many countries. Their currencies have fallen against the Greenback regardless of the numbers as the US currency reveals itself as the ultimate safe-haven play.

Competent traders know where the market is focused and where in the business cycle we are. What that tends to mean in practice is which specific data releases are most likely to trigger changes in the monetary mood music.

These can change dramatically over time. Older readers may well recall the days when western industrial production figures were the ones to watch for the best central bank steer. In more recent times unemployment figures took over. Policymakers were leery of wage inflation and, poised to “withdraw the punchbowl” if the labor market party showed any sign of getting out of hand.

Now of course inflation figures themselves are perhaps the ones which traders look at most obsessively, with prices’ stubborn elevation. One day, the focus will move on again. It always does. But a nuanced approach to trading economic data should remain a constant.

Gold Price Shines as US Dollar Tanks on Sinking Yields from SVB Bailout. Higher XAU/USD?

Gold Price Shines as US Dollar Tanks on Sinking Yields from SVB Bailout. Higher XAU/USD?

Gold has found support again today as markets were left reeling in the aftermath of the collapse of Silvergate Capital Corp. and Silicon Valley Bank (SVB) last week, followed by Signature Bank on Sunday.

Authorities have worked hard over the weekend to reassure depositors that their funds will be safe in these firms. These failed businesses largely served the crypto and technology industries. It has been made clear that bond and equity investors will not be bailed out.

The US Treasury Department said that deposits will be available to customers on Monday while the Federal Reserve created a liquidity facility for eligible financial deposit-taking institutions.

There is some speculation in the market that the Federal Open Market Committee (FOMC) will keep the Fed funds target rate unchanged on the 22nd of March meeting. The overnight index swap (OIS) market is now leaning toward a 25 basis point hike rather than a 50 bp lift last week.

US CPI due out Tuesday may have the implications for monetary policy that it would have prior to the collapse of these small banks.

The change in rate expectations saw Treasury yields go notably lower out to 5-years but were relatively unchanged beyond there. The 2-year note moved more than 70 bp lower from last week’s peak of 5.08%, which was the highest yield since July 2007.

This has seen the 2s 10s Treasury curve inversion contract more than 40 bp from last week’s nadir of -1.08%.

Similarly, the US 10-year real yield, that is the nominal yield less the market-priced inflation rate for the same period, dipped by more than 30 bp from last week’s peak of 1.72%.

Gold is a non-interest bearing-asset and can be subject to changes in nominal yields and real yields. Additionally, the yellow metal has been boosted by a deteriorating US Dollar. Not surprisingly, gold volatility (GVZ) has also ticked up in this environment.

Palladium saw almost 3% gains while silver also reached higher, as did platinum.

In currency land, the greenback has been hammered across the board with the Australian Dollar a notable beneficiary which might seem somewhat counterintuitive if risk aversion is to pick up steam. Emerging market currencies are all higher.

The decisive measure taken by authorities has seen Wall Street futures recover through early Monday trade after a sell-off on Friday. APAC equities are mixed with Australian and Japanese equity indices lower while China and Hong Kong have seen their bourses move higher.

Famed investor Bill Ackman gave the authorities his tick of approval on his Twitter account. He highlighted that prompt action was required and that taxpayer money did not bail out bond and equity investors.

Elsewhere, new Chinese Premier Li Qiang spoke for the first time and kept to the script but did say that achieving growth targets will not be easy.

In an interview on Bloomberg TV, Eisuke Sakakibara former Japanese Vice Finance Minister said that he does expect new Bank of Japan Governor Kazuo Ueda to make any significant policy changes for some time.

Crude oil is steady with the WTI futures contract near US$ 77 bbl while the Brent contract is around US$ 83 bbl. Aramco, the Saudi oil giant, posted a record profit of USD 161 billion last year on the back of surging energy prices and announced an uptick in dividend payouts.

The week ahead will be highlighted by US CPI on Tuesday and the European Central Bank (ECB) rate decision on Thursday.

GOLD, US 10-YEAR REAL YIELD, DXY (USD) INDEX AND GOLD VOLATILITY (GVZ)

image1.png


Can Unlucky Traders Still be Profitable? Finding Optimal Risk Management

Can Unlucky Traders Still be Profitable? Finding Optimal Risk Management

Not Quite Being Lucky

Often, there is an element of luck when it comes to trading. Even if your analysis is spot on, the timing is very difficult. A famous example from the real world can be found in Michael Burry, the storied US investor who correctly predicted the 2008 housing bubble from Michael Lewis’ bestseller “The Big Short”. He had to face down a revolt among his investors that nearly chased him out of the very trades that would land him in the history books. Burry’s financial backers balked at a steady stream of expensive payments made to keep his trades in play as the markets dithered.

There is a way for traders to compensate for luck – risk management. Overlooking this essential component of the strategy is how an incredibly lucky trader – someone who can frequently call trades correctly – may still lose money in the aggregate. Conversely, using risk management effectively is how a poor win rate can still translate into profitability.

How is it that a lucky trader can lose money overall? Consider a person who profited on 8 trades out of 10, making 10 dollars per trade. On the two remaining trades, however, 50 dollars were lost each time. On net, this will leave the trader 20 dollars poorer. In this special report, we will show how an unlucky trader can still be profitable, and what you can do to optimize risk management.

The First Random Walk – Understanding the Sequence

A random walk simulation was used to mimic someone trading 100 times in a row. Each random walk has a few parameters: starting account balance, the maximum risk a person is willing to take per trade as a percentage of the account balance (which stays the same as the trader makes or losses money), the risk-reward ratio (how much the trader wants to make relative to how much is put at risk), and finally the trader’s luck (the chance that a given trade in the sequence is profitable).

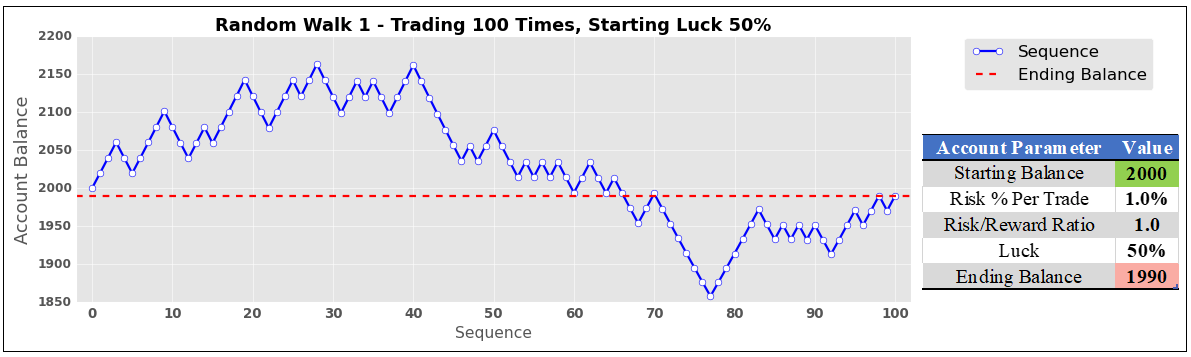
The first random walk is shown on the chart below. It simulates a trader that starts with a $2k account, risks 1% per trade, has a risk/reward (RR) ratio of 1:1 (meaning that the first trade risks losing $20 to make a profit of $20), and has 50% luck. Being lucky about half of the time had a predictable outcome. The ending balance ($1990) was nearly identical to where it started ($2000) after one hundred trades.

The First Random Walk – Understanding the Sequence

Study Limitations

It should be noted that this is a study computed with code and has no margin of error or human emotion factored into it. This means that no matter what, it assumes the trader being modeled always sticks to the game plan perfectly. It also assumes that trades can be seamlessly closed – with a profit or loss – at the designated settings with absolute precision. In the real world, stops may not always be executed at the specified price, resulting in some slippage. These simulations also assume 100 trades were taken, which will not match everyone’s level of activity. With that in mind, this is more of a demonstration of the importance of risk management rather than a one-size-fits-all trading system.

The Second Random Walk – Reducing Luck

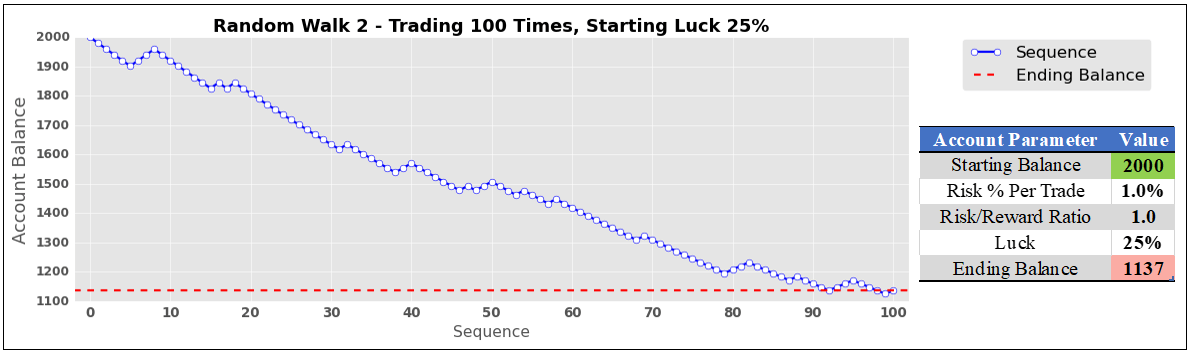
What happens when we take the same sequence but make our hypothetical trader unlucky, leaving everything else unchanged? With 25% luck, disaster strikes. Someone with a risk/reward ratio of just 1:1 would see their account balance cut almost in half after 100 trades ($1137). As we will find at the end of this journey, however, an increase in the risk/reward ratio can compensate for worse luck.

Top Trading Lessons

Top Trading Lessons
Recommended by Daniel Dubrovsky
Top Trading Lessons
Get My Guide

image2.png

Simulating Hundreds of Thousands of Trades to Find Optimal Risk/Reward Ratios

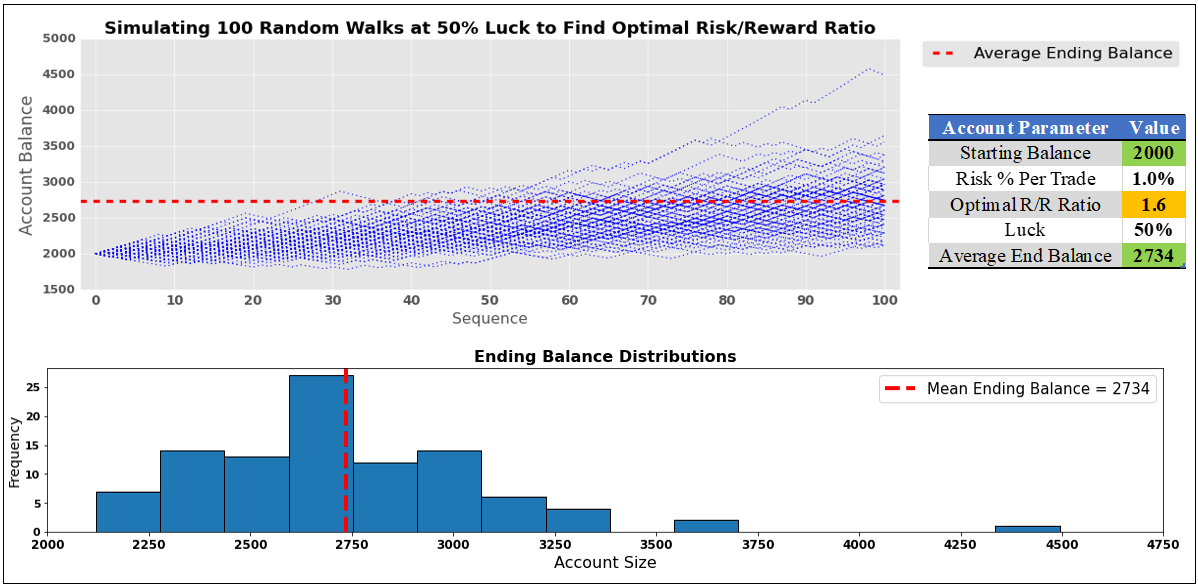
To find ideal risk/reward ratios for given levels of luck, these random walks were run many times to find statistically meaningful interpretations. In this study, one cycle constituted 100 trades conducted 100 times. That is a total of 10,000 trades per cycle! With each cycle, the risk/reward ratio automatically rose by 0.05, starting at 1. The program is coded to keep doing this until 100% of the trades are finished at or above the starting account balance.

So, what does this look like for someone lucky about half of the time? Well, in the image below, we can see that the optimal risk-reward ratio is on average 1.6 (meaning that with a starting balance of $2k the strategy aims to make $32 in profit while risking $20 on the first trade). The latter two will adjust alongside the evolving account balance to maintain a 1.6 RR ratio, making sure the risk remains at 1% per trade.

The code ended up increasing the risk/reward ratio 6 times. Including the starting point, the cycle ran 7 times. In other words, 70k trades were conducted to find the optimal RR ratio. To further optimize this study, another 10 rounds of random sequences were used. This means that roughly 770,000 trades were placed to find the optimal risk/reward ratio for 50% luck! It is not exactly 770,000 because sometimes the RR ratio was above/under 1.6.

When someone is lucky half of the time, and they use a 1.6 risk-reward ratio, we can expect an average ending balance of $2734 (36.7% return, which remains constant no matter what the starting account balance size is) after 100 trades. In the lower half of the image, there is a normal distribution of outcomes. There were a couple of outliers, with an account topping $4.5k. A few others were above $3.5k.

Simulating Hundreds of Thousands of Trades to Find Optimal Risk/Reward Ratios

The Optimal Risk/Reward Ratio Curve

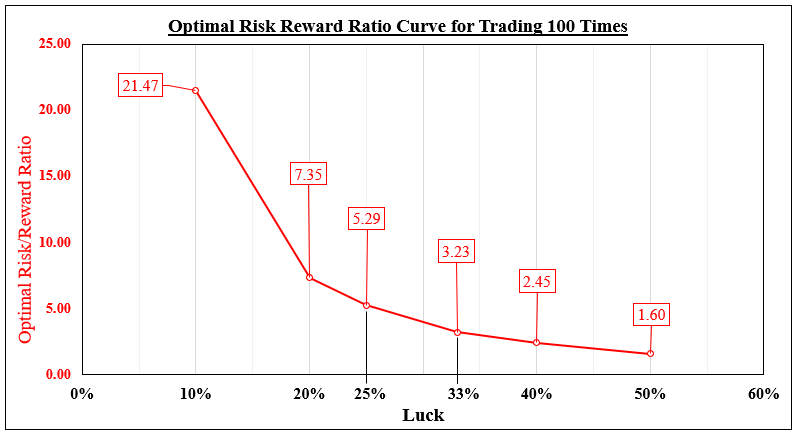
What about other levels of luck? In this study, I used the following: 50%, 40%, 33%, 25%, 20% and 10%. Optimal RR ratios are displayed in the chart below for a given luck level. As expected, lower levels of luck required higher risk/reward ratios to compensate. When you are lucky 40% of the time, an ideal RR ratio for a sequence of 100 trades seems to be 2.45.

At 2.45, a total of 30 cycles were simulated for a given random sequence. Just like before, an additional 10 were performed to help optimize this study. Combining all these sequences, roughly 3,300,000 trades were placed to find the optimal risk/reward ratio for 40% luck.

Someone lucky just 10% of the time can still make a profit. However, this would demand the daunting task of maintaining a 21.47 risk/reward ratio.

The Optimal Risk/Reward Ratio Curve

Is Trading Success Based on Luck?

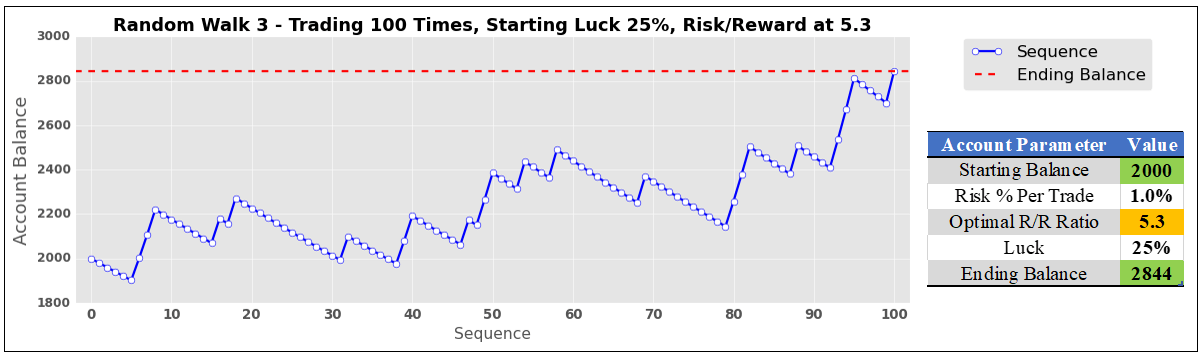
Now, let us revisit the earlier scenario of a trader that is lucky just 25% of the time. Using a 1:1 risk-reward ratio, they lost almost half of their account. Using the optimal risk/reward ratio of 5.3 suggested in our analysis, their ending balance becomes $2844, a 42.2% return. Do traders have to be lucky to be profitable? Absolutely not. Success comes down to risk management.

Building Confidence in Trading

Building Confidence in Trading
Recommended by Daniel Dubrovsky
Building Confidence in Trading
Get My Guide

Is Trading Success Based on Luck?

* All random walks simulated with Python

Can I make money from swap in Forex trading?

Can I make money from swap in Forex trading?

Can I make money from swap in Forex trading?

After traders learn that they can actually earn on swap in Forex trading, they start to look for pairs with positive swap in order to avoid high risk choices such as trading with CFDs. And there are enough of them, but with one caveat. There are no pairs where all swap rates are positive, but there are pairs where the swap is positive depending on the type of operation.

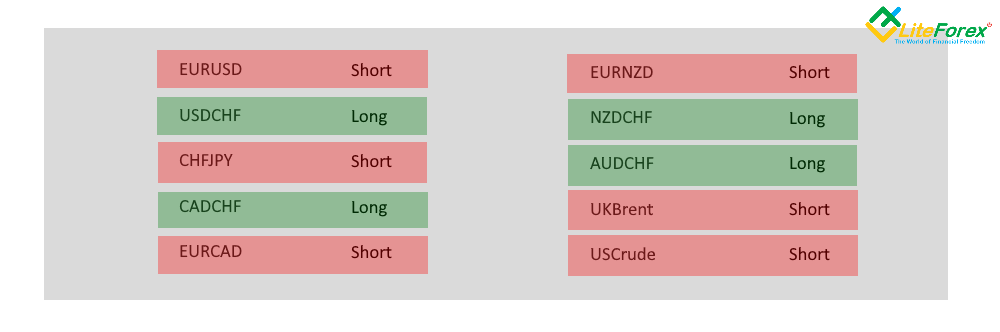
Below, I have listed the pairs with positive Forex swap. Under certain conditions, we can earn on swaps trading these pairs.

LiteFinance: What is swap in Forex trading? | How to Calculate FX Swaps: Examples | LiteFinance

At the moment, this is the entire list of instruments with positive forex swaps that my broker provides. However, their number may vary depending on market conditions. For example, if one of the central banks changes its underlying interest rate or your broker changes the markup value.

In general, if you know that a country has a negative net interest rate, this is the sign that positive Forex swap rates may appear in currency pairs containing the currency of this country. However, traders should remember that a small positive swap in Forex trading will be easily eaten up by a spread and can lead to a high risk of losing money rapidly.

But even if such situations are rare, there are some very simple Forex trading strategies to earn on interest and Forex swap rates differences.

Carry Trade

The most popular trading strategy for making money on swap rates is, of course, the carry trade.

LiteFinance: What is swap in Forex trading? | How to Calculate FX Swaps: Examples | LiteFinance

The principle of the strategy is to find the largest difference in interest swap rates of different countries. After that, we group the currency pairs that include the currencies of these countries and find a pair where the swap in one direction is greater than in the others.

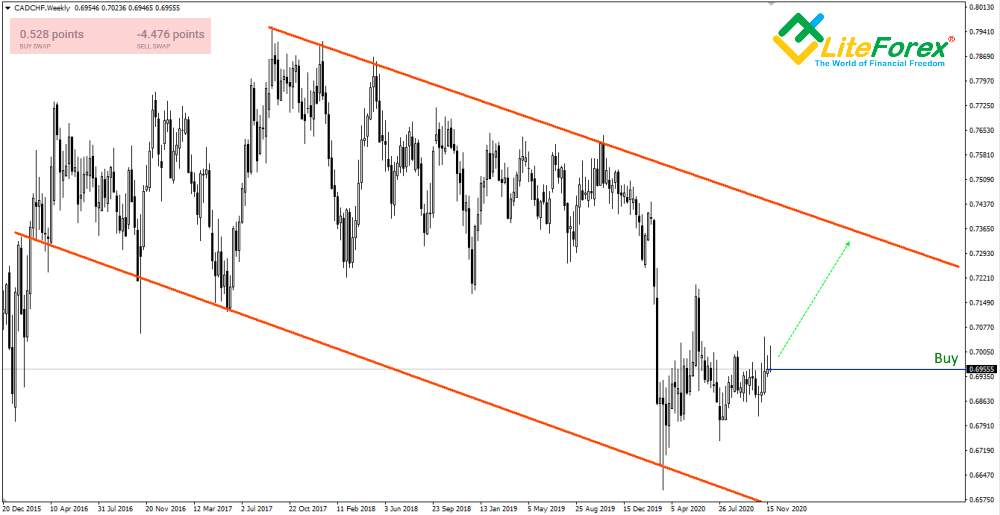
After a quick look, I have highlighted the CADCHF pair. Forex buy swap on it is 0.528 points. Therefore, if we buy this currency pair, we will be making money on a positive swap. Since the position must be held for a long time to make a profit, we need to analyze the global chart for growth prospects. This particular pair has a growth potential. Now all that remains is to buy and wait, making a profit from the growth of the rate and a positive swap. However, the strategy requires that we keep the position open for quite a long time.

Swap and Fly

There is another strategy that resembles the previous one — Swap and Fly. The strategy appeared after most forex brokers began to provide the trailing stop option.

LiteFinance: What is swap in Forex trading? | How to Calculate FX Swaps: Examples | LiteFinance

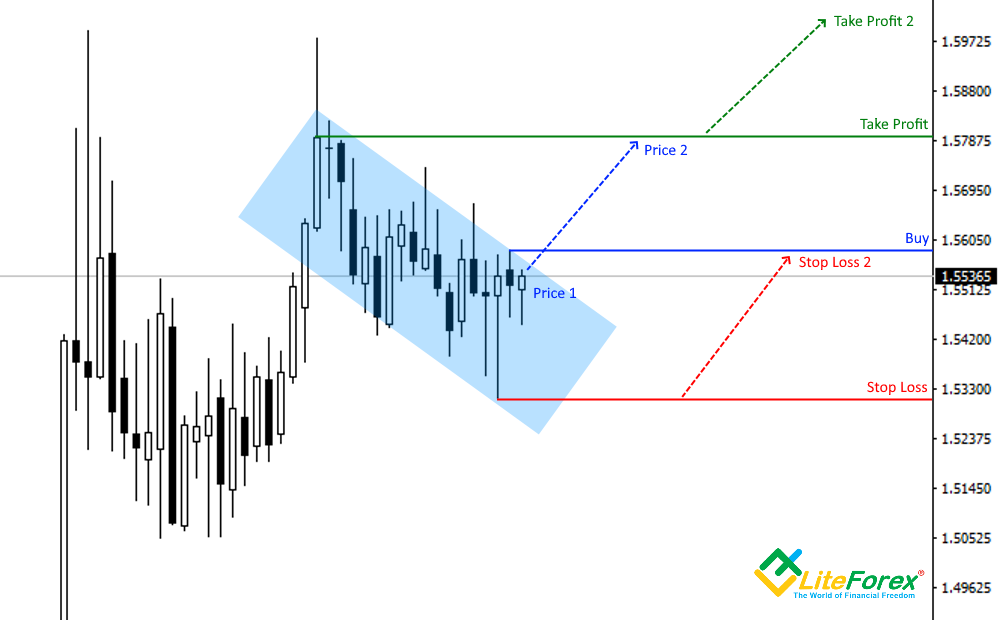
We choose an instrument similarly to the first strategy. After we’ve found the pair, we need to find a pattern that’s highly likely to be realized. Candlestick patterns are used more often, but geometric patterns will also work. In our case, this is a flag pattern, after which we expect growth. It’s important not to use mathematical indicators.

After that, order levels are placed with standard rules, which makes the ratio approximately 1:1. After the price starts to grow and goes above the entry point, you need to move Stop Loss to breakeven, I.e. at the level that a position opens. And that’s it. Then you just keep the position until the stop loss is triggered. Of course, you can use a trailing stop and also increase your profit by the rate difference. But this is not the essence of the strategy.

The essence of the strategy is to make money on a positive swap. In our case, it is equal to 0.834 points for a buy position. For a 1 lot trade, it’s about 80 cents. If we can maintain the position for a month, when closed by stop loss there will be no exchange rate difference, but the swap will bring us 21 * 0.8 = 16.8 dollars.

Currency futures strategy

LiteFinance: What is swap in Forex trading? | How to Calculate FX Swaps: Examples | LiteFinance

There is another good strategy. I sometimes use it myself. The essence of the strategy is to create an ordinary locked position but with different types of contracts. You know that besides currency pairs, there are also futures, options, trading CFDs, and many other contracts. So, futures are essentially no different from a currency pair. Their most important difference is the absence of a swap. Did you already guess what I’m getting at?

Exactly. I create a locked structure by buying a currency pair with a positive buy swap when trading Forex on market and at the same time selling futures for the same pair on another exchange. The currency pair and futures quotes are usually the same, as are the fluctuations. Therefore, wherever the price goes, I will always have 0 because one side is bought and the other is sold.

The profit will be formed from the positive swap when you trade Forex. Of course, there are nuances, such as the size of the spread and the commission. But you can always account for them in the strategy and compensate either by the duration of the position or by a short-term play on price fluctuations and their future performance.

If you want to know more strategies, learn more about trading CFDs for making money on swaps without a higt risk of losing money rapidly, I recommend that you get specialized training from your broker.

What is swap fee in Forex — islamic accounts

Forex brokers also have special swap-free accounts. They are also called Islamic accounts. An Islamic account is a trading account that does not have any swap charge or fees in the form of an interest rate. According to the laws of Islam, Muslims are prohibited from receiving or giving interest on any kind of activity. So Islamic accounts were created in order for Muslims to be able to use the services of the Forex brokers.

Despite the fact that this type of account was created for Muslims, anyone can open it now. In order to open an Islamic account for yourself, you need to submit an application to your broker.

However, we all understand that brokers are not charity organizations. And if the account is swap-free, the broker will get their money in other ways. Usually this means larger spreads or a fixed commission per trade.

Start trading right now

Conclusion

The topic of swap is quite important on the exchange. Many large investors make money not on the difference in exchange rates, but rather on the difference in net interest rates. When you trade Forex in the financial markets, most traders view forex swaps as another type of commission that brokers use to get rich. But if you understand how swap works, you can turn it from an enemy into a reliable ally that will bring you profit regardless of exchange rate fluctuations. Thus, using swap trading first on a demo account with a nominal position will help you understand how this efficient tool works with no need to risk money on complex instruments like trading cfds, or even avoid the high swap charges.

How a Currency Swap Works – FX Swap Examples

How a Currency Swap Works – FX Swap Examples

How a Currency Swap Works – FX Swap Examples

Now let’s take a closer look at how foreign exchange swap works.

I have already mentioned this above. At its core, Fx swap rates are the difference in the interest rates of the central banks of the two countries whose currencies are represented in the pair.

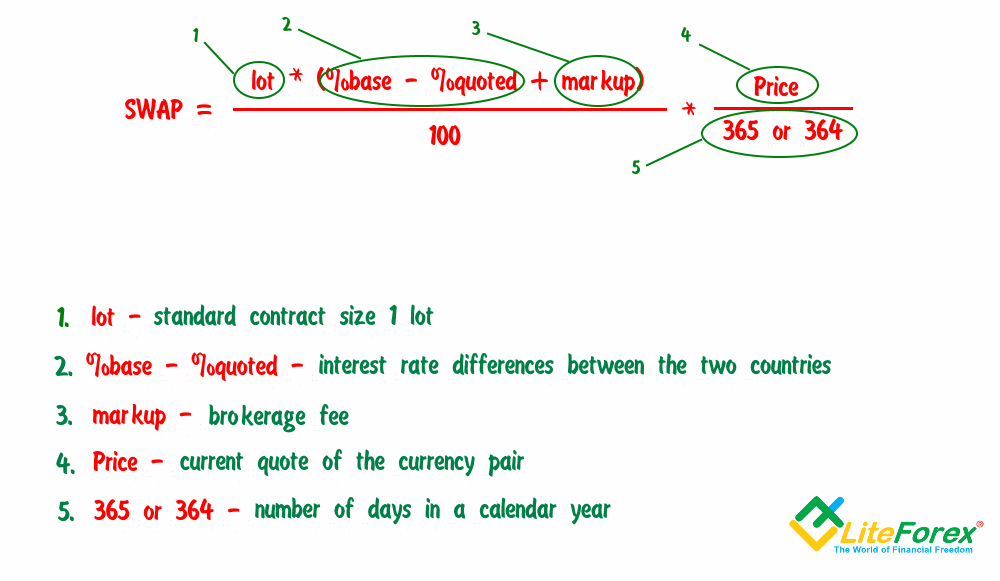
Above, I gave you the formula to calculate the base swap rate. The main parameters of this formula are basically unchanged during the year. And for some currencies, even for several years.

The main parameters are the values ​​of interest swap rates. Except for the current year 2020, changes in interest rates are not frequent. This happens once a year at best.

The variable parameters are the markup and the quote of the currency pair. These parameters can change even more often than once a day. Therefore, if we want to know the exact value of the swap, we need to constantly recalculate the value using a formula or a special calculator.

In addition to being positive and negative, swap rates can also be long and short positions open. In other words, a buy swap and a sell swap.

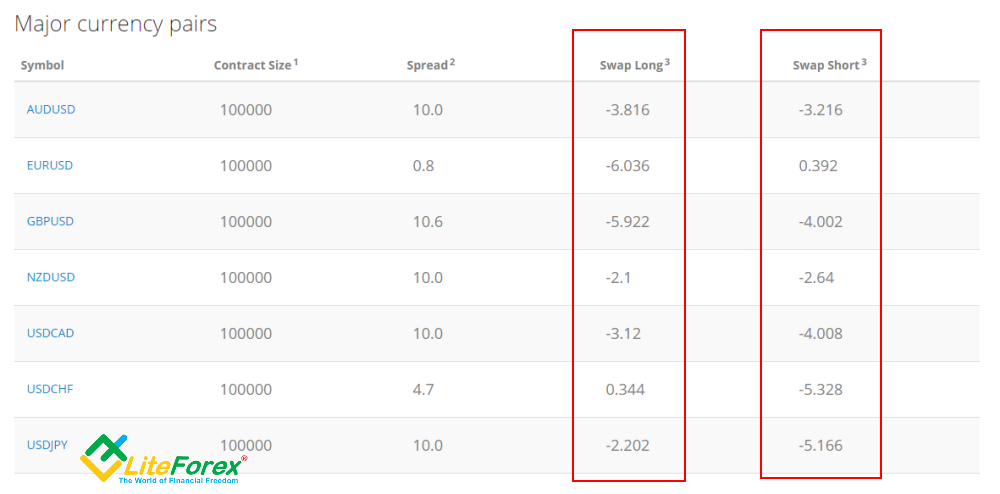
In my broker’s swap table, it looks like this:

LiteFinance: What is swap in Forex trading? | How to Calculate FX Swaps: Examples | LiteFinance

These values ​​in the red columns indicate the swap value in points per one full lot, which will be credited to or charged from the trader’s account if you have your positions open. In other words, if we have an open position to sell the AUDUSD pair, when we carry it overnight a swap short is applied to our position, which is equal to -3.216 points. If we have an open position to buy this pair, Swap Long will be applied, and it will be equal to -3.816 points.

The largest swap value is usually associated with exotic currency pairs such as USDRUB.

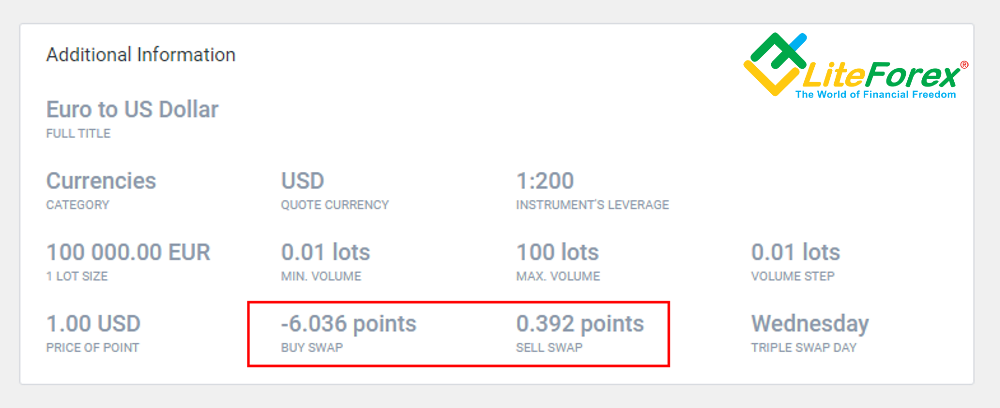
If you need to know the swap just before opening the position, you can use the contract specification table:

LiteFinance: What is swap in Forex trading? | How to Calculate FX Swaps: Examples | LiteFinance

The situation with swap rates will be slightly different for the euro/dollar pair. The buy swap pip value will be -6.036. In other words, an amount equal to this value per lot will be charged from your account. But the sell swap is equal to 0.392 points. A positive sign means that this value will be credited to your account. So you can actually earn money on a swap.

I have already explained why swap rates can be positive and negative. It’s all about the difference in interest swap rates. If the interest rates of the central banks of currencies differ greatly, then the swap sign will be different when buying and selling.

Calculating the swap fees on a short position

Now let’s take a closer look at how the total swap value is calculated on Forex trading for a sell trade in the EURUSD currency pair.

  • SWAP (short positions) = (Lot * (quote currency rate – base currency rate – markup) / 100) * current quote / number of days in a year.

However, it should be noted that the value will not be entirely accurate since we do not know the exact markup value.

If the positions open at 1 lot with the current quote at 1.19626 and markup at, for example, 0.20%, the swap size will be:

  • SWAP (short positions) = (100 000 *(0.25 – (0.0 – 0.20)/100) * 1.19626/365 = 0.163 EUR with an incorrect markup value.

If you perform this operation using a calculator on the broker’s website, you get 0.376 USD, so the difference is only in the markup value.

Swap on a long position

Now let’s look at how the total swap value is calculated for a buy when you trade Forex using the EURUSD pair.

  • SWAP (long positions) = (Lot * (base currency rate – quote currency rate – markup) / 100) * current quote / number of days in a year.

However, it should be noted that the value will not be entirely accurate since we do not know the exact markup value.

If we open a position of 1 lot with the current quote at 1.19626 and markup at, for example, 0.20%, the swap size will be:

  • SWAP (long positions) = (100,000 * (0.0 – (0.25 + 0.20) / 100) * 1.19626 / 365 = -1.474 EUR with an incorrect markup value.

If you perform this operation using a calculator on the broker’s website, you get -6.036 USD, so the value of the broker’s markup for a short trade is significantly different.

FX Swaps and Cross Currency Swaps

FX Swaps and Cross Currency Swaps

FX Swaps and Cross Currency Swaps

As I said above, there are several types of swaps. Now let’s take a look at the difference between the three main types of swaps.

Forex swap

Fx swap rates are the financial instrument that represents the difference between the paying interest rates of the banks of the two currencies in a pair, which is credited or charged when an open position is carried overnight.

Cross currency swap

A cross currency swap is a foreign exchange transaction that combines the purchase or sale of a currency on a spot basis with the simultaneous sale (or purchase) of the same currency for a specified period on a forward basis. This means the trader performs a combination of two opposite conversion transactions for the same amount, but with different value dates.

This is the official definition. Now let me explain it in simple terms:

A cross swap on Forex trading is a situation that occurs when two companies participating in trades on the foreign market enter into an agreement with each other. Within this agreement, they sell each other the same amount in different currencies based on their current rate immediately after the swap operation itself and not at a higher interest rate compared to the changes of the market. After a predetermined period, which they have set under the forward contract, they sell these amounts back to each other in accordance with their rate under the forward contract.

Currency interest rate swap on Forex

LiteFinance: What is swap in Forex trading? | How to Calculate FX Swaps: Examples | LiteFinance

A currency interest rate on the Forex swap is a simple interest rate swap that is carried out with different currencies.

Despite the fact that this operation is typical for large financial institutions, it also occurs in everyday life.

For example, you have a loan in foreign currency. The only option for you is to take out a new loan to cover the old one. But taking a new loan in foreign currency is a bad option as the stakes are high. But in local currency they are acceptable. At the same time, you happen to have a friend overseas with similar problems. So you take out a loan in your local currency, and he takes out one in his local currency, which is foreign for you. And then you simply exchange these amounts. As a result, you pay interest on his loan, and he does on yours. Everyone wins and you both saved on the interest rate without any risk involved.

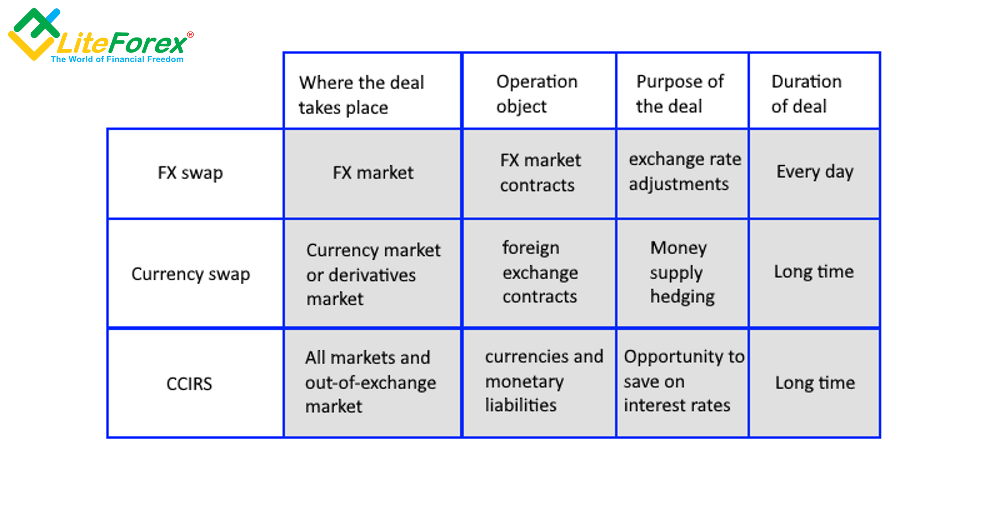
To help you understand the difference between the different types of currency swaps, I have made a comparison table:

LiteFinance: What is swap in Forex trading? | How to Calculate FX Swaps: Examples | LiteFinance

What is a Swap in Forex and How to Calculate

What is a Swap in Forex and How to Calculate

Everyone trading on the exchange must know and understand what a swap is. In my rather long professional career, I have come across many situations where people lost entire deposits simply because they didn’t know how swaps worked.

In other words, if you understand well what swap is and how it works, you can protect yourself from unnecessary losses and even use swaps for additional profit. This concept is as important as leverage.

The article covers the following subjects:

What are swaps and how are they calculated?

LiteFinance: What is swap in Forex trading? | How to Calculate FX Swaps: Examples | LiteFinance

Now let’s figure out what fx swap is.

Foreign exchange swap is the difference in the interest rates of the banks issuing the two currencies, which is credited to or charged from the account when the trading position is kept overnight.

The central banks of each country determine the key interest rate. This is the rate at which the central bank lends to other banks. This rate may change throughout the year. But its starting value is determined at the first meeting of the central bank of the year.

On the foreign exchange market currency pairs are traded. Two different currencies are involved in the transaction, and each of them has its own interest rate.

The currency pair contains the base and the quote currency. The former is the currency we buy and the latter is the currency we buy it with.

The base currency is also called the deposit currency. This is our currency and the exchange uses it on a daily basis. Therefore it must pay us a certain percentage for it.

The quote currency is also called the counter currency. It belongs to the bank and we borrow it from the bank. Therefore we pay interest to the bank for the use of its currency, like with a consumer loan.

A negative swap is when you pay it or a positive when it is paid to you.

If there is a negative swap (with a minus sign), its crediting to your trading account will end when you withdraw the funds (points). If the difference in the interest rates gives a positive swap, the money will not be withdrawn from your trading account, but rather a certain number of points will be credited.

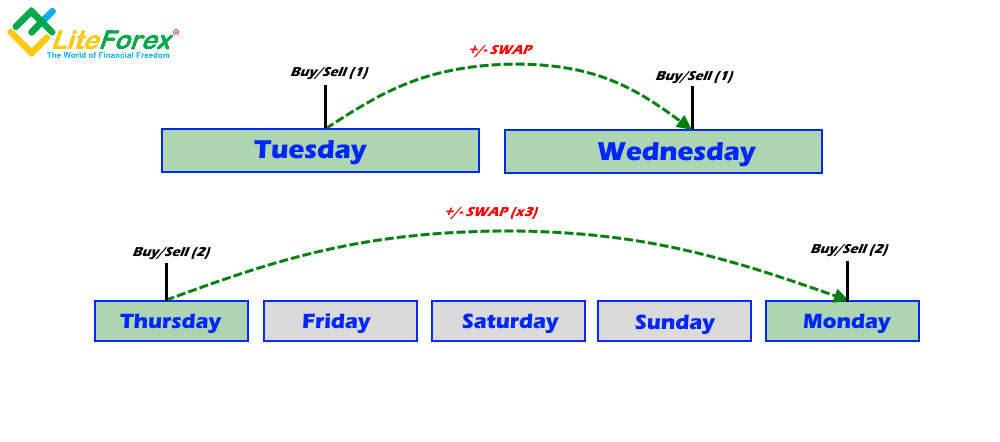
Thus, if the client has an open position at the close of the New York trading session, a swap operation with currencies is enforced. This means the position is simultaneously closed and opened for the new day. But on the client’s trading account there is no actual closing and opening. Rather the credited or charged interest is simply displayed.

However, there is a day when this operation is tripled. This is called a triple swap day. For currency pairs on the forex market, this is Wednesday to Thursday night. This is because settlements on the exchange for a position open on Wednesday are made on Friday. Therefore, the calculations for the position carried over from Wednesday to Thursday are done for the next day. And the next business day after Friday is Monday. This adds up to 3 days and the weekend swaps charge triple.

LiteFinance: What is swap in Forex trading? | How to Calculate FX Swaps: Examples | LiteFinance

Swap as a trading strategy is different for each instrument. It wouldn’t be convenient to constantly calculate them, so brokers provide special swap tables. My broker has a swap table you can use here.

How to calculate swap in Forex?

In order to understand when we pay swap and when it is paid to us, let’s talk about how is swap rate calculated in Forex trading when buying or selling:

LiteFinance: What is swap in Forex trading? | How to Calculate FX Swaps: Examples | LiteFinance

There is a simple formula, as shown above. The most important parameter of this formula is the rates of the central banks, or rather the difference in the interest rates of the base and quote currencies.

For example, let’s compare rates for one currency pair, the EURUSD for example. The ECB rate is now at 0% (loans are effectively free), and the Fed rate is set at 0.25%.

So if we buy a currency pair, we must subtract the quote currency rate from the base currency rate: 0 – 0.25 = -0.25. This means when buying this pair, the difference in rates is negative, and therefore the swap rate will be negative.

But when selling a pair, on the contrary, we need to subtract the base currency from the quote currency: 0.25 – 0 = 0.25. The swap rate will be positive.

This operation only gives us the positive or negative sign of the swap rate (which means either you pay or get paid). If we want to calculate the swap value itself, we need to substitute all the values ​​into the formula.

Today almost no one uses the formula to calculate the swap rate anymore. Traders either look it up in tables or find it using an fx swap calculator.

Islamic Forex trading accounts

Islamic Forex trading accounts

Islamic forex trading accounts also known as No riba accounts it is created to accommodate customers those are Islamic. Completely they are based on religious beliefs Islamic clients which are a state that customer should give all but no to expect something in return and while they do not receive and pay interest in the economic industry. This faith was immediately adopted by forex trading, and it is requested to create Islamic account forex trading that allows an Islamic client to trade and no need to pay in return with interest. In forex industry of trading, these companies charge huge interest on client’s positions has open overnight.

How to get more profit in forex trading Islamic accounts?

The issues that usually occurs in Islamic forex trading accounts that people who are not Islamic not get involved in those accounts and feels like that unfair happening this are the main issue occurs due to Islamic account forex trading. AS these accounts charges different interest as compare to other normal accounts depends on the forex companies whichever is higher spreads.

How to trade forex for profit by using Islamic forex accounts?

  • The condition offered in the accounts of Islamic clients for all types of accounts, except leverage and currency offered. In the case of any suspicion or abuse, the trading market might be at its discretion to end all open positions and also remove the free swap conditions.
  • The main and the only Islamic account determining factor is that customer must be of the Islamic religion. The hantec Markets reserves right to discontinue a swap/Islamic free account with no warning.
  • Mainly hantect markets do not accept that the Islamic forex trading accounts are made to worn for any carry arbitration and trades or some other strategy to take benefit from between currencies and interest differences.
  • Mainly customers take advantage of interest accounts by holding their positions for a particular period without taking any interest, but positions held more than one week will e charged according to per lot.
  • The Islamic account clients agree and acknowledges that if in case they hantec markets if suffered loss because to rollovers swap free accounts positions, then the market has the full right to earn loss from the customer by debiting any account of their account by some loss account.
  • If clients have insufficient balance amount to compensate, then for this client agrees to write a requested sum to their account upon the hantec market.

For swap accounts or Islamic forex trading accounts, the firms of forex book the loss or profit of daily swap, which allows practicing Muslims to stay at their positions without a charge or benefit. Day by day the forex trader’s population is increasing of other faiths but also they are attracted to this kind of trading accounts, as in this no one is burdened with this much additional benefits and losses with the interest as there are many traders don’t know even how to work and how to profit from forex.

visit us @ https://bit.ly/3jIIjaI

For whatsapp number: +2348058414433

US: February is expected to have been a strong month for hiring and wage growth

US: February is expected to have been a strong month for hiring and wage growth

Economists expect hiring remained strong in February and that wages grew even faster than they did in January.

February’s employment report is expected Friday at 8:30 a.m. ET. Economists forecast 225,000 new jobs were added in February, lower than January’s surprisingly strong 517,000 jobs, according to Dow Jones.

The unemployment rate is expected to hold steady at 3.4%. Average hourly earnings are forecast to rise by 0.4%, or 4.8% year over year. That is more than January’s 0.3% increase, or a 4.4% annualized rate.

If the report is as expected, it will do little to quell concerns about high inflation and it could even increase the odds for a half-point rate hike from the Federal Reserve at its next policy meeting in less than two weeks. Investors are also focused on whether there will be revisions to January’s startling report.

Investors are closely watching the employment data since it and the upcoming consumer price index due March 14 are two reports that could influence the Fed’s March 22 rate decision. The futures market Thursday was pricing a nearly 70% chance of a 50 basis point increase. A basis point equals 0.01 of a percentage point.

“I think an in-line number could lead to further selling, because we’re coming off such a wallop of a number last month,” said Peter Boockvar, chief investment officer at Bleakley Financial Group. “Not seeing any reversion of note could be taken negatively by the bond market.”

KPMG chief economist Diane Swonk said she expects to see 210,000 jobs were created in February. “The real issue is what kind of threshold would the Fed need to really stop the rate hiking cycle or stop from going 50 basis points,” she said. “You really need to get to below 100,000 to think 25 basis points is okay. They need to see signs of a major chill.”

The persistently strong jobs market and hotter-than-expected January inflation data changed the outlook for the Fed. Fed Chairman Jerome Powell told congressional committees this week that inflation could be harder to tame and the Fed may need to raise interest rates even more than anticipated.

Prior to those comments, markets were pricing in just a quarter-point hike for the March meeting. The futures market is now pricing an end point for Fed rate hikes near 5.75%, against the current target range of 4.50%-4.75%.

The Fed has tried to cool the economy, but employers still struggle to find workers in a tight labor market, which has helped force up wages.

“We’re expecting continued strength in leisure and hospitality hiring,” said Swonk. “Manufacturing activity is still trying to ramp up. Construction is starting to weaken, but infrastructure jobs are taking over for the housing market.”

Aditya Bhave, Bank of America senior U.S. and global economist, expects 230,000 jobs were added in February and that the January number was inflated. He said there could have been additional jobs created that month because of favorable weather, but that 50,000 jobs alone were added because of the end of a University of California strike.

“From our perspective, the true number was closer to 350,000,” he said.

If there are downward revisions or the February report is weaker than expected, Boockvar said, the stock market could rally and bond yields could fall. Yields move in the opposite direction of price, so that when bond prices fall, yields rise, and vice versa.

“It would be a huge pressure point that gets relieved, at least for tomorrow,” he said.

Economists said the Fed opened the door to a half-point hike this week, and the jobs report will likely influence expectations going in to the policy meeting later this month.

“I think the onus is on the data to convince the Fed to do 25,” Bhave said, noting that after Friday, Fed officials enter a blackout period ahead of their March 21 and 22 meeting.