Nasdaq 100 (NAS100.I) and S&P 500 (US500.I) slump to new lows on higher Fed rate bets
Stocks were pressured after fresh economic data highlighted persistent inflationary pressures remain – pushing the S&P500 to close at its lowest level in six weeks after shedding 0.5%. It’s the second straight day the S&P closed under its 50-day moving average. While most sectors declined within the S&P500, energy rallied strongly by nearly 2%. The strong China PMI data helped sentiment in the materials and industrial sectors, both rising on Wednesday. Nasdaq 100 slid 0.9%. The extra pressure on equities came as the prices paid component of the ISM in surging above the 50 expansion/contraction threshold and higher for longer comments from Fed officials (see below).
Key U.S. company news
In regular trading, First Solar (FSLR:xnas) shares surged about 16% to its highest since 2009 after the panel maker’s backlog of orders look like they’ll take the 2nd half of the decade to fill. The surging demand comes as the company is benefiting from the Inflation Reduction Act- signed last year by President Joe Biden. Meanwhile, after close of trade – software giant Salesforce (CRM:xnys) gave a surprisingly upbeat forecast for the year ahead – and plans to step up share buybacks to $20 billion, which is positive vs its $167b market cap. Operating margins will be about 27% in fiscal 2024, exceeding Bloomberg consensus estimates of 22.4% growth. This also potentially eases pressures CRMs faces from a group of activist investors. Salesforce shares rose 14% in post market trade, after closing at $167.35 in normal trade. Next, we will be watching – Campbell Soup (CPB:xnys) which reports after market close Thursday.
US Treasury curve (TLT:Xmas, IEF:xnas, SHY:xnas) sold off on Fed comments
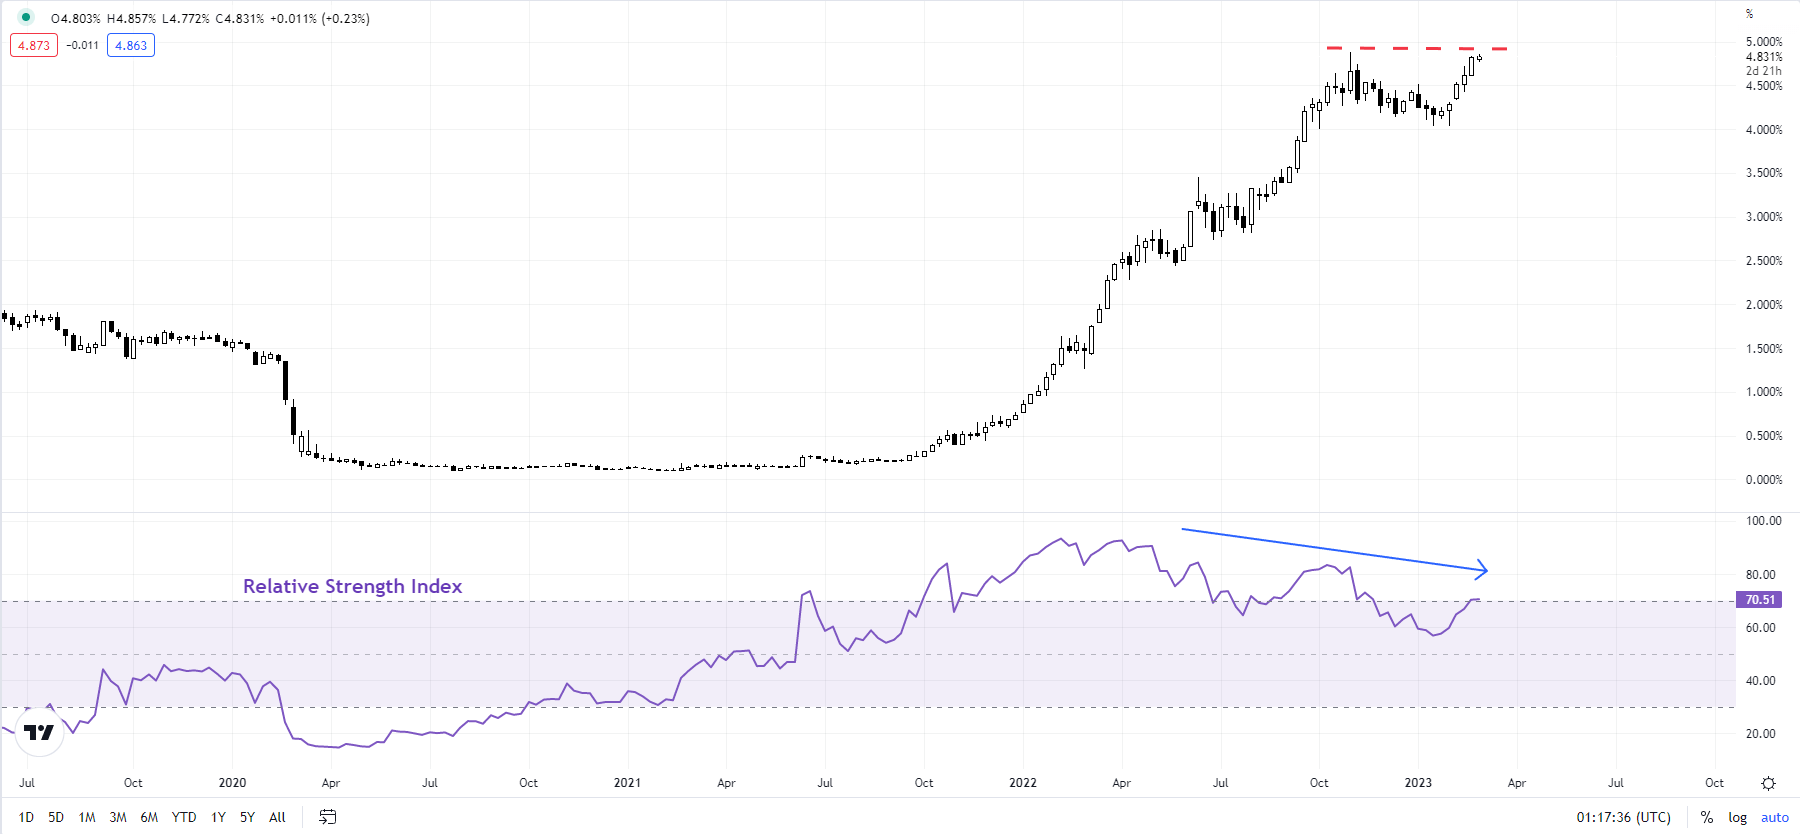
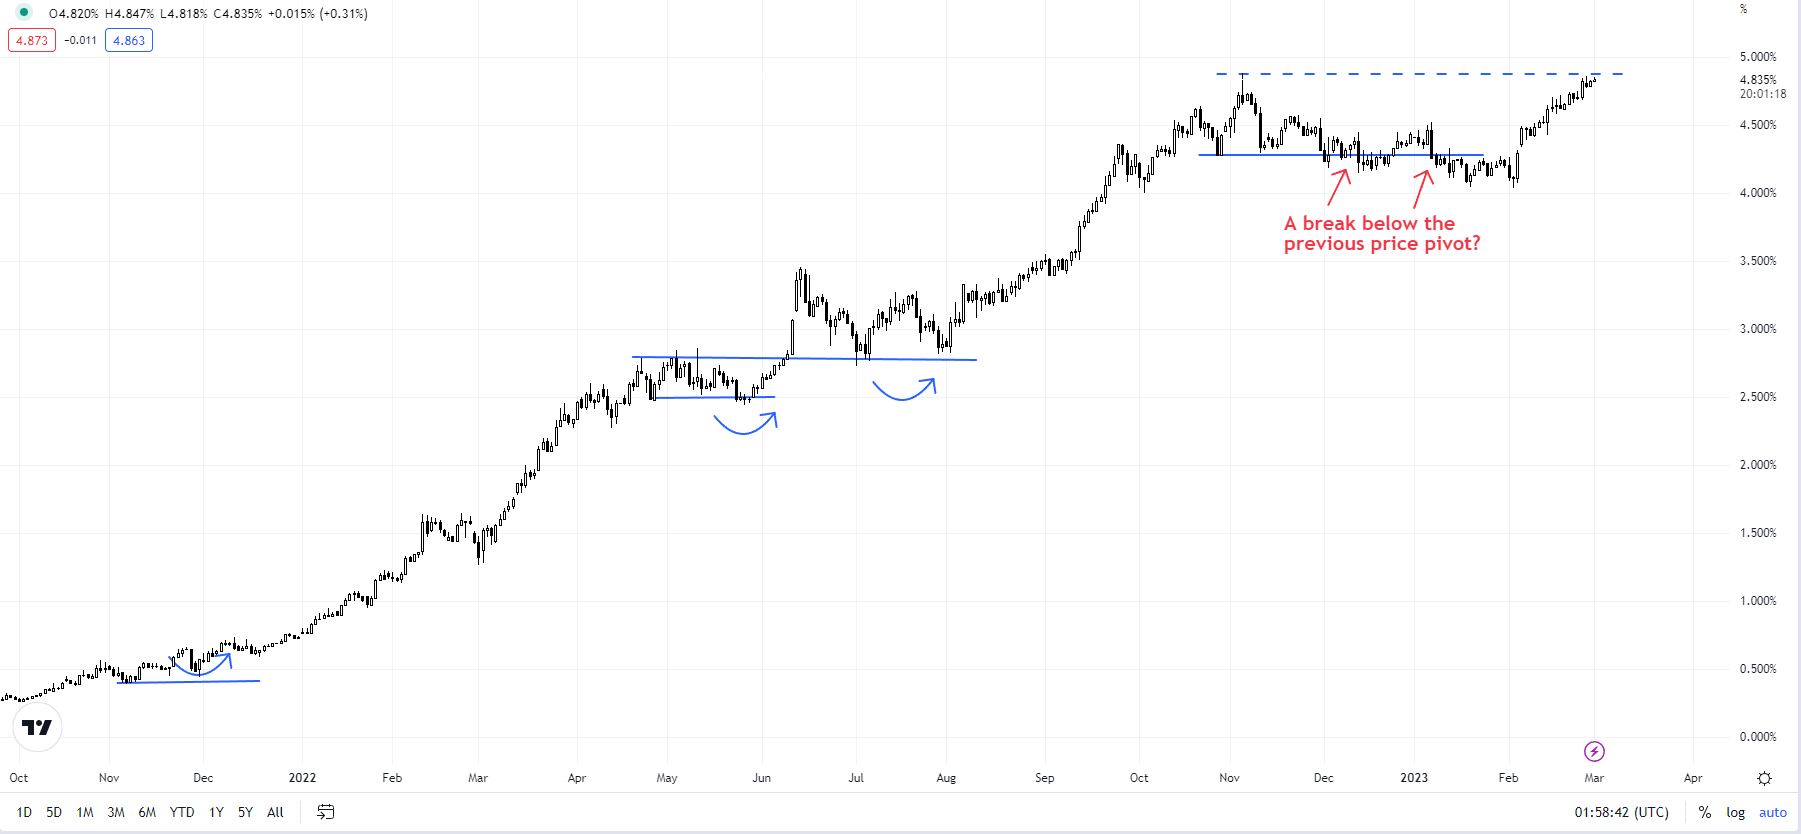
The 10-year yield breached above 4% briefly during the session before closing a touch below that at 3.99%, following comments from the Fed’s Kashkari saying undecided between a 25bp and 50bp hike at the March FOMC and Bostic’s 5-5.25% “well into next year” remarks. Yields on the 2-year notes rose 6bps to 4.88%, the highest level since 2007. The jump of the ISM Prices Paid (see below) also added fuel to the selloff.
Hong Kong’s Hang Seng Index (HSI.I) and China’s CSI300 (000300.I) jumped on strong China PMIs
Hang Seng Index surged 4.2% and CSI300 gained 1.4% on Wednesday following the release of strong PMI data in China much above consensus estimates. Hang Seng Tech Index jumped 6.6% as technology hardware, China internet, and EV makers advanced sharply. The percentage increase in the Hang Seng Index was the largest since early November and turnover in the Stock Exchange of Hong Kong reached HKD154 billion, the highest since late January.
Chinese developers were among the top winners, with Longfor (00960:xhkg) up 9.6% and Country Garden (02007:xhkg) up 8.3% leading the charge higher. The chairman of Country Garden announced retirement. ASMPT (00522:xhkg) jumped 9% after the semiconductor equipment maker reported Q4 revenues beating estimates. After market close, Techtronic (00669:xhkg) reported H2 EPS of USD0.27 and revenues of USD6.2 billion, both below the consensus estimates due to soft demand for power tools.
In A-shares, telco, digital economy, software, gaming, media, and AI-generated content stocks were the top winners.
Australian equities (ASXSP200.I) rise to four-day highs on commodities rebounding – beware of companies going ex-dividend ahead
After China PMIs beat expectations, with new orders surging back to 2017 level – focus is on commodities strongly rebounding – with the iron ore (SCOA) price rising to a five-day high $126.70, the spot Copper (HG1) price trading at a five-day high, while aluminium is also higher. Coles (COL), Woolworths (WOW) go ex-dividend today, along with Pilbara Minerals (PLS). As a reminder – dividend paying giants, BHP and Rio go ex-dividend this time next week, which could pressure equities.
FX: Dollar unable to bask in yields glory
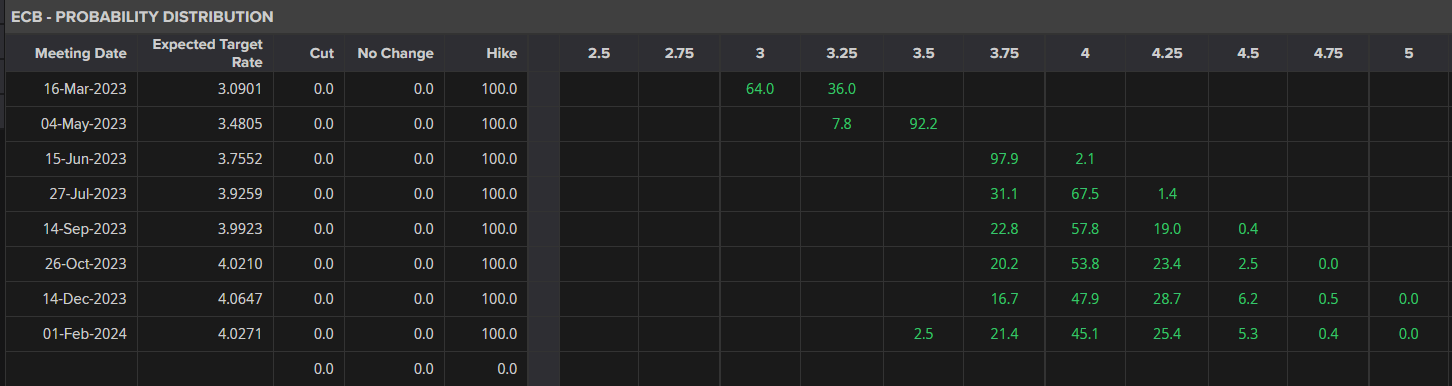
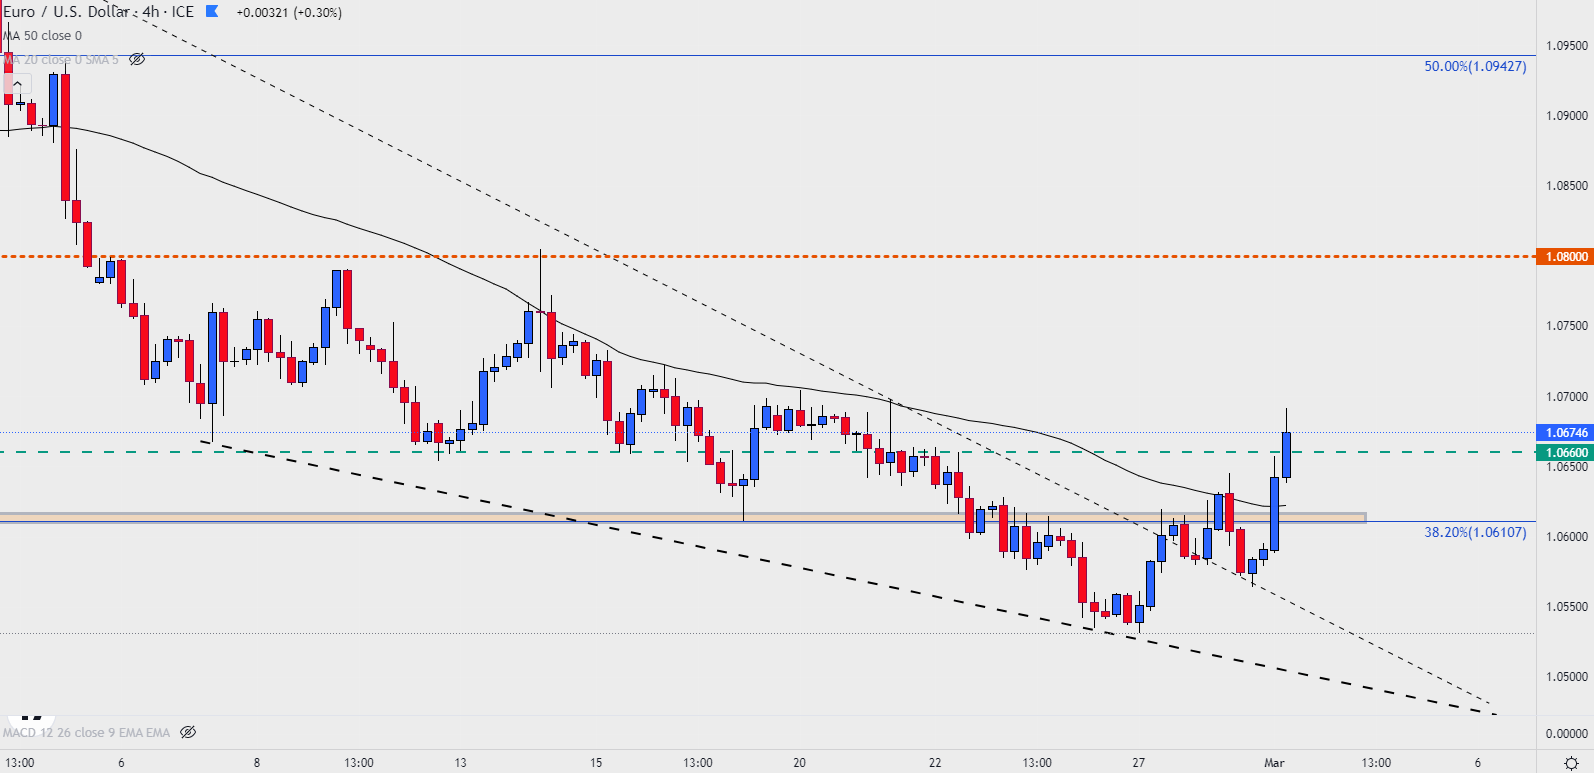
The US dollar was weaker on Wednesday mostly pressured by the gains in Chinese yuan in the Asian session after the upbeat China activity data sent the China reopening theme roaring once again. USDCNH dropped from 6.96 to sub-6.88. Some reversal in the dollar was seen in the US session but it was not enough to reverse earlier losses. Some other currencies also got a bid from the China theme, particularly EURUSD that surged to highs of 1.0691 also underpinned by rising hawkish ECB expectations after hot regional inflation prints. NZDUSD was the outperformer in G10 FX, rising to 0.6276 with Q4 terms of trade returning to positive territory at 1.8% from last month’s -3.9% QoQ. GBPUSD stayed below 1.2100 despite Bailey signaling more BOE hikes may be needed, and saying that the experience in the 1970s showed that doing “too little with interest rates now” may mean more increases later on.
AUD reverses course, rising above its 100-day moving average
The Australian dollar against the US (AUDUSD) advanced for the first time following four days of losses, after China’s manufacturing activity boosted sentiment – hitting a decade high – with new orders improving in February, surging to 54.1 – the highest level since September 2017. This enthusiasm is buoying commodity prices on the notion that demand will rise – the iron ore (SCOA) has risen to a five-day high of $126.70, spot Copper (HG1) hit a five-day high, while aluminium is also higher. This optimism is offsetting the slowing Australian prints released yesterday- with GDP grinding down to pace of 2.7% YoY in the 4Q as expected- while monthly CPI cooled to 7.4% YoY vs the 8.1% price growth forecast. It’s also important to note, short covering has also added to the Aussie dollar rising. Our view is that the Aussie dollar could see strength return in Q2, in line with our view that the commodity bull market will strongly restart in Q2.
Crude oil struggling to lean on Asia/Europe vs. US demand
Crude oil prices remained near recent highs despite the strong signal on Chinese demand recovery from upbeat PMI data. In addition, the inventory data was also bullish signalling a recovery of demand in Asia and Europe. US commercial crude oil inventories gained less than expected last week, rising only 1.2 million barrels as US exports of crude hit a record daily high of 5.6 million barrels last week (+22.4% w/w). However, on the other hand, US ISM data and hawkish Fed speakers continued to highlight inflation fears are here to stay and sparking some US demand concerns. WTI futures traded just below $78/barrel while Brent touched $84.50.
Metals complex excited about China
Copper, aluminum, zinc and iron all traded higher following the outperformance of Chinese PMI data on Wednesday, driving a return of focus to the China reopening theme. Copper, which earlier found support at $4 surged to $4.17 in the Asian morning today, and may take another look at $4.20. However, our head of Commodity Strategy Ole Hansen wrote that the next sustained move higher is unlikely to be triggered until the second quarter or later, the timing to a certain extend depending on the economic outlook for the rest of the world and whether recession, as we believe, will be avoided.
What to consider?
Mixed US ISM survey details – but steady message on inflation
The US ISM manufacturing marginally rose to 47.7 from 47.4, coming in below expectations of 48.0. New orders lifted to 47.0 (prev. 42.5), while employment fell to 49.1 (prev. 50.6), entering contractionary territory. But the message on price pressures continued to roil markets. ISM priced paid rose back into expansionary territory to 51.3, well above the prior 44.5 and the expected 45.1, re-affirming that it may be too soon to call goods inflation disinflationary.
Hawkish Fed talk brings 10-year yields to top 4%
Fed member Kashkari (voter) signaled an openness for a 50bps hike at the March meeting, saying he is open to both 25bps and 50bps. Still, he emphasized that the terminal rate is more important than the size of rate hikes, where also he hinted that it could be revised higher from December. Another member Bostic (non-voter) maintained his view that the Fed policy rate needs to rise to 5.00-5.25% range, but said that the rate should be left there “until well into 2024”. 10-year Treasury yields rose above the key 4% mark for the first time since November, sending another warning signal to equities.
China’s PMIs signaled recovery picking up steam
The headline official NBS PMI surged to 52.6 in February, the highest print since 2012, from 50.1 in January. The strength was across the board with production and new orders improving markedly and the new export orders unexpectedly surging to 52.4, the first time into the expansion territory in 23 months. The NBS non-manufacturing PMI and the Caixin Manufacturing PMI, also released today, both bounced strongly and signaled economic expansion. Readers can find more on China’s PMI here.
Hot German inflation print creates further pressure for the ECB
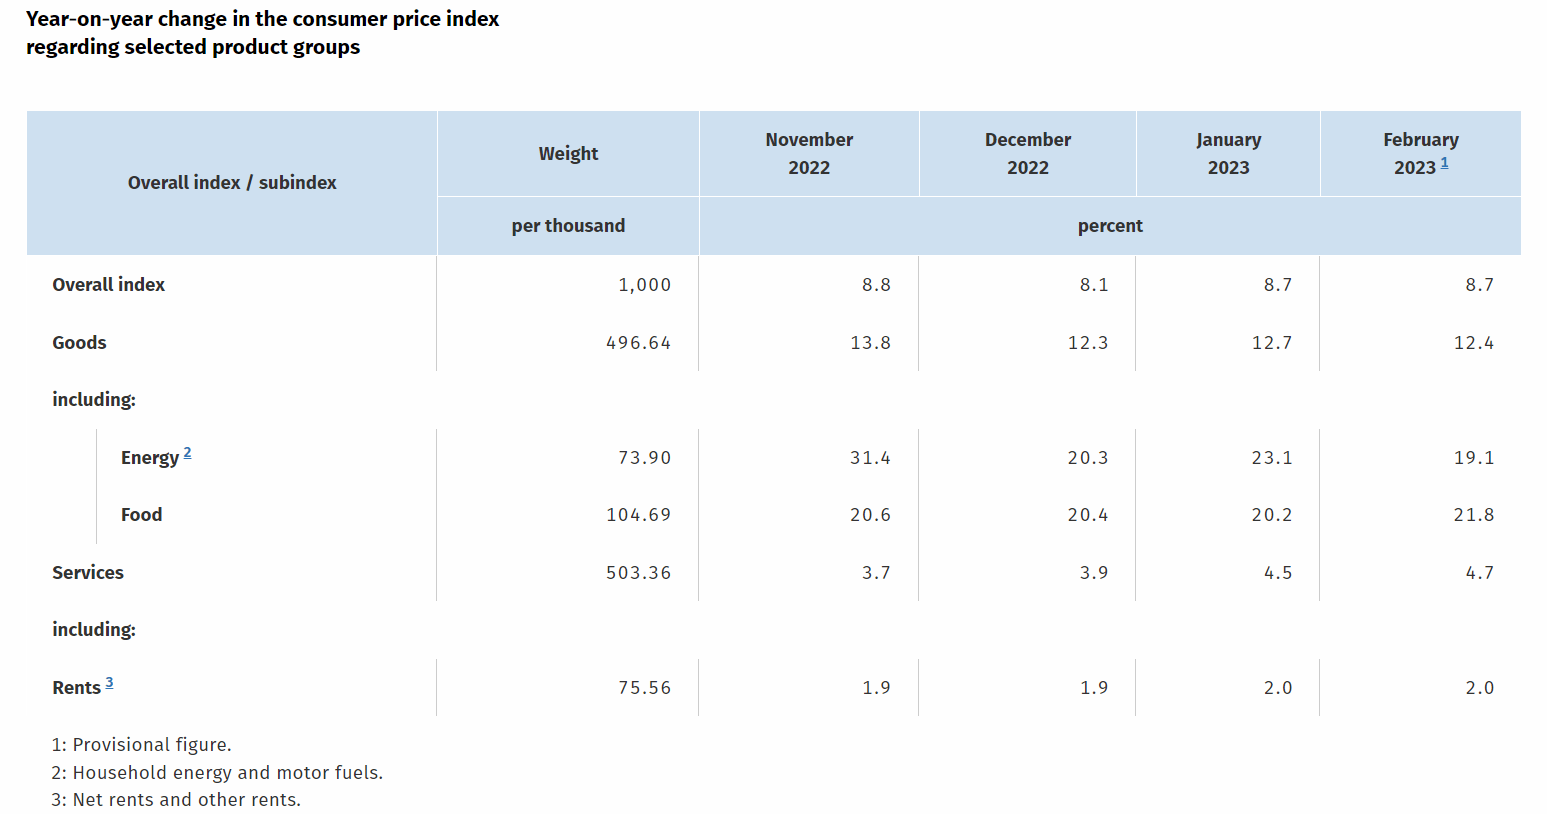
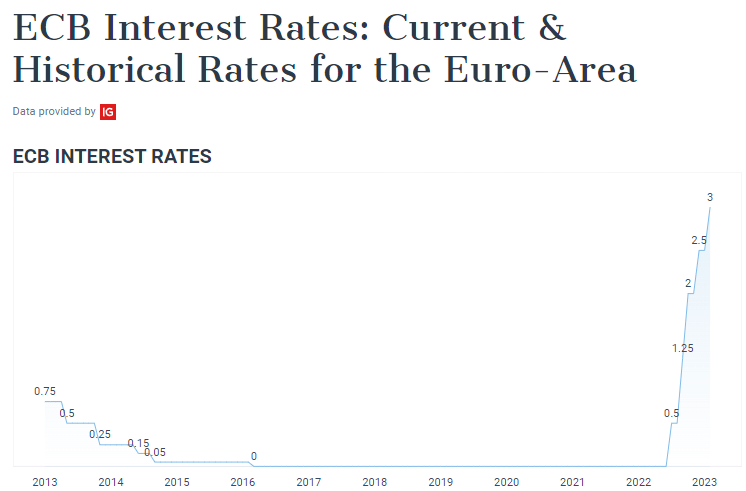
Coming on the heels of hotter than expected inflation prints in France and Spain for February, German CPI print was also hotter than expected at 9.3% YoY (vs. +9.0% exp and +9.2% prior). The message on disinflation has therefore continued to weaken, and both Fed and ECB are likewise pressured to do more on policy tightening to ensure the inflation comes back to target. Th aggregate Eurozone print is out today and expectations of a softening to 8.3% from 8.6% last month may be tested.
Tesla plots a path to renewable energy at Tesla Investor Day
As part of Tesla’s “Master Plan” for the company, Musk said Tesla’s next phase of growth will be built around building clean energy sources – that can serve a much larger world population – without great economic sacrifice. Moving into sustainable energy might mean moving into heat pumps- as they can dramatically cut home and office heating costs. Tesla dubs them one of the low hanging fruits in the sustainable energy transition. Tesla’s shares are up 97% from their January low.








 Chat now!