US Dollar Weekly Forecast: Will Another Solid Jobs Report Boost the Greenback?

US Dollar Weekly Forecast: Will Another Solid Jobs Report Boost the Greenback?

The US Dollar aimed slightly lower this past week, with the DXY Dollar Index falling 0.7%. Broadly speaking, the best week for the S&P 500 since January (+1.9%) meant that sentiment was a key driver for financial markets. This dampened the demand for safe havens, such as the US Dollar. Traders might be getting ahead of themselves amidst this cheery mood.


Investors seemed to focus on comments from Atlanta Fed President Raphael Bostic. He said that the central bank could perhaps pause hiking rates this summer. Meanwhile, Richmond Fed President Thomas Barkin noted that he does not see that case for pausing hikes “at this moment”. Given these comments, it looks like markets are fixating more on the dovish side of things, which is not surprising.

Recent inflation data (including CPI and the Fed’s preferred PCE gauge) pointed to slowing disinflation. This was further confirmed by ISM prices paid data this past week, which unexpectedly surprised higher. In other words, the deceleration in inflation is slowing. That is not particularly something that the central bank wants to see, especially amid a still-tight labor market.

Speaking of that, all eyes will turn to the next non-farm payrolls report this week. The data is due to cross the wires on Friday at 13:30 GMT. The country is seen adding 215k jobs in February with the unemployment rate holding at 3.4%. Crucially, the labor force participation rate is seen stuck at 62.4%. This means that to this day, the active workforce has still not recovered to pre-pandemic levels.

The lack of labor supply has generally meant higher wages as firms competed over a relatively smaller share of potential workers. The Citi Economic Surprise Index tracking the US remains in positive territory and is sitting around the highest since April 2022. This means that economists have generally been underestimating data outcomes.

That is opening the door to an upward surprise in the jobs report. Such an outcome would likely pour cold water on hopes of pausing tightening this summer. On the chart below, markets are now pricing in about a 5.5% federal funds rate by year-end. That represents an extra 2 hikes compared to estimates at the end of January. As such, more dovish disappointment is opening the door to a stronger US Dollar.

A More Hawkish Fed is Becoming the Increasingly Base Scenario

A More Hawkish Fed is Becoming the Increasingly Base Scenario

Gold Technical Forecast: XAU/USD Bull Run Extends

Gold Technical Forecast: XAU/USD Bull Run Extends

Gold Shines into the Weekend

The precious metal is on track to post a more than 2% pullback this week, revealing a strong reluctance to break below the psychological 1800 level. The well-established 1800 level provided sufficient value for bulls to send gold higher this week. The next major level ahead appears at 1875, a level that has proven to be a pivot point in the past, limiting prior bullish price action.

Gold Weekly Chart


The daily chart at the end of the London session sees gold trading well above 1833, the tripwire for an extended move higher. With the precious metal on track to close above 1833, it is necessary to identify future potential levels of resistance into next week.

The 50-period simple moving average (SMA), often used to gauge the medium-term trend, retains its upward slope and presents the next level of resistance, followed closely by 1875. Thereafter, a return to the zone of resistance at 1910 becomes relevant.

Should bears overwhelm bulls now that prices have move a fair amount off the low, support remains at 1833, followed by the big 1800 level. The imminent MACD crossover suggest momentum is turning, reinforcing the bullish bias.

Gold Daily Chart


image2.png


The 4-hour chart reveals intra-day levels of note, as gold currently tests 1847.50. The last two candles and the current 4-hour candle suggest a fair amount if resistance at this level after approaching and respecting the level. A break and hold above this level certainly reinforces a bullish bias but necessary follow through may have to wait for next week. A failure here, could see prices head back towards 1833.

Gold 4-Hour Chart


image3.png


Canadian Dollar Outlook: USD/CAD Halted by Event Risk. Fed, BoC on Deck

Canadian Dollar Outlook: USD/CAD Halted by Event Risk. Fed, BoC on Deck

The Federal Reserve and the BoC (Bank of Canada) are on this week’s event risk as market await the BoC interest rate decision and Fed Chair Powell testimony. With interest rate forecast continuing to contribute to driving volatility, the BoC is expected the pause its on their policy rates while the Federal Reserve will likely increase rates by a further 25 basis points.

The Federal Reserve Rate Probability

Bank of Canada (BoC) Policy rates Distribution

With interest rate differentials widening between the two currencies, any changes to the narrative or the repricing of new information could influence price action.

Although the Fed has remained hawkish over recent weeks, the remainder of the economic docket poses an additional threat for volatility for USD/CAD.

USD/CAD Technical Analysis

On the daily chart below, USD/CAD is currently testing the 1.36 psychological handle, settling around this zone over the past two sessions. With the two doji candles suggestive of indecision, a break of this zone could drive prices in either direction.

For bullish continuation to be probable, the Canadian Dollar would need to breach 1.365 and retest 1.370. However, if prices falter and trade below Fibonacci support around 1.356, bears may have the opportunity to push prices toward prior support at 1.346.

USD/CAD Price Chart (Daily)


US Dollar Bounces Back Again as the Fed and ECB Map Out Rate Hikes. Higher USD?

US Dollar Bounces Back Again as the Fed and ECB Map Out Rate Hikes. Higher USD?

The US Dollar rallied again overnight after hawkish comments from Boston Fed President Susan Collins highlighting that interest rates will need to be lifted and the extent of the rises will be data dependent.


Better-than-expected jobless claims also buoyed the mood before Raphael Bostic from the Atlanta Fed tempered the celebrations by suggesting that rates may peak in the coming summer. Although he did say that raising rates slowly and steadily was the right course of action.

Federal Reserve Governor Christopher Waller also chimed after the bell and said that rate hikes could be more aggressive if the data warranted it.

Nonetheless, the overnight index swap (OIS) and futures markets are pricing in a 25 basis point hike at the next 3 Federal Open Market Committee (FOMC) meetings. At one stage overnight the futures market was implying a terminal rate from the Fed of almost 5.5%. A long way from the 4.90% that was priced back in January.

Treasury yields continued their trot toward new highs with the 2-year bond trading at 4.94%, the highest since July 2007 while the benchmark 10-year note is ensconced above 4%, as it nudged 4.09%

The DXY index retraced the previous day’s losses into the New York close, but it has eased slightly into the Asian session.

The DXY index is a US Dollar index that is weighted against EUR (57.6%), JPY (13.6%), GBP (11.9%), CAD (9.1%), SEK (4.2%) and CHF (3.6%).

While the Fed is concerned about ensuring they are in front of the curve when it comes to tightening, the European Central Bank appears to be playing catch as inflation data there re-accelerated.

Yesterday, the Euro-wide month-on-month CPI jumped to 0.8% for February, well above the 0.5% anticipated and -0.2% prior. The year-on-year read was 8.5% rather than the 8.3% forecast and 8.6% previously.

The OIS market has a 50 basis points lift by the European Central Bank (ECB) at its meeting in 2 weeks time with potentially more hikes of 50 down the track. EUR/USD slipped under 1.0600 yesterday but it has recovered somewhat.

While San Francisco Fed President Mary Daly will be speaking later today, the focus will be on Fed chair Jerome Powell next week. He will be testifying in front of the Senate Banking Committee when he presents his semi-annual Monetary Policy Report on Tuesday

DXY INDEX AGAINST TREASURY 2- AND 10-YEAR YIELDS

image1.png


Japanese Yen Price Action: USD/JPY, EUR/JPY, AUD/JPY

Japanese Yen Price Action: USD/JPY, EUR/JPY, AUD/JPY

Atlanta Federal Reserve President Raphael Bostic’s “slow and steady” remarks appear to have stalled USD/JPY’s rise for now. Bostic echoed a few other Fed officials’ recent remarks that rate-setters may not revisit the jumbo rate hikes of 2022 despite the recent strong US data. In this regard, US monthly jobs and consumer prices data due in the coming days would be key. Also, Fed Chair Powell is due to speak next week at a semi-annual testimony.

USD/JPY 240-minute Chart

image1.png

The Japanese yen weakened on Thursday after the US Treasury 2-year yield rose to a fresh 15-year high and the US Treasury 10-year yield rose to a four-month high – a reflection of strong US data in recent weeks. US Rate futures are now pricing in the Fed’s target rate to peak around 5.45% in September from the current 4.50-4.75%, compared with under 5% at the end of January. What are the charts saying?

USD/JPY – Rally showing signs of fatigue?

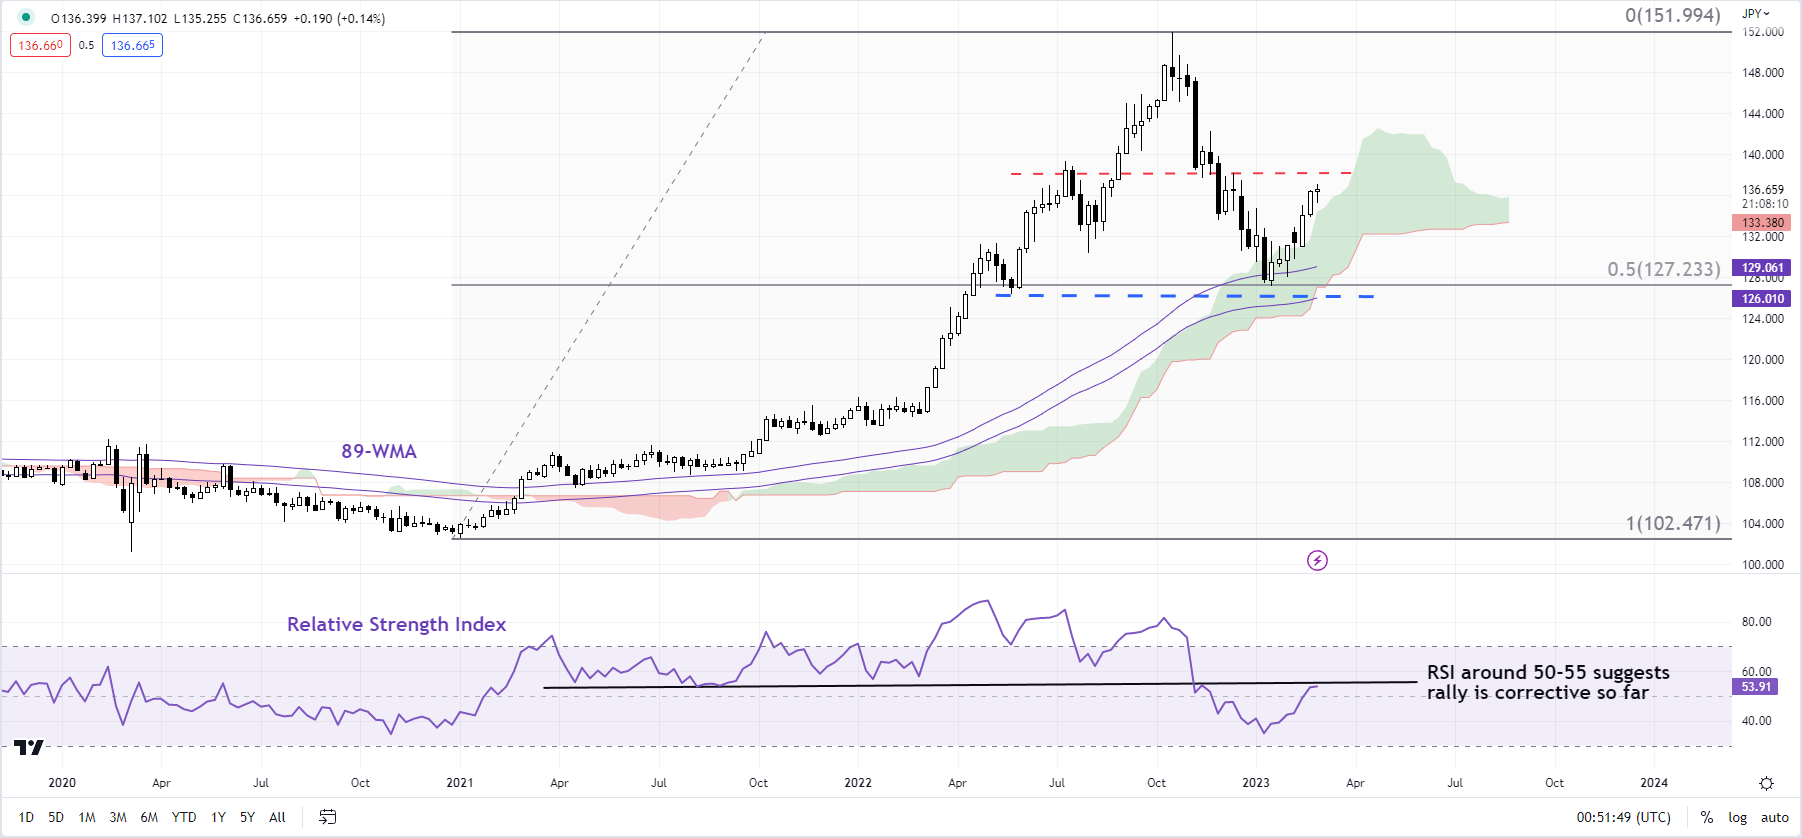
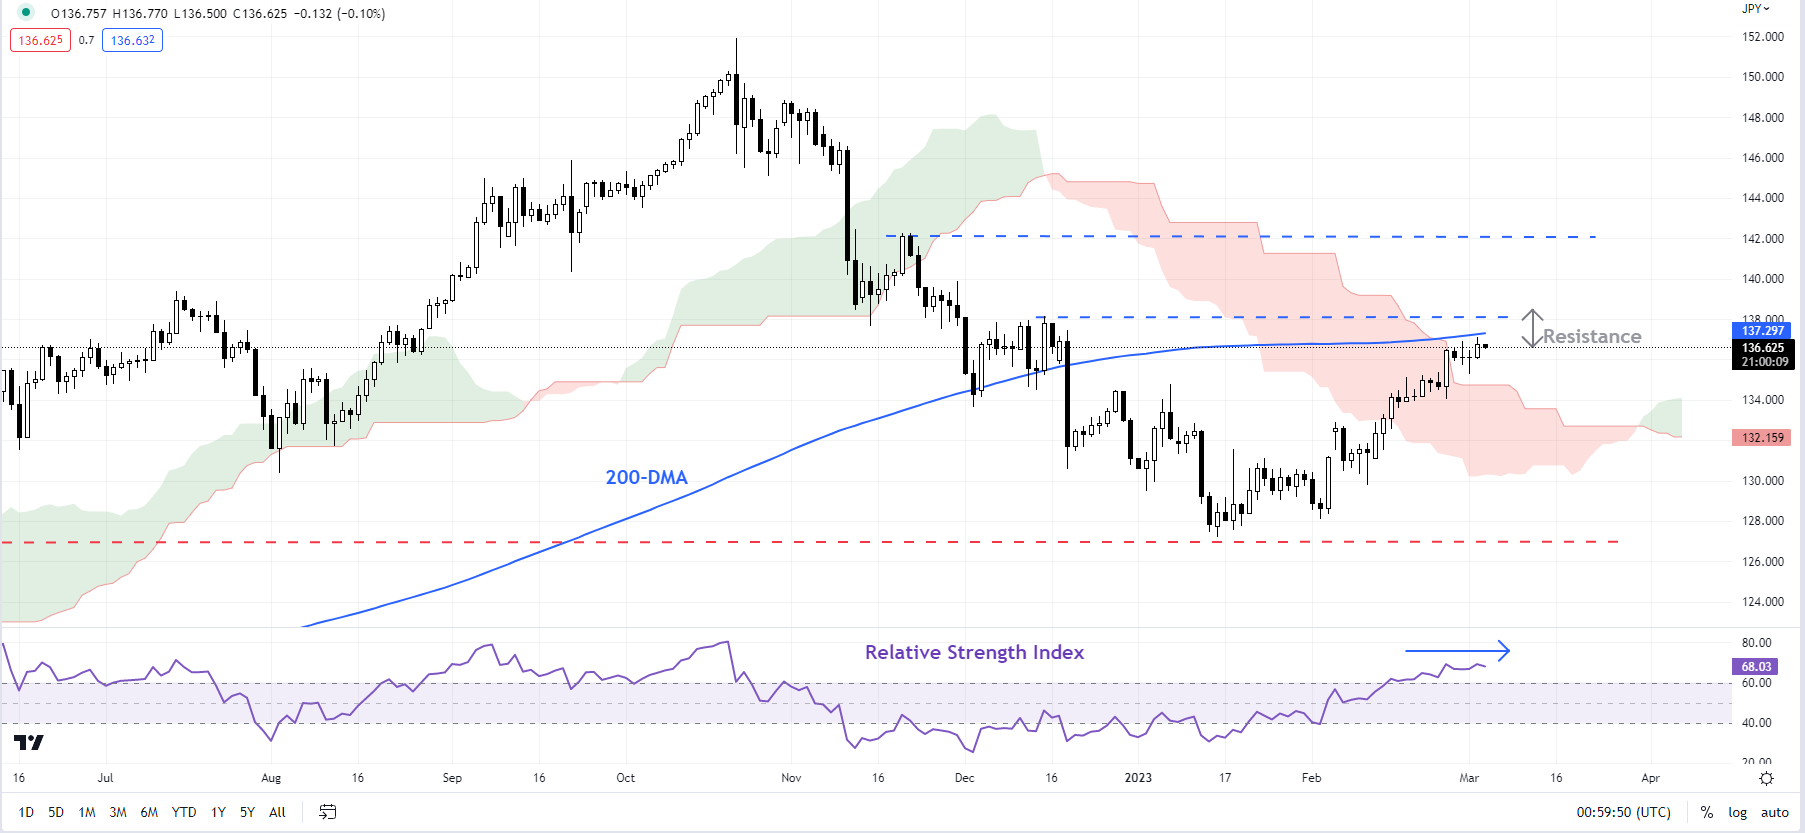
There are tentative signs emerging that USD/JPY’s six-week-long rally is beginning to lose steam as it tests a tough resistance area at 135.00-138.00, including the early-January high, the 200-day moving average, coinciding with the upper edge of the Ichimoku cloud on the daily charts, not too far from the December high of 138.20. For more discussion on the topic see “Japanese Yen Forecast: High Bar for USD/JPY to Crack Resistance”, published February 26.

USD/JPY Weekly Chart

image2.png

Chart Created Using TradingView

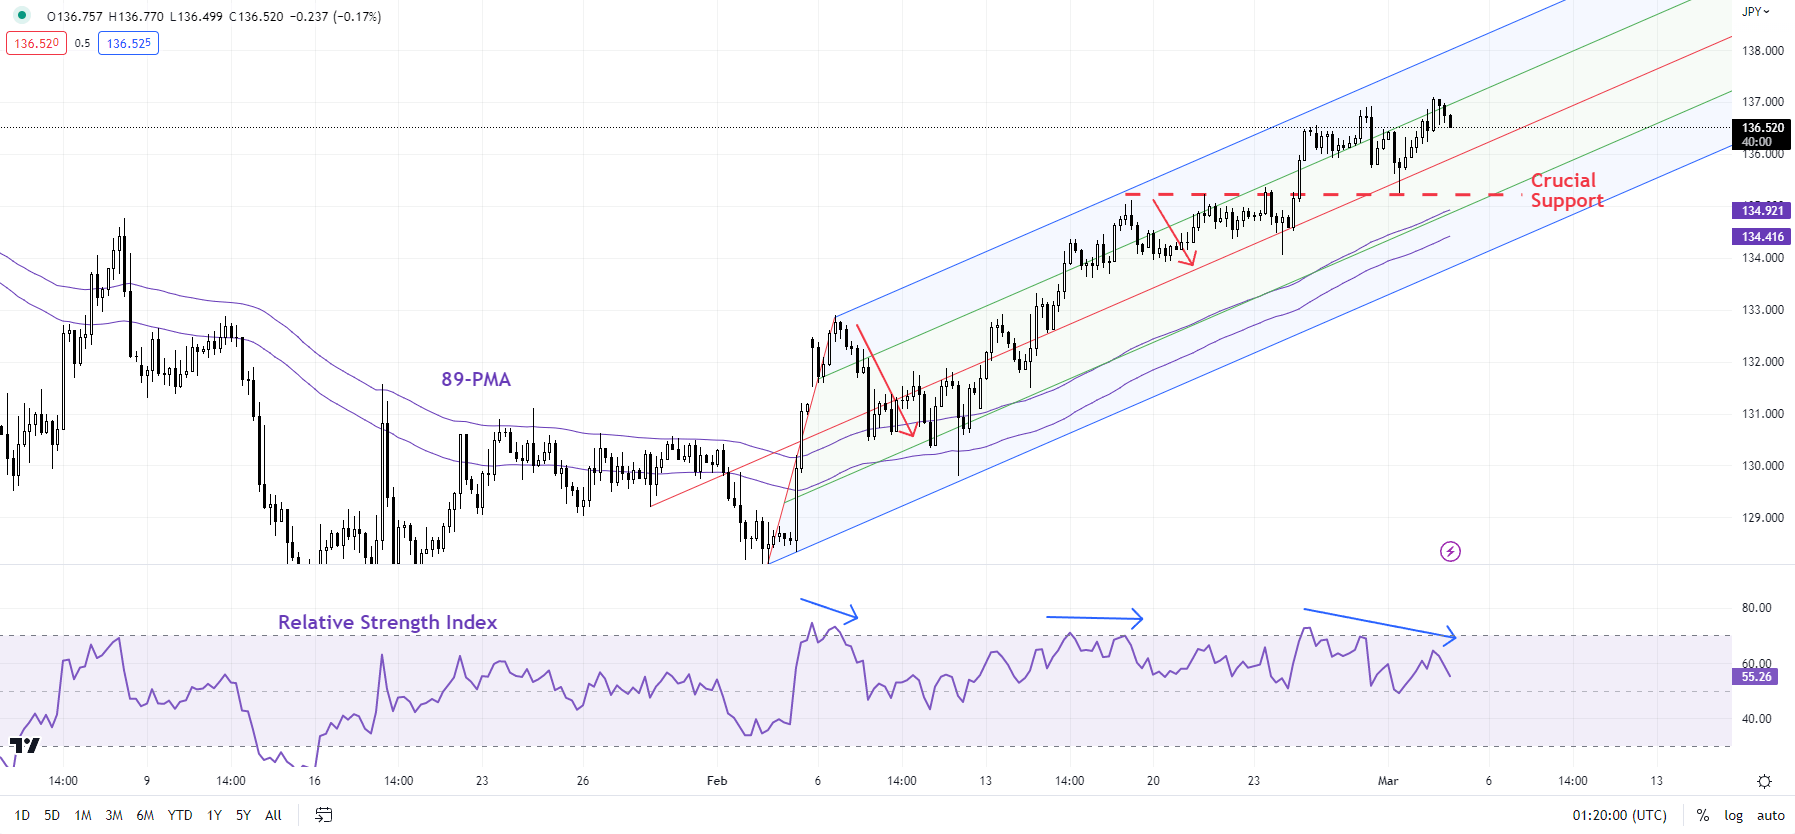
Negative divergence on the 240-minute and daily charts indicates that the rebound is beginning to look tired. To be sure, there is no sign of reversal of the nascent uptrend just yet. USD/JPY would need to break below immediate support on a horizontal trendline from about 135.25 for the short-term upward pressure to fade. Furthermore, any break below 133.75-134.50: including the 89-period moving average on the 240-minute chart, the lower edge of a rising pitchfork channel from January, and the February 24 low, would raise the odds that the short-term uptrend was reversing.

USD/JPY Daily Chart

image3.png

EUR/JPY – Slight upward bias within a broad range

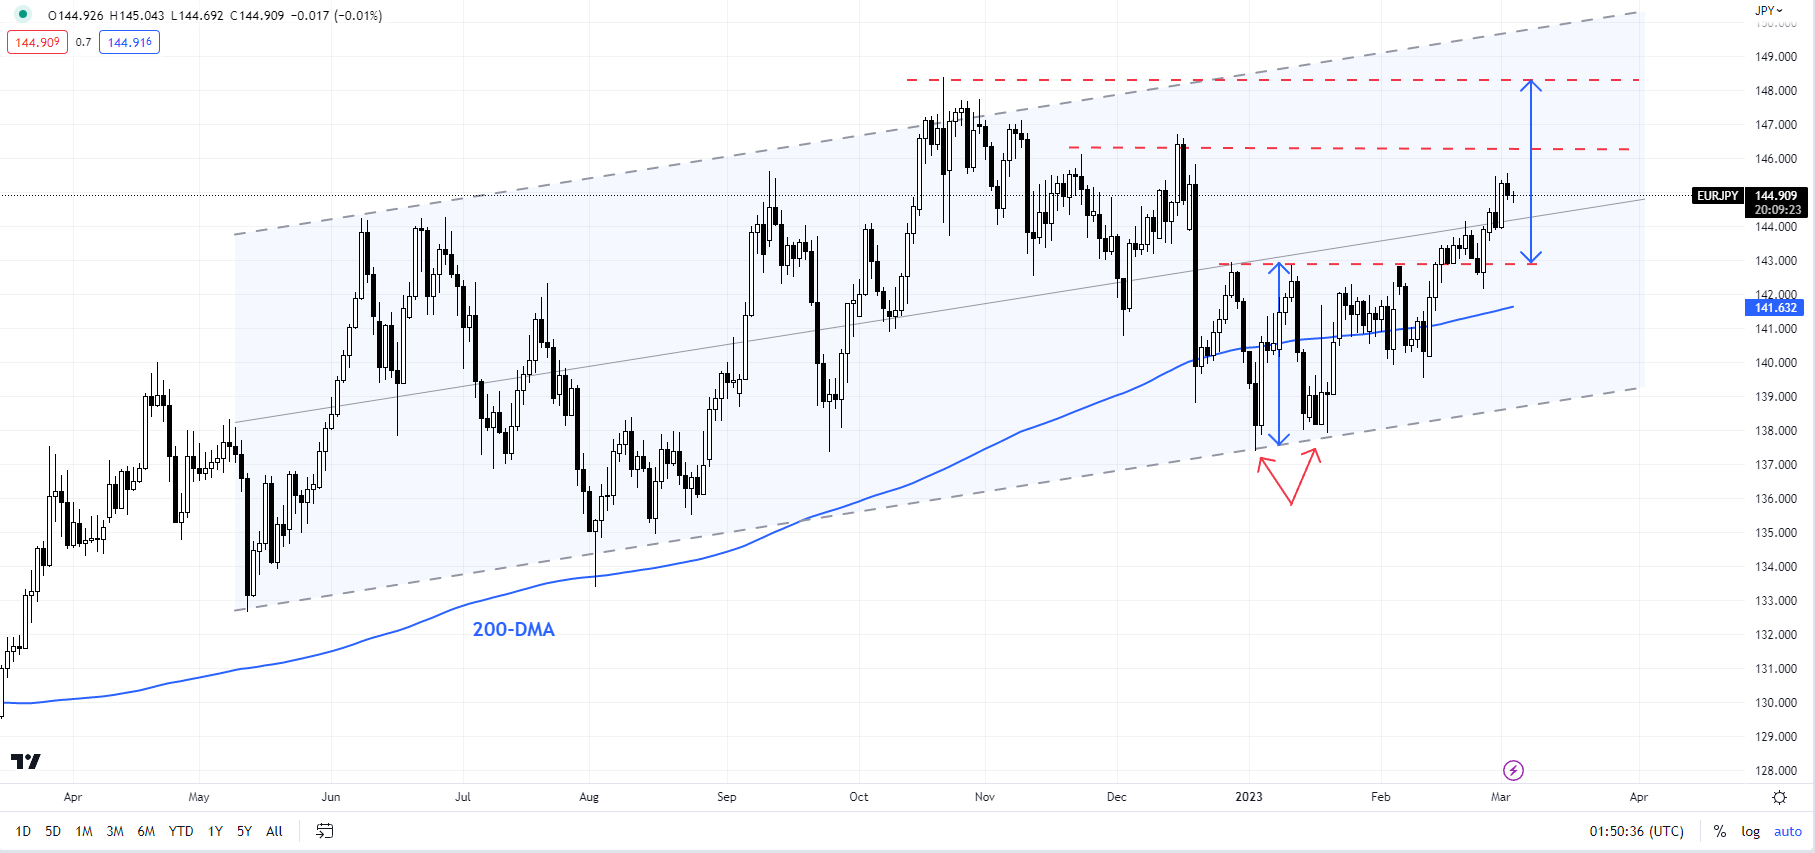
EUR/JPY’s break above a horizontal line from the end of December at about 143.00 triggered a minor double bottom (the January lows) with a potential price objective of 148.00, coinciding with the October high. However, zooming out a bit, EUR/JPY has been in a choppy range since mid-2022, albeit with a gradual upward bias. For the emergence of a material trend, the cross would need to break above the October high of 138.40 or fall below the January low of 137.40.

EUR/JPY Daily Chart

image4.png

Chart Created Using TradingView

AUD/JPY – Flirts with a tough hurdle

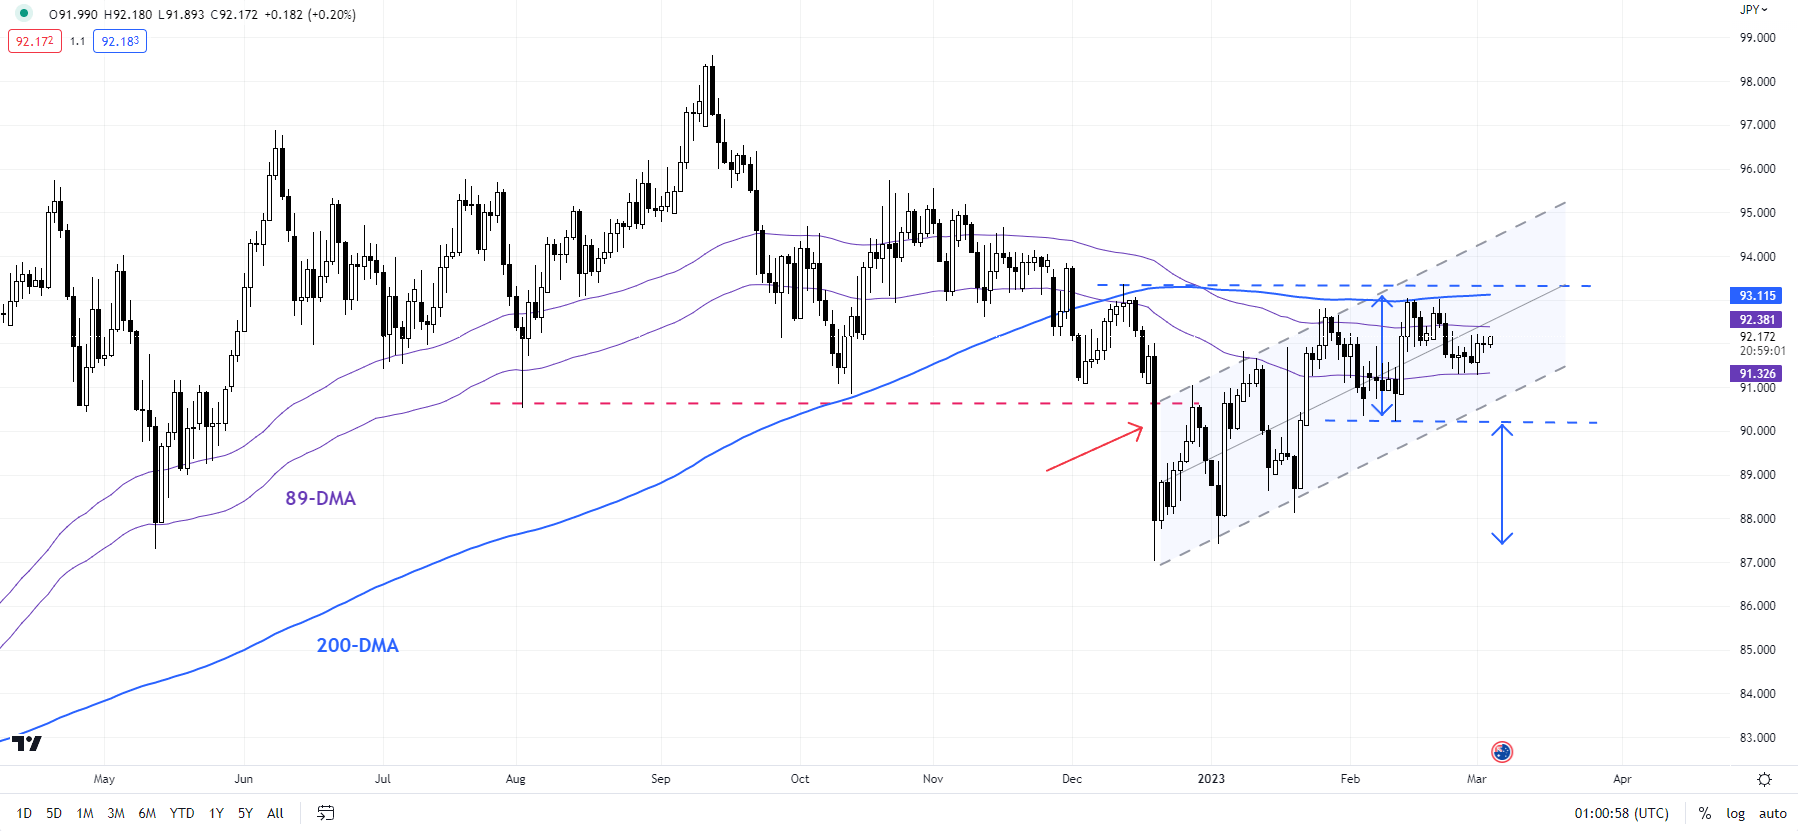
AUD/JPY continues to be snowed under a heavy barrier around 93.00-93.50, including the 200-day moving average, the mid-December high of 93.35, roughly coinciding with the upper edge of a rising channel from December. On the daily charts, the rebound from December looks corrective, that is, the trend is bearish after the cross’ drop in December below a slightly upward-sloping trendline from August triggered a break from a bearish topping pattern. In this regard, AUD/JPY would need to clear the November high of 95.50 for the downward pressure from September to reverse.

AUD/JPY Daily Chart


image5.png

Chart Created Using TradingView

S&P 500 Price Forecast: Treasury Yields Peaking? SPX Taking Strain

S&P 500 Price Forecast: Treasury Yields Peaking? SPX Taking Strain

SPX FUNDAMENTAL BACKDROP

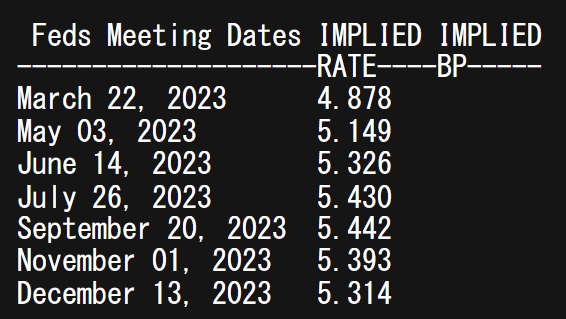
The S&P 500 index remains under pressure (with US equity futures pointing at yet another red open) despite the turnaround in yesterday’s trading session that saw a marked pullback after hawkish Fed speak. Governor Christopher Waller suggested that the Federal Reserve may need to raise rates higher than what is already being priced in (see table below). This came after better than expected jobless claims data that supplemented the already tight labor market in the US.

FEDERAL RESERVE INTEREST RATE PROBABILITIES

image1.png

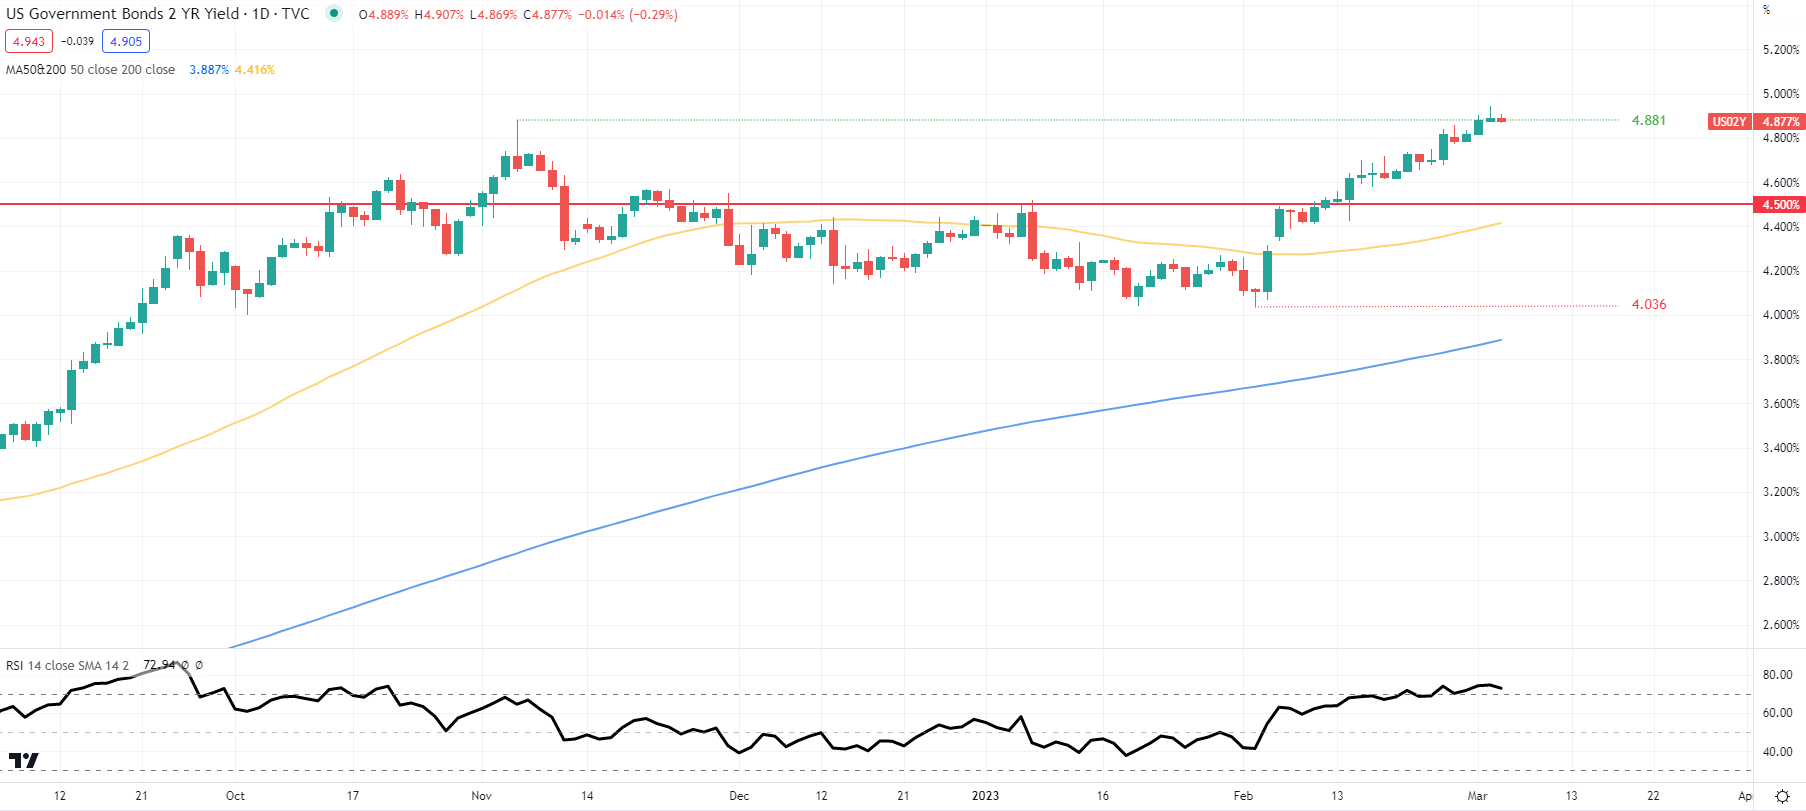
The US 2-year Treasury yield shown below breached the November 2022 swing high at 4.881% but swiftly pulled back below. Treasury markets are now at a key inflection point that could be hesitating before another leg higher in which case US stocks will likely continue their decline on weaker valuations. On the contrary yesterday’s long upper wick is traditionally associated with subsequent downside and may point at a peak in the recent hawkish repricing of the Fed’s rates.

U.S. 2-YEAR GOVERNMENT BOND YIELDS


image2.png


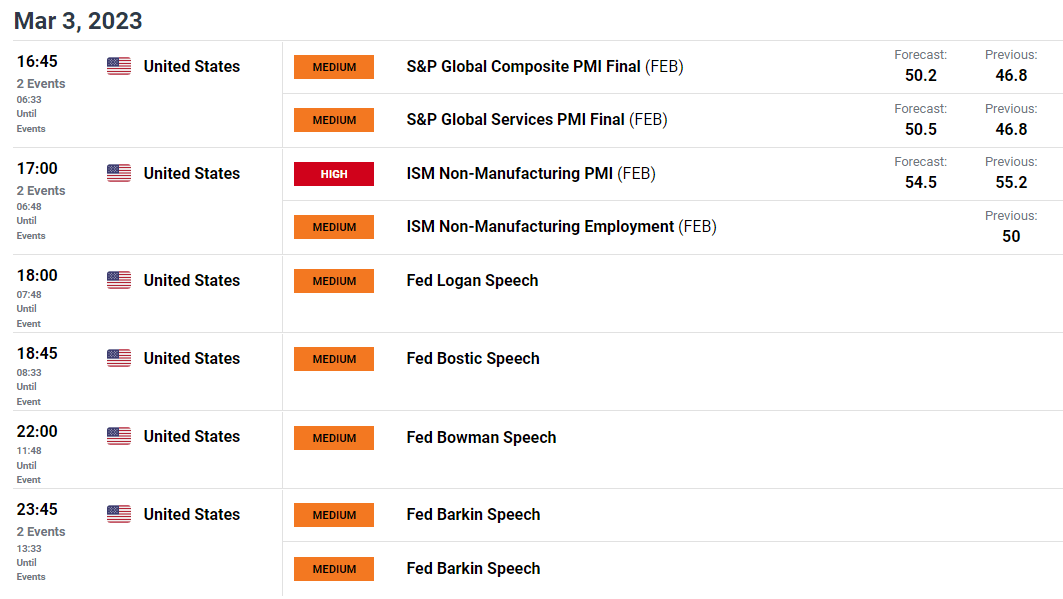
Later today, the ISM services PMI release will dominate headlines over the S&P report which is viewed in a lesser manner in the US. This report is key for markets as the US is primarily a services driven economy and while expectations are set to decline for February, the figure remains within expansionary territory. The trading day will close off with a host of Fed speakers who will likely continue with their aggressive tone even if PMI data misses.

U.S. ECONOMIC CALENDAR

image3.png

TECHNICAL ANALYSIS

SPX WEEKLY CHART

image4.png

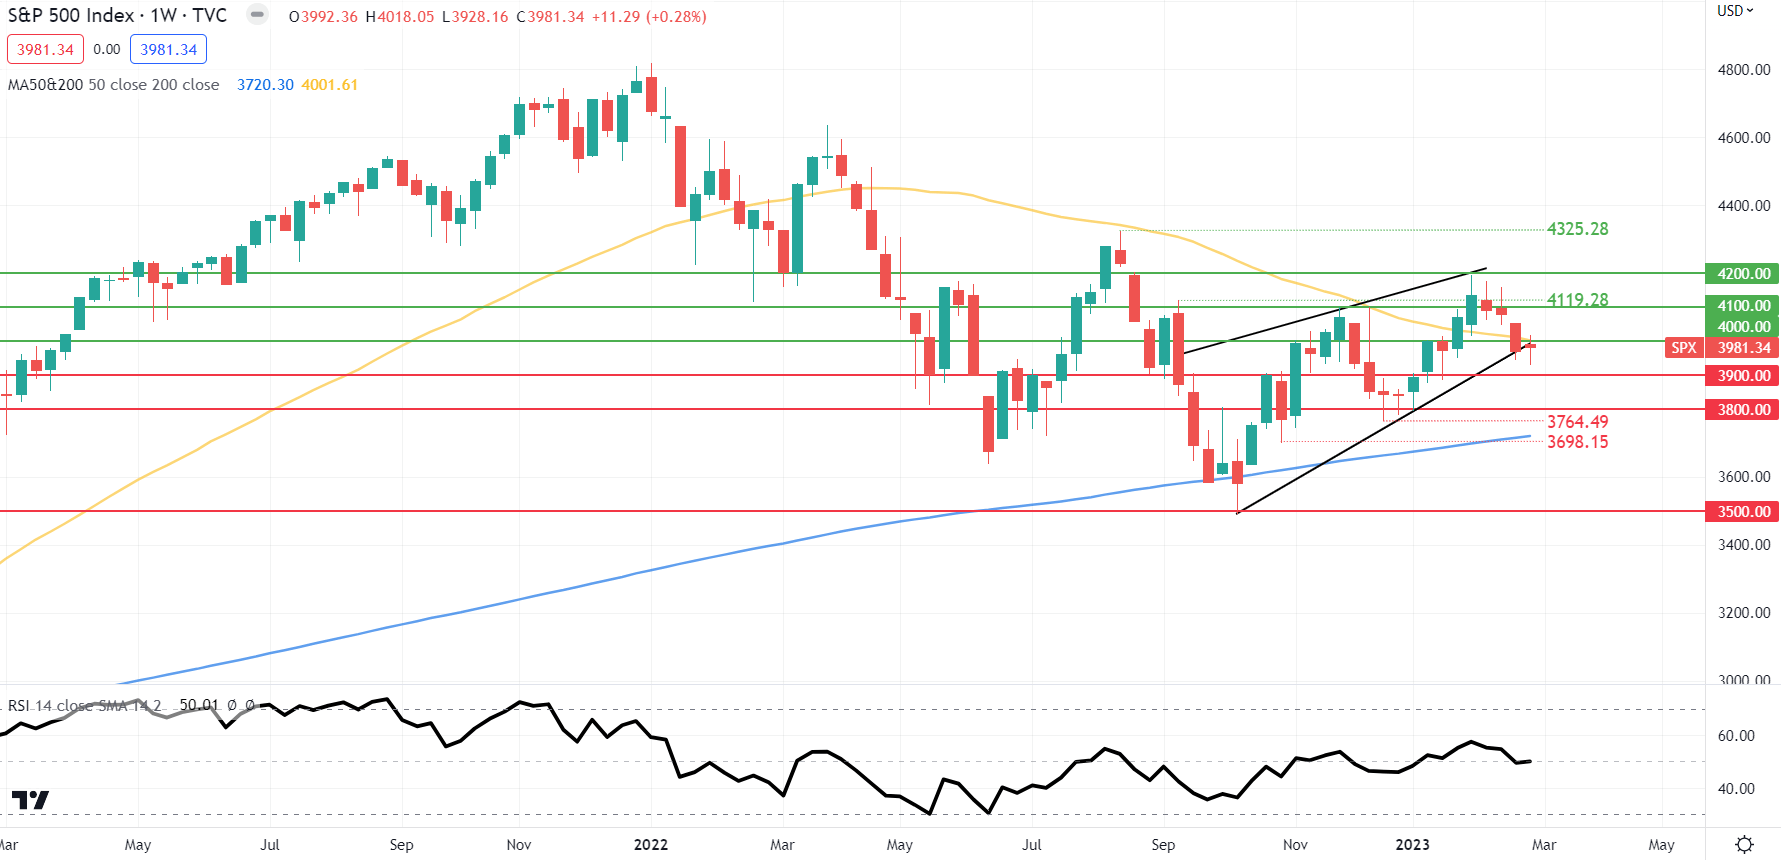
The weekly SPX index chart above shows the rising wedge chart pattern (black) flirting with a break lower and this weeks candle close will prove key to next week’s directional bias. A close lower could likely open up a move down towards the 3900.00 psychological level.

image5.png

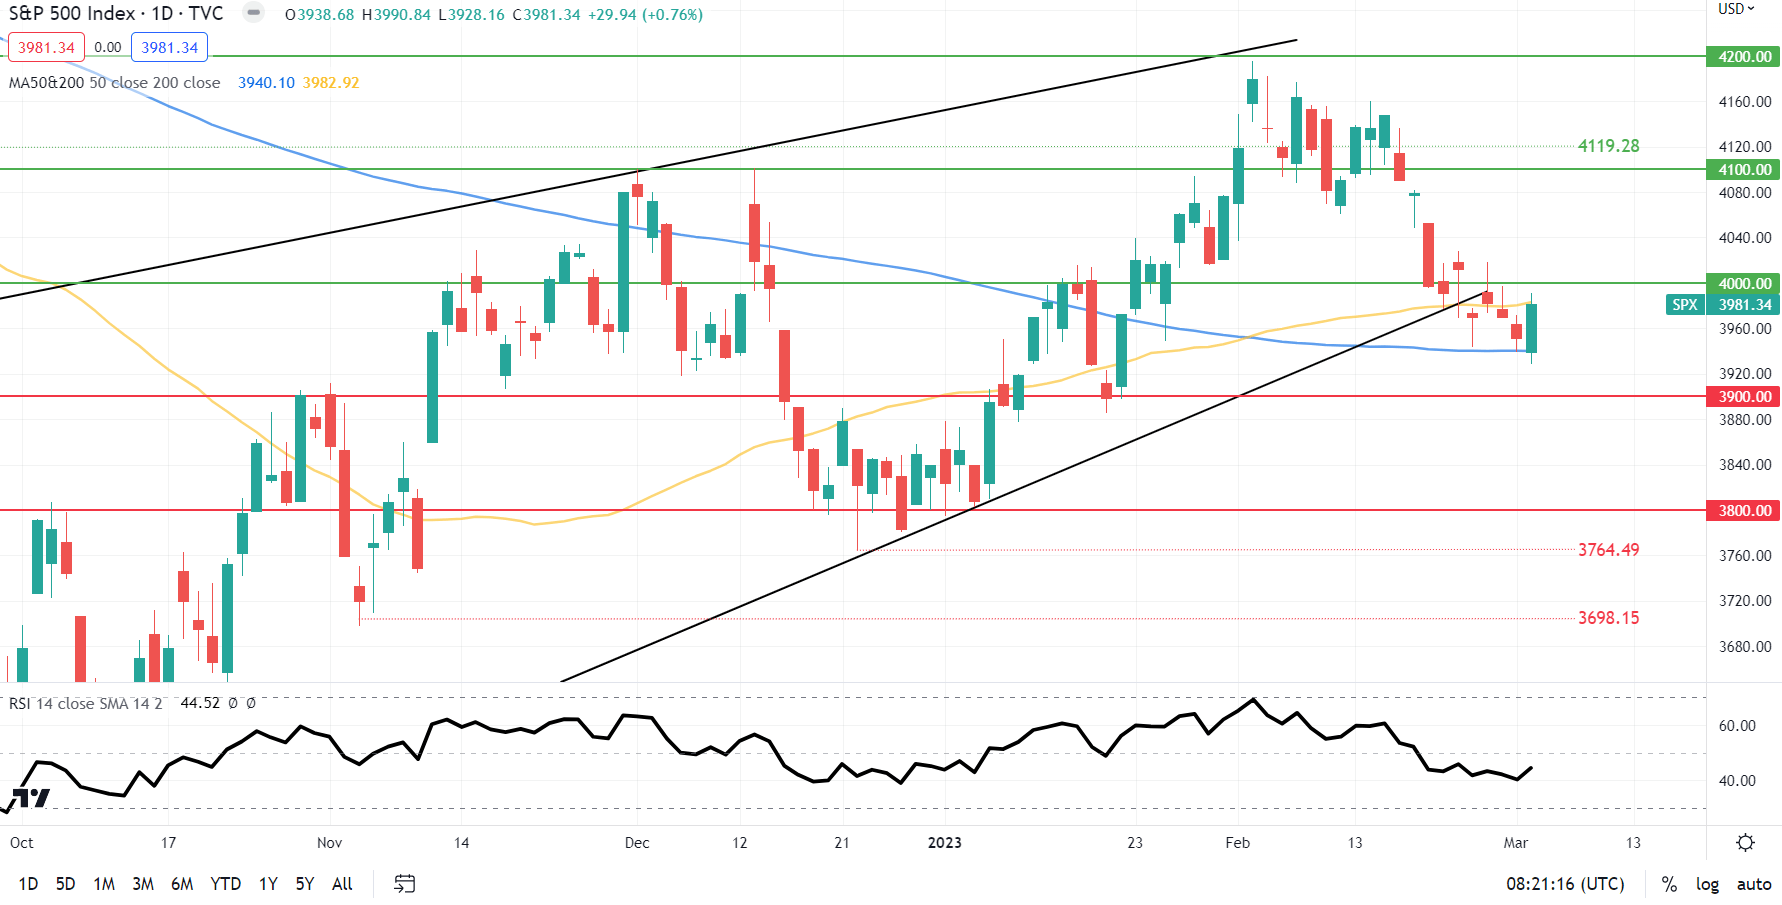
Focusing in on the shorter-term daily chart, the 200-day MA (blue) has been a firm port of call for bulls who have defended this zone in three separate sessions of late. Weak fundamental data could catalyze a breakthrough while a close above 4000.00 could invalidate a short-term push lower.

Taking Your Trading International: Risks and Rewards

Taking Your Trading International: Risks and Rewards

Traders tend to focus on their domestic markets at the start of their careers. That’s natural and understandable enough. Local knowledge of conditions and market dynamics is likely deeper, the essential feeling of being plugged into the economic news cycle that much stronger. At the most basic level we all make more confident decisions when we feel we have more relevant facts at our command. Traders are certainly no different.

However, it’s now very easy to access global assets, be that in the foreign exchange, fixed-income, equity or commodity space. It can be well worth taking advantage of the opportunities offered by a broader geographical spread.

Traders usually look overseas for two main reasons. The first is to diversify trading opportunities, broadening their risk profile and reducing reliance on market conditions in just one place. The second is to take advantage of perhaps better growth prospects elsewhere.

So if you feel it’s time to start trading beyond your borders, what’s the best way to start?

image1.png

Stick to Major Markets At First, They’re Easier to Trade Out Of

When looking at overseas markets for the first time, it’s probably wise to cleave to the major ones. They’ll offer the deepest and most liquid pools of capital and the sort of trading environment that makes it easier to get out if you make a mistake. Which you probably will.

In foreign exchange think of the ‘major’ currencies. The US Dollar and the Euro dominate, with the Japanese Yen, Swiss Franc and British Pound also very widely traded. Below them, the dollars of Australia and Canada are popular trading choices. China’s Renminbi as well as the Hong Kong and New Zealand Dollars round out the global top ten. Those countries’ stocks and bonds are likely the first stops in international trading in those asset classes too.

Are You Risk On, or Risk Off?

Now is certainly an interesting time to consider an overseas approach as we could be seeing a major change. The last couple of decades were years of extraordinary connectivity between global markets as economies became more and more globalized, inflation was docile and interest rates low.

The effect of this was to sort nearly all global assets into just two camps, which went by the somewhat bizarre monikers of ‘risk on’ and ‘risk off.’ What they meant was that, when a piece of economic data was released suggesting stronger growth ahead – perky US employment figures, strong Chinese industrial production or what have you – the ‘risk on’ assets would rise in impressive unison.

These included stock markets, industrial commodities and the currencies of major commodity producers, such as Australia and Canada. The stronger global growth was, the greater the demand for commodities and the currencies needed to buy them. That’s a fairly clear correlation.

On the flipside, weaker economic numbers would see ‘risk off’ assets supported. The ranks of these included perceived ‘haven’ currencies like the Swiss Franc along with gold, bonds and, often, for specific reasons of its own, the Japanese Yen. With ultra-low interest rates long the norm in Japan, it’s hard to see the Yen as any kind of real haven for investors. But those same low rates forced Japanese investors to look overseas for yield. When overseas growth seemed threatened, a lot of that cash came home.

This market connectivity was enhanced by the monetarism which had gained force since the early 1980s, part of a concerted global effort to smash the inflationary forces which had played hell with developed economies in the 1960s and ‘70s. Interest rate policy became the key global market driver, much as industrial policy had been in the generation before. The US Federal Reserve tended to run this table, with just about every traded market on Earth reacting to what the Fed did, said and implied about the future.

It still does. Other major central banks tend to shadow the Fed to some extent, but they, too generate significant cross-market impact.

We’re still living in that world to a very large degree, but it’s clear that some changes have taken place over the past twelve months. An inflation surge, the Covid pandemic’s supply chain destruction and war in Ukraine have all taken their toll, as have deteriorating relations between China and the West. Previously unchallenged, even economic globalization is up for debate as never before. Nervous Western politicians increasingly seek supply security rather than merely encouraging ever-freer trade.

So, What Now?

For the trader considering a move out of his or her home market these are certainly interesting times. If current conditions persist we are likely to see more fragmented, less correlated and less liquid markets. These will of course bring opportunities of their own, but taking advantage of these will very likely require a lot more learning and judgement than would have been the case in a more globalized world.

It’s likely that those countries most successful in the anti-inflation fight, and their markets, are going to be the near-term winners. But the extent to which that dynamic replaces the old risk calculus, and how durably, is perhaps the most important thing for would-be global traders to weigh up right now.

Gold Price Forecast: Bulls keep pushing after strong Chinese Services PMI

Gold Price Forecast: Bulls keep pushing after strong Chinese Services PMI

Gold price bulls have returned to action this week, helping the bright metal break out of a bearish trend that had dominated XAU/USD price action during February. What has been more impressive is that Gold has been able to rally despite US Treasury bond yields gathering strength, which usually supports the US Dollar and weighs on yield-less commodities.

Gold news: Chinese PMI boost

Strong PMI data from China, both in Manufacturing and Services sectors, has really helped Gold price to pick up demand, as the Asian giant is a huge yellow-metal market. Gold traders now await more Federal Reserve clues, which could come from Fed officials’ speeches and Friday’s ISM Services PMI.

In the meantime, investors keep watching the US 10-year Treasury bond yield market, which rallied past the round 4% resistance on Wednesday and remains above this crucial level. The usual inverse correlation of Gold price with the US Treasury yields could provide downward pressures on XAU/USD if yields stay high, but a retracement in that bond market could propel the bright metal on a notable surge.

United States Services PMIs on the way, watch for inflation clues

The Institute of Supply Management (ISM) will publish the Services PMI on Friday at 15 GMT. If this report reaffirms that rising wage costs are feeding into accelerating price pressures in the sector, the US Dollar is likely to hold its ground against Gold. Hence, the Prices Paid Index component will be watched closely by market participants.

It’s worth noting, however, that the CME Group FedWatch Tool shows that markets are fully pricing in at least two more 25 basis points Federal Reserve rate hikes in March and May. Additionally, the probability of the Fed holding the policy rate unchanged in June stands at 25%.

The market turnaround has confirmed that the US Dollar does not have a lot of room on the upside, at least until the February jobs report and inflation data confirm or refute one more 25-bps hike in June.

Gold price targets key resistance

Dhwani Mehta, Senior Analyst at FXStreet, points at a key moving average as the main resistance to beat by Gold price bulls:

At that level, the bearish 21-Daily Moving Average (DMA) coincides, making it a powerful resistance. Gold bulls yearn for a daily candlestick closing above the latter to add extra legs to the ongoing recovery in the bright metal.

Fresh buying opportunities will be created above the 21 DMA hurdle, fuelling a rally toward the mildly bullish 50 DMA at $1,858.

Gold price in 2023: Up-and-down action

Financial markets have been a two-tale story for the early part of 2023, in which Gold price has reflected in its price action like no other asset. XAU/USD rode an uptrend during all of January with the market optimism about inflation slowing down and constant Federal Reserve dovish talk, only to see a drastic turnaround back to the old dynamics in February after a hot US Nonfarm Payrolls (NFP) report. The US economy adding more than 500K jobs in the month of January shifted the market expectations for the Fed easing its monetary policy, and the US Dollar has come back to the market King throne.

Gold price opened the year at $1,823.76 and reached a year-to-date high of $1,960 on February 2, right in between the first Federal Reserve meeting of the year and the surprising release of the US jobs report for January. Gold price went on a big downtrend from there, reaching year-to-date lows just above $1,800, where it found support.

Gold price daily forecast chart

Gold price daily chart

USD/JPY moves away from YTD peak, eyes 136.00 mark amid notable USD supply

USD/JPY moves away from YTD peak, eyes 136.00 mark amid notable USD supply

The USD/JPY pair comes under some selling pressure on Friday and reverses the previous day’s positive move to its highest level since December 20 – just above the 137.00 mark. The intraday downfall picks up pace during the early European session and drags spot prices to a fresh daily low, around the 136.25-136.20 area in the last hour.

Retreating US Treasury bond yields trigger a modest US Dollar pullback and turn out to be a key factor dragging the USD/JPY pair lower. Apart from this, a softer risk tone benefits the safe-haven Japanese Yen (JPY) and contributes to the offered tone surrounding the major. Any meaningful corrective pullback, however, still seems elusive amid hawkish Fed expectations, which should act as a tailwind for the US bond yields and the Greenback.

In fact, the markets seem convinced that the US central bank will keep interest rates higher for longer to tame stubbornly high inflation. Moreover, a slew of FOMC members this week opened the door for a jumbo 50 bps lift-off at the March policy meeting. This lifted the yield on the benchmark 10-year US government bond to its highest level since last November and the rate-sensitive two-year Treasury note to levels last seen in July 2007 on Thursday.

In contrast, the Bank of Japan (BoJ) will stick to its dovish stance for the foreseeable future. In fact, the incoming BoJ Governor Kazuo Ueda stressed the need to maintain the ultra-loose policy to support the fragile economy and said earlier this week that the central bank isn’t seeking a quick move away from a decade of massive easing. Hence, the market focus will remain glued to the upcoming BoJ monetary policy meeting, scheduled next Friday.

In the meantime, the divergent Fed-BoJ outlook should lend support to the USD/JPY pair and limit any meaningful downside, at least for the time being. Market participants now look forward to the release of the US ISM Services PMI, which, along with a scheduled speech by Dallas Fed President Lorie Logan, might influence the USD. Apart from this, the broader risk sentiment could assist traders to grab short-term opportunities on the last day of the week.

Technical levels to watch

USD/JPY

Overview
Today last price 136.31
Today Daily Change -0.37
Today Daily Change % -0.27
Today daily open 136.68
Trends
Daily SMA20 133.86
Daily SMA50 132.03
Daily SMA100 136.76
Daily SMA200 137.27
Levels
Previous Daily High 137.1
Previous Daily Low 136.02
Previous Weekly High 136.52
Previous Weekly Low 133.92
Previous Monthly High 136.92
Previous Monthly Low 128.08
Daily Fibonacci 38.2% 136.69
Daily Fibonacci 61.8% 136.43
Daily Pivot Point S1 136.1
Daily Pivot Point S2 135.52
Daily Pivot Point S3 135.02
Daily Pivot Point R1 137.18
Daily Pivot Point R2 137.68
Daily Pivot Point R3 138.25


GBP/USD: A deeper pullback is seen below 1.1900 – UOB

GBP/USD: A deeper pullback is seen below 1.1900 – UOB

GBP/USD could accelerate its downside once 1.1900 is cleared, suggest UOB Group’s Economist Lee Sue Ann and Markets Strategist Quek Ser Leang.

Key Quotes

24-hour view: “We did not expect GBP to drop sharply to 1.1924 yesterday (we were expecting GBP to trade sideways). Downward momentum has improved, albeit not much. GBP could weaken further but a sustained decline below the major support at 1.1900 is unlikely. Resistance is at 1.1975, a breach of 1.2005 would indicate that GBP is not weakening further.”

Next 1-3 weeks: “Our latest narrative was from Tuesday (28 Feb, spot at 1.2065) where we held the view that GBP is likely to consolidate and trade in a broad range of 1.1970 and 1.2150. Yesterday, GBP took out 1.1970 and dropped to a low of 1.1924. Downward momentum is beginning to build. However, GBP has to crack another major support at 1.1900 before a sustained decline is likely. The chance of GBP breaking 1.1900 will remain intact as long as the ‘strong resistance’ (currently at 1.2045) is not breached within the next few days. Looking ahead, the next level to watch below 1.1900 is at the Jan’s low near 1.1840.”