New Zealand Dollar’s Slide Approaches Limits: NZD/USD, EUR/NZD, GBP/NZD Price Setups

New Zealand Dollar’s Slide Approaches Limits: NZD/USD, EUR/NZD, GBP/NZD Price Setups

The New Zealand (NZ) dollar undoubtedly looks weak against its peers as the market digests the possibility of NZ rates peaking. However, the currency is running into some pretty tough support against some of its peers that warrants caution in turning excessively bearish.

NZD is still suffering from the Reserve Bank of New Zealand’s (RBNZ) change in stance that it sees rates peaking at current levels after it last month raised its benchmark rate by 25 basis points to 5.5%. See “New Zealand Dollar Slides as RBNZ Hikes By 25 Basis Points, But Sees Peak in Rates”, published May 24. Moreover, the recent hawkish repricing higher of Fed rate expectations and weaker-than-expected China data has weighed on the risk-sensitive currency.

NZD/USD Weekly Chart
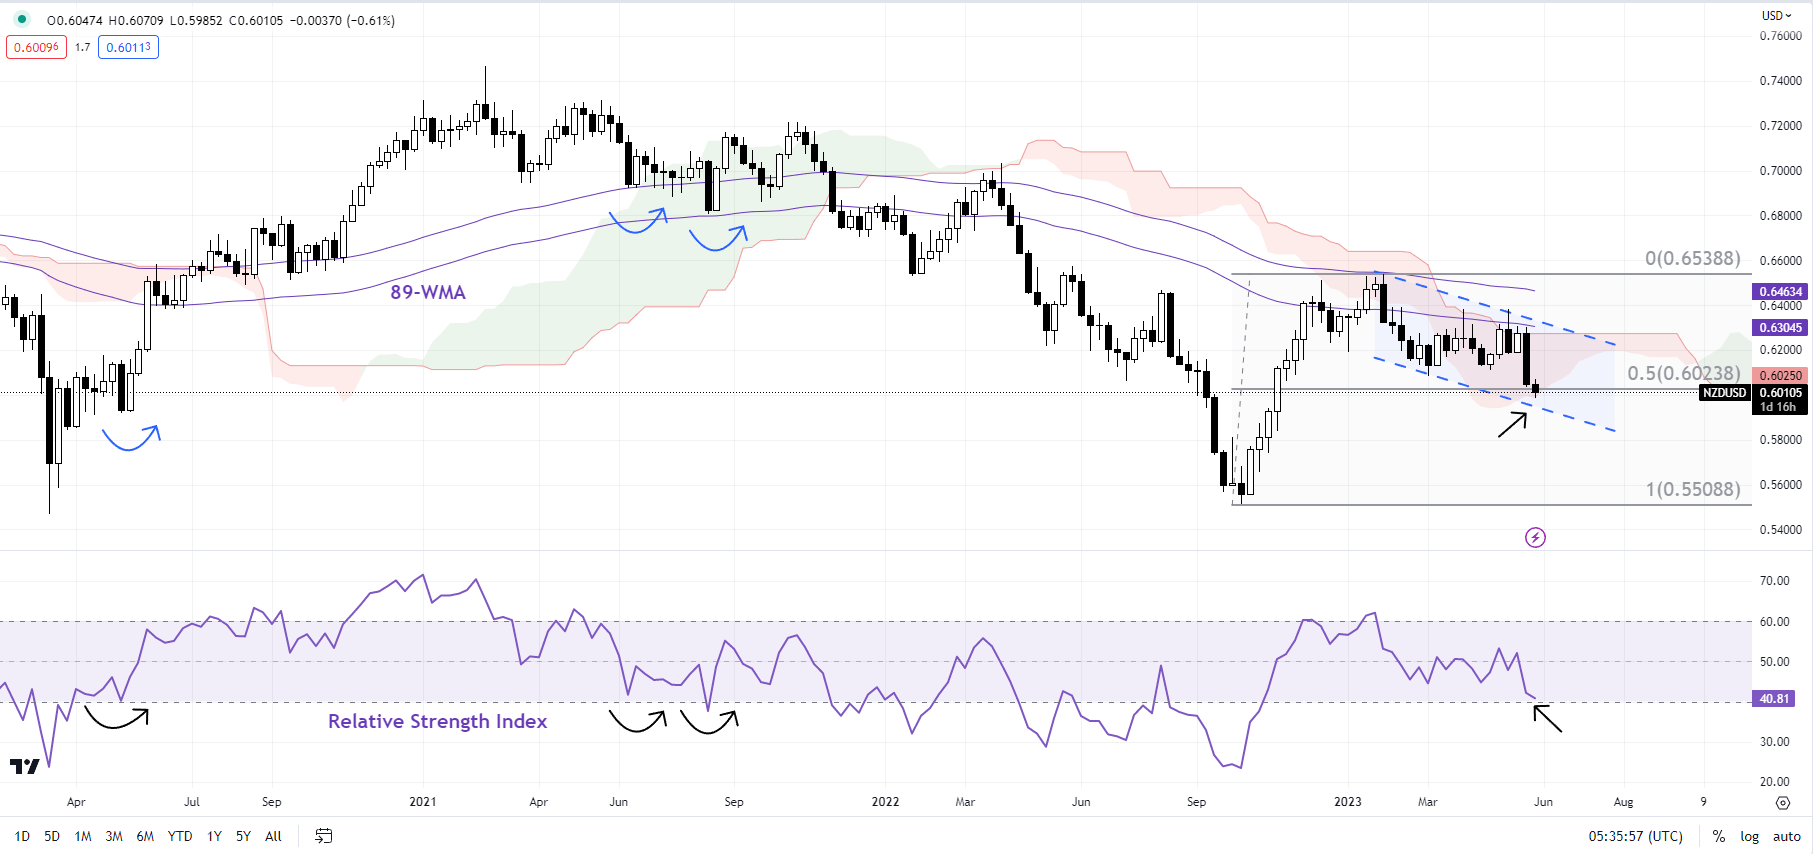
image1.png

Chart Created Using TradingView

However, Fed officials’ remarks on Wednesday hinted at a pause at the upcoming FOMC meeting, providing some comfort to USD bears. Money markets are pricing in a 60% chance of a pause at the June 13-14 meeting, up from roughly a 40% chance on Tuesday. Furthermore, the Caixin/S&P Global manufacturing PMI data showed China’s factory activity unexpectedly swung back to growth in May, contrasting with the official factory activity data that showed a faster-than-expected decline in May.

NZD/USD Daily Chart
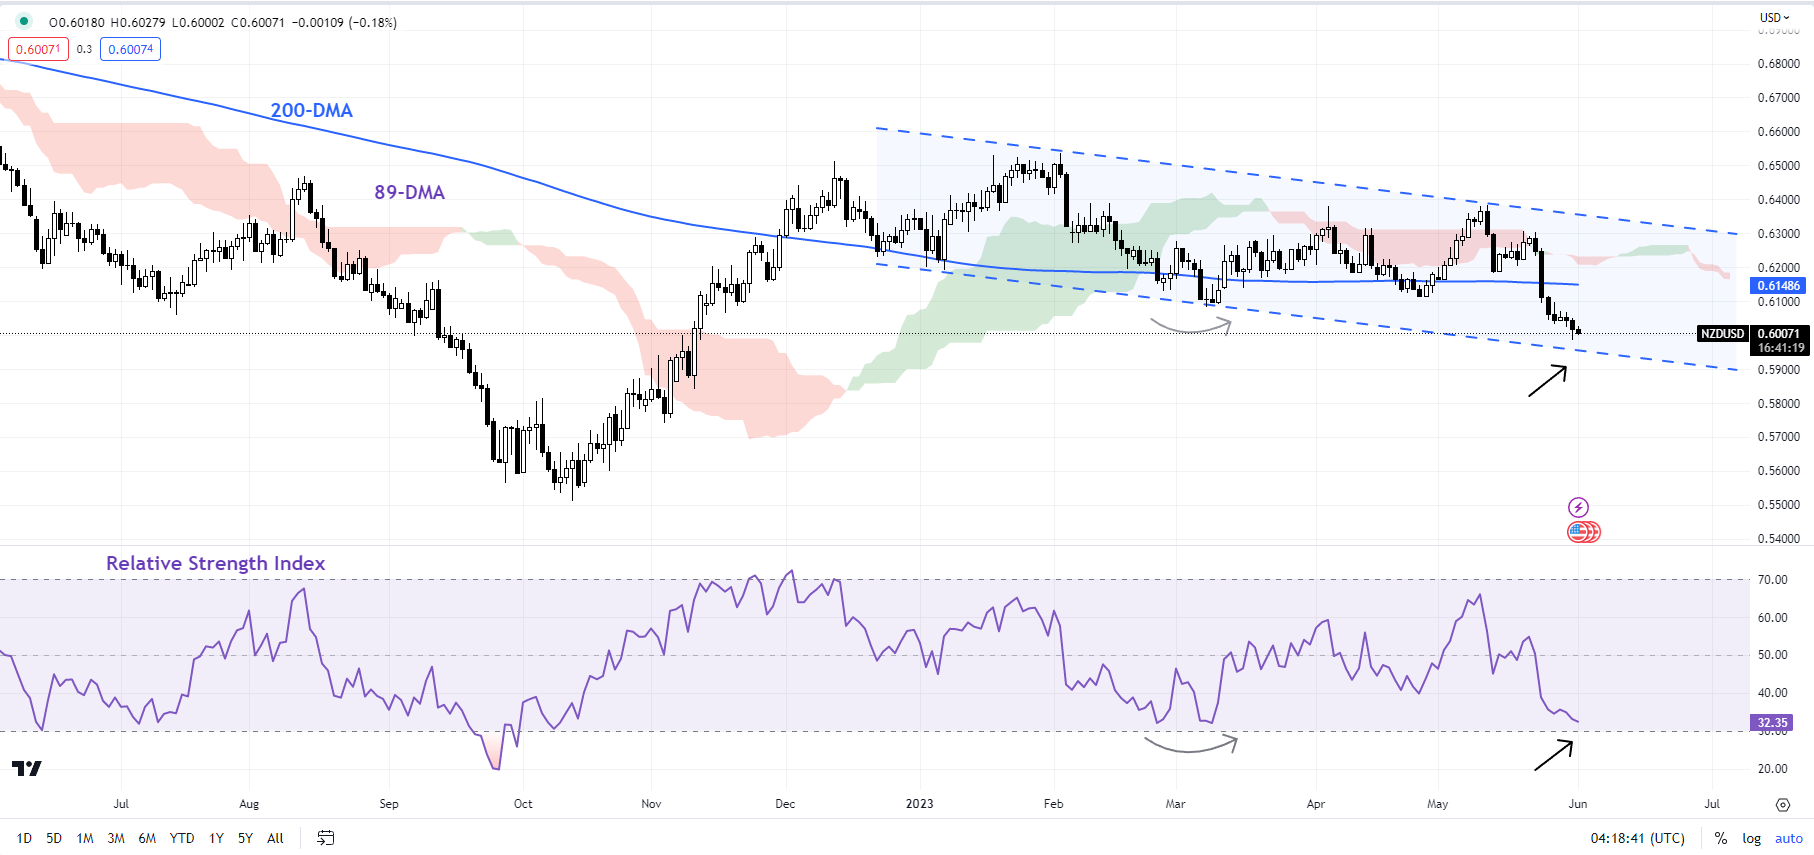
image2.png

Chart Created Using TradingView

NZD/USD: Watch channel support

NZD/USD is testing vital converged support on the lower edge of a declining channel from February and a 50% retracement of the October 2022-February 2023 rise. In general, 38%-50% retracements are considered to be reasonable, and not necessarily the end of the prior trend (uptrend in this case). Moreover, the pair late last year was able to retrace 100% of the August 2022-October 2022 slide – often a sign that bears are exhausted. Still, a break above the May high of 0.6385 is needed for the downside risks to fade.

EUR/NZD Weekly Chart
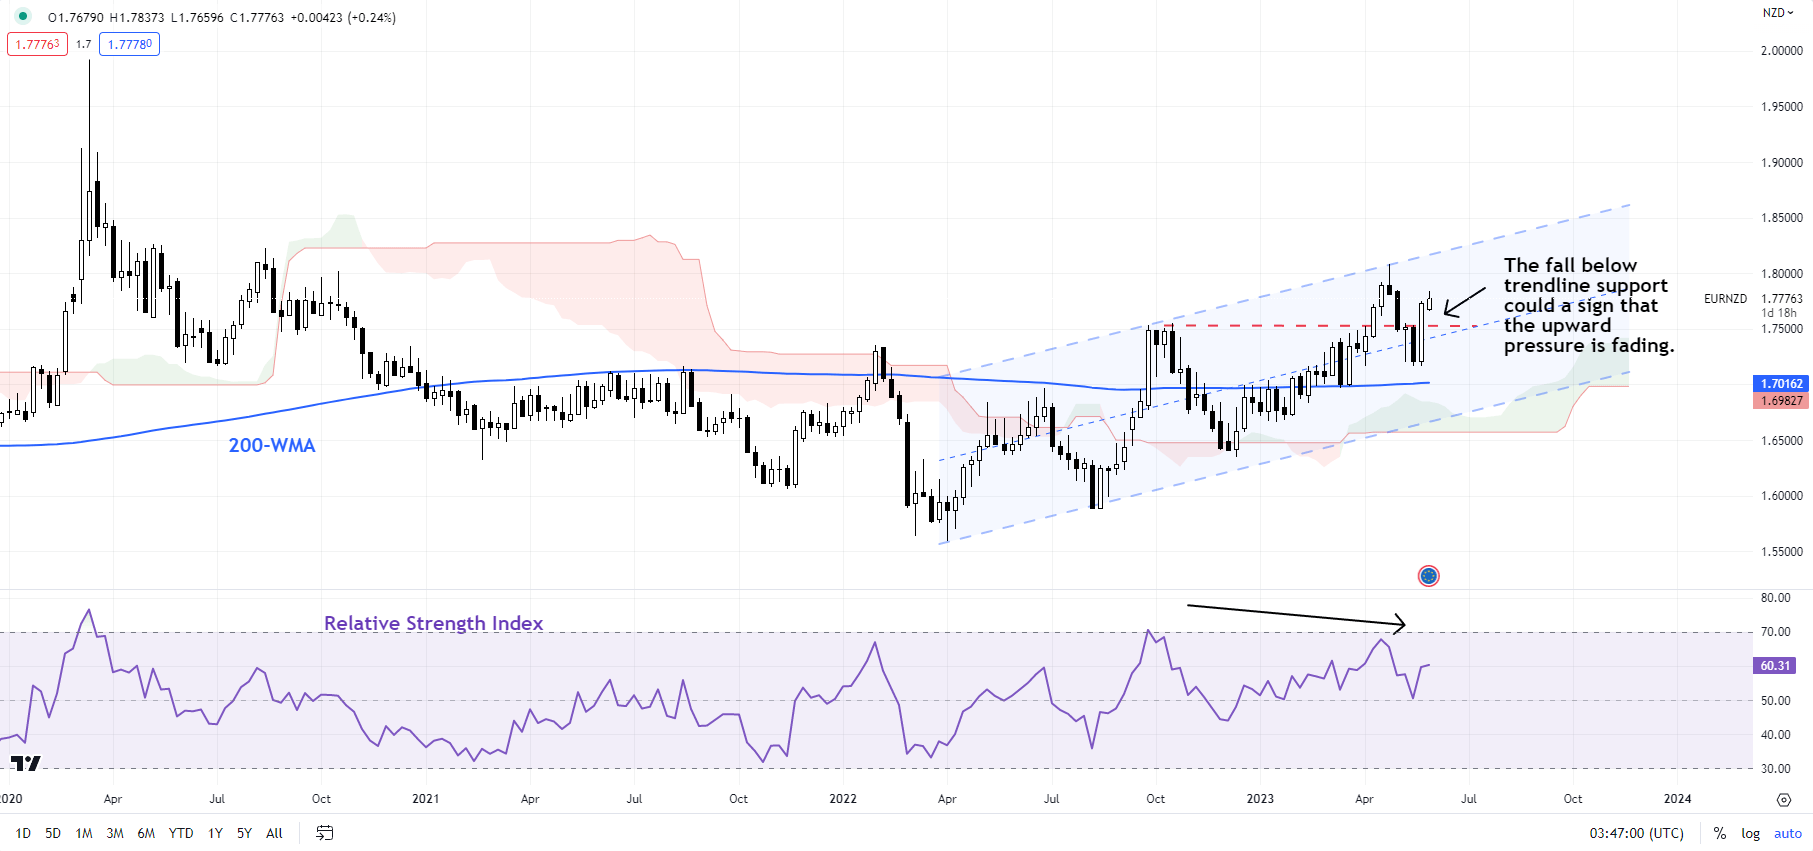
image3.png

Chart Created Using TradingView

EUR/NZD: Upward pressure appears to be waning

EUR/NZD’s drop below a crucial cushion at the October high of 1.7550 confirms that the upward pressure has waned for now. This follows a retreat from the top of a rising channel in 2015. The sharp rebound in the past two weeks has been associated with feeble momentum, raising the odds of a dead-cat bounce, rather than a fresh leg higher. EUR/NZD faces an initial cap at the early-May high of 1.7835, and unless this resistance is broken, the chances of a 1.7150-1.7850 range developing in the interim are high.

GBP/NZD Monthly Chart
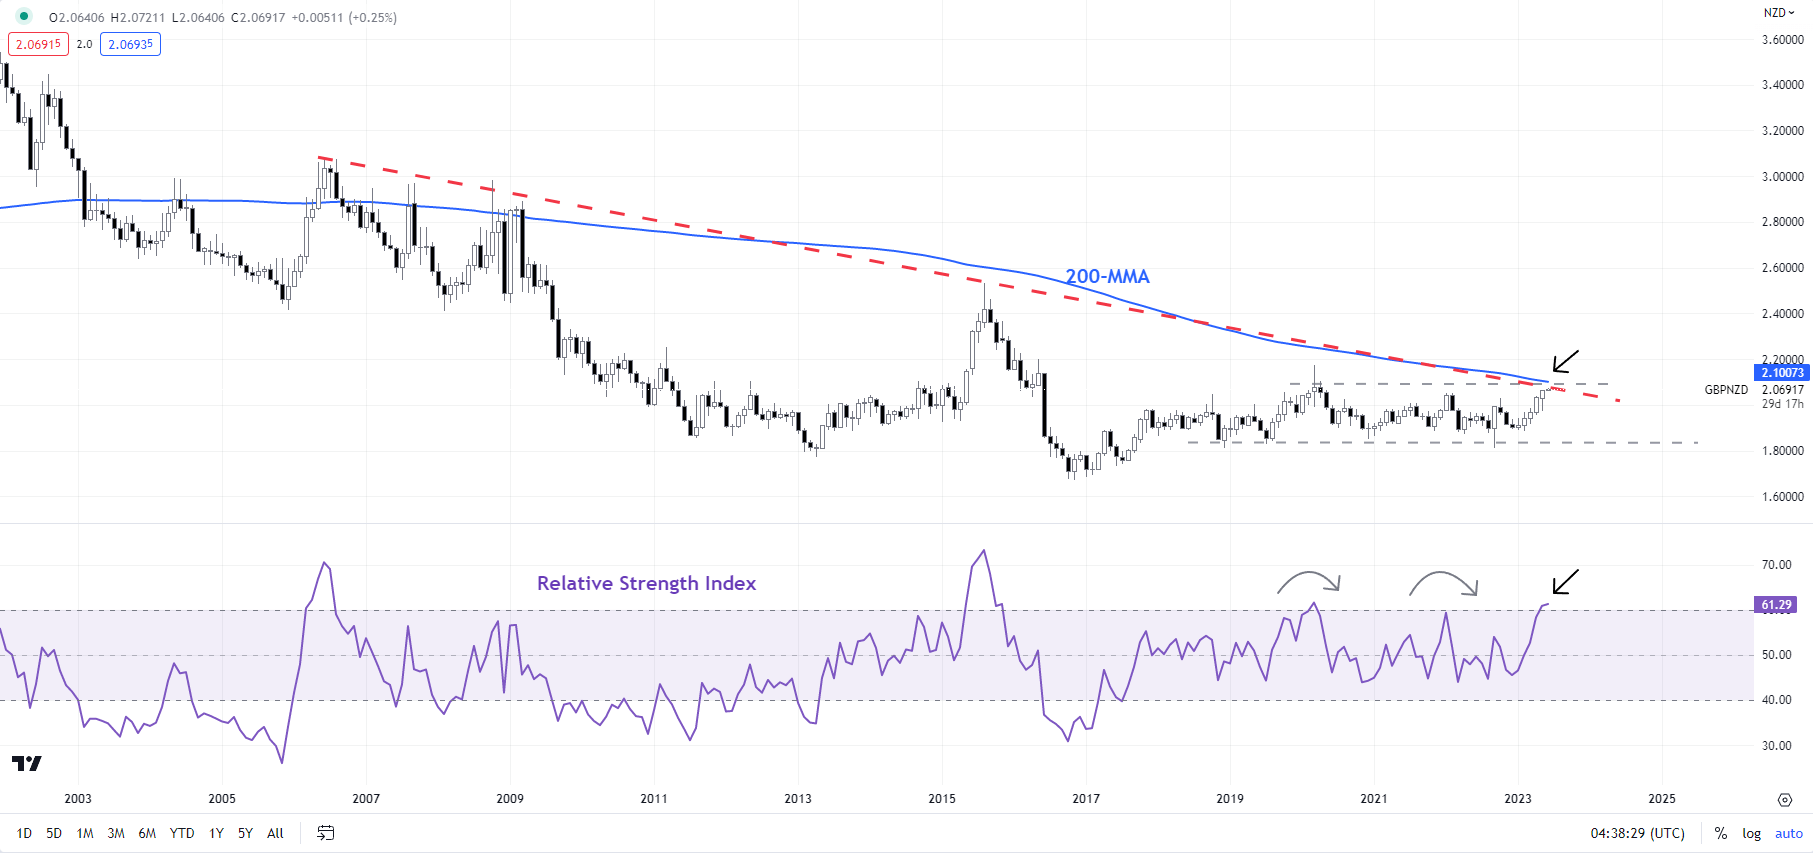
image4.png

Chart Created Using TradingView

GBP/NZD: Runs into a roadblock

GBP/NZD has had a spectacular run in recent weeks. However, the cross is looking overbought as it tests a major hurdle on the 200-month moving average and a downtrend line from 2006. The 14-month Relative Strength Index is now around 60 – levels that have been associated with a retreat in the cross in the past (see chart). Still, GBP/NZD needs to fall under immediate support at the April high of 2.04 for the upward pressure to ease.

Dow Jones and CAC40 Stabilise While Nasdaq 100 Edges Down​​​​

Dow Jones and CAC40 Stabilise While Nasdaq 100 Edges Down​​​​

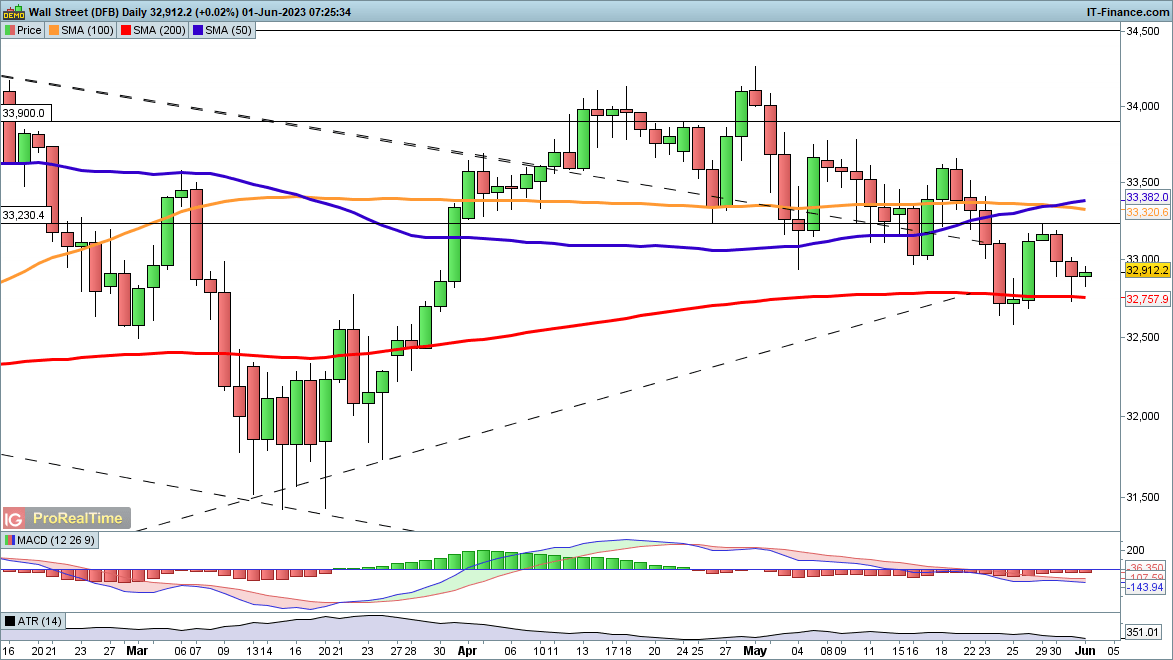
Dow holds above 200-day MA

​The index saw a rally off the lows of yesterday’s session, defending the 200-day SMA once again.

​​However, the overall lower from the highs of May has yet to be disrupted, so further upside would be needed to suggest that a low has been created. A move above 33,230 would help to bolster such a view, and might then open the way to a rebound towards the mid-May high at 33,690.

​A reversal below the 200-day SMA opens the way to the low seen last week around 32580.

Dow Jones Daily Price Chart – June 1, 2023

​A drop yesterday saw the index add to its decline from the one-year high hit on Tuesday.

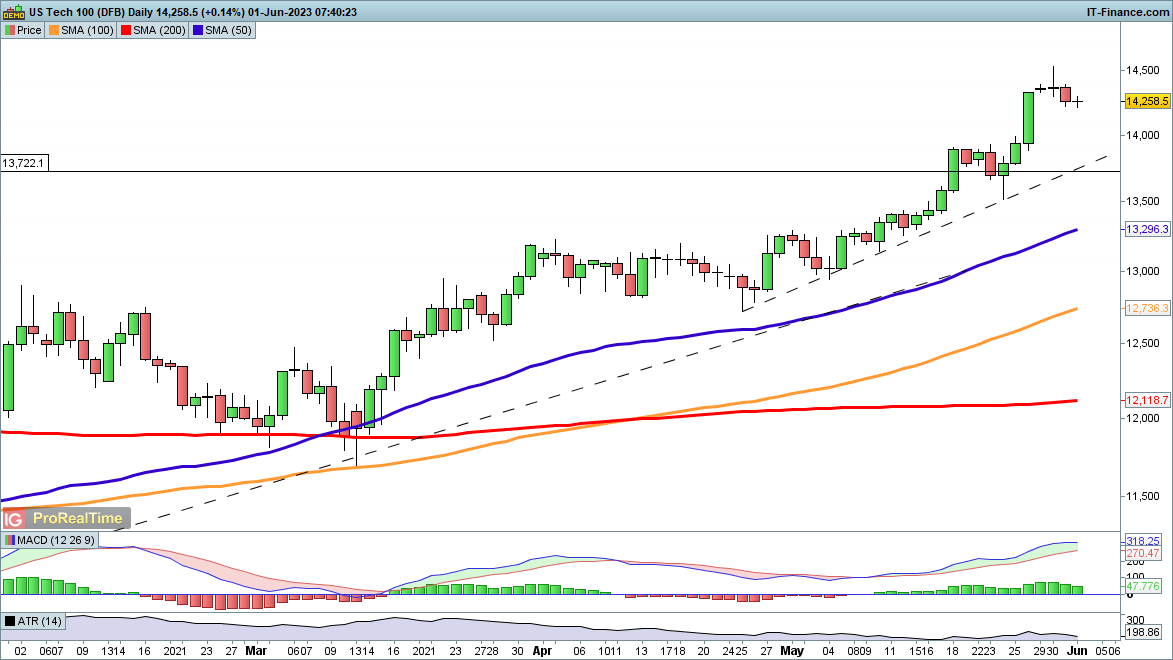
​​The upward move is still firmly intact, but it may be overextended in the short term. Trendline support from late April could come into play closer to 14,000. A deeper retracement might develop with a move below 13,700.

​​A renewed move higher could target the late March 2022 highs at 15,210, but a consolidation after the recent run higher remains a distinct possibility.

Nasdaq 100 Daily Price Chart – June 1, 2023

​CAC40 hits trendline support

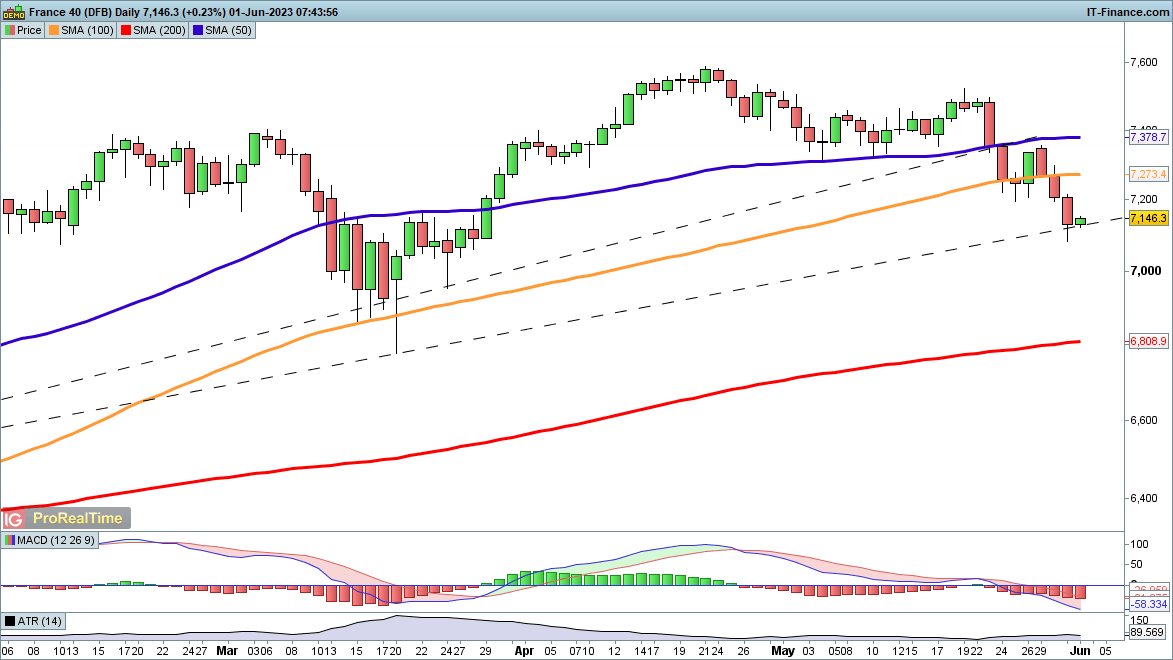
​Losses here accelerated to a fresh two-month low yesterday, although it has rallied off the lows of the session.

​The longer-term uptrend is still intact, though it has taken a knock since the April peak. A recovery above the 100-day SMA would help to reinforce the view that a higher low is in place and that a move back to 7600 and potentially higher could be in play.

​The price has stabilised around another potential trendline support level from the December lows. Should this hold then the bullish view could receive additional support. Below this, the March low at 6785 comes into view.

CAC40 Daily Price Chart – June 1, 2023

DailyFX provides forex news and technical analysis on the trends that influence the global currency markets.

AUD/USD Price Forecast: Critical Juncture for Aussie Dollar

AUD/USD Price Forecast: Critical Juncture for Aussie Dollar

AUSTRALIAN DOLLAR FUNDAMENTAL BACKDROP

The Australian dollar had a rollercoaster yesterday fluctuating around the 0.6500 handle after the US debt ceiling legislation was passed through the House. Both Republicans and Democrats joined forces to push the deal with a 314-117 split. The deal now heads over to the Senate where support is almost guaranteed. This optimism favored risk sentiment; however, Fed officials forced the hawkish narrative once more leaving the USD bid.

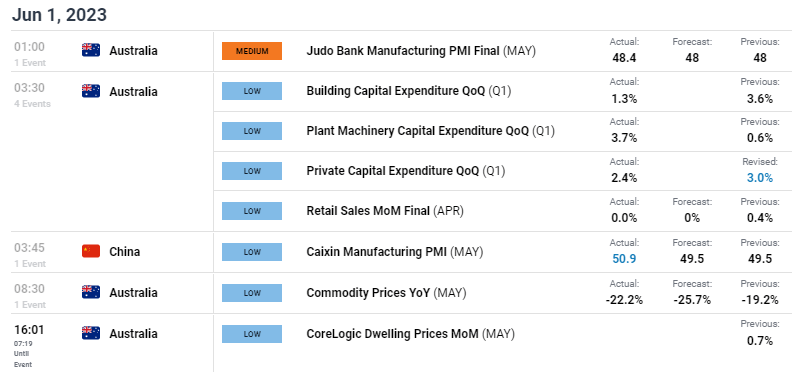
Thursday morning had some favorable data in store for the Aussie dollar with manufacturing PMI for both Australia and China (key importer of Australian commodities) beat estimates (see economic calendar below). Although NBS manufacturing PMI missed yesterday, the Caixin report is said to provide a more reliable private sector measure which markets have since backed. Commodity prices YoY have also shown less decline than forecasted, yet another positive for AUD.

AUD ECONOMIC CALENDAR (GMT +02:00)

image1.png


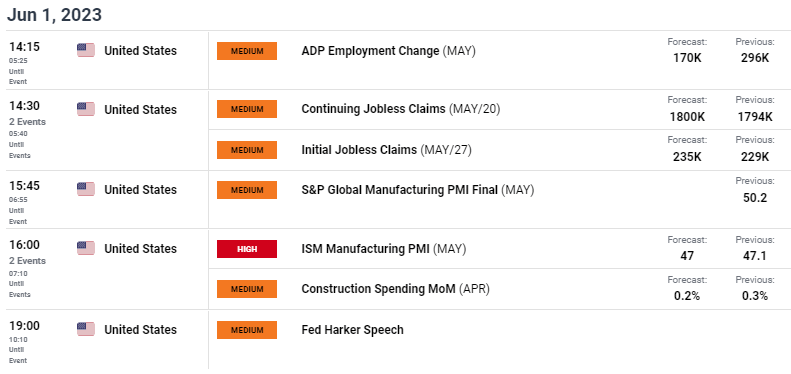
From a USD perspective, the economic calendar contains vital jobs data as well as ISM manufacturing PMI. Both are considered leading indicators and could provide valuable insight ahead of tomorrow’s Non-Farm Payroll (NFP) report. Poorer labor statistics coupled with a declining manufacturing sector could hint at a lower NFP figure for tomorrow although recent history shows the ADP print being far from a reliable NFP gauge.

US ECONOMIC CALENDAR (GMT +02:00)

image2.png


Euro Area Inflation Slows Hitting February 2022 Lows, EUR/USD Bid

Euro Area Inflation Slows Hitting February 2022 Lows, EUR/USD Bid

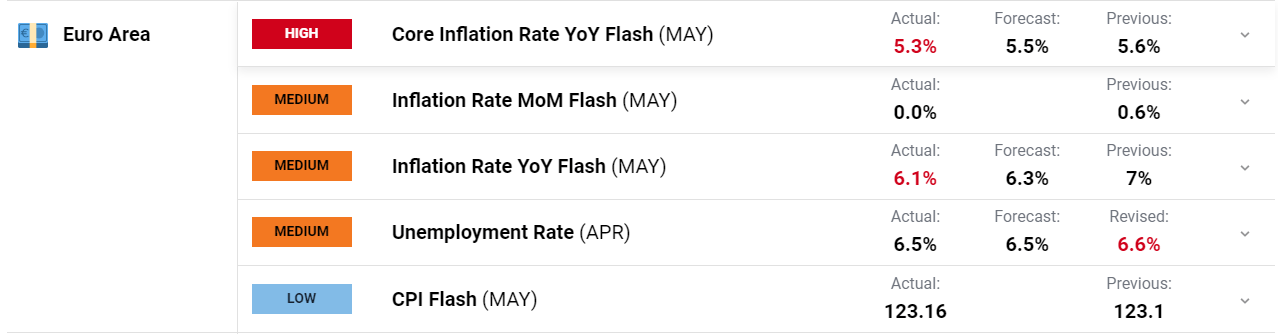
The core inflation rate in the Euro Area is estimated to have retreated to 5.3% in May down from last month’s print of 5.6%. The core CPI which excludes prices of energy, food, alcohol and tobacco went down 0.3%, recording its lowest reading since January in what will most definitely be seen as a positive by the ECB.

A screenshot of a phone  Description automatically generated with low confidence

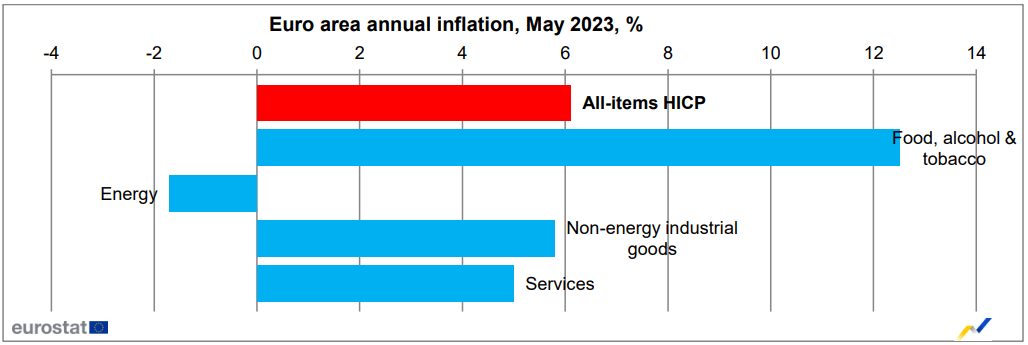
The YoY inflation rate is expected to be 6.1% in May 2023, down from 7.0% in April according to a flash estimate from Eurostat, the statistical office of the European Union. This is the lowest print since February 2022 and the decline in food prices will be particularly satisfying to the ECB and Euro Area consumers. The breakdown of components revealed that the decrease was largely driven by by a 1.7% decline in energy prices, following a 2.4% increase in April. Additionally, there was a slowdown in cost pressures for food, alcohol, and tobacco (12.5% vs 13.5%), non-energy industrial goods (5.8% vs 6.2%), and services (5.0% vs 5.2%). Furthermore, the core inflation rate, which excludes energy, food, alcohol, and tobacco, also eased more than anticipated, reaching 5.3 percent.

image2.png

The labor market meanwhile remains robust with unemployment coming in at 6.5% in line with forecasts. The number of unemployed declined by 33 thousand from a month earlier to 11.088 million, the lowest level since comparable records began in 1995.

IMPLICATION FOR THE ECB MOVING FORWARD

The ECB’s job remains a tough one given the economic backdrop of the various countries in the Euro area. European Central Bank (ECB) policymakers have adopted a largely hawkish rhetoric of late with policymaker Luis de Guindos reiterating that recent inflation data is a positive but remains a long way from the Central Banks target.

The inflation referred to by de Guindos is not todays print but rather the inflation data out of France and Germany yesterday. Italian inflation ticked higher but the French and German prints indicated significant declines with French PPI MoM coming in at -5.1%. We may finally be seeing the effects of rate hikes as the “lag effect” appears to have run its course.

The data is still unlikely to sway the ECB just yet on the rate hike front as we enter a key summer period. Services inflation has remained sticky in the Euro Area and with tourism expected to peak in the summer months this could pose a upside risk to inflation and may be worth monitoring. A positive though remains the steep declines in energy prices which is expected to continue as the warm weather kicks into full gear around Europe. All in all, a mixed bag moving forward for the ECB proving just how hard forecasting has become in the current macro environment globally.

MARKET REACTION

EURUSD Daily Chart

A screenshot of a computer  Description automatically generated with medium confidence

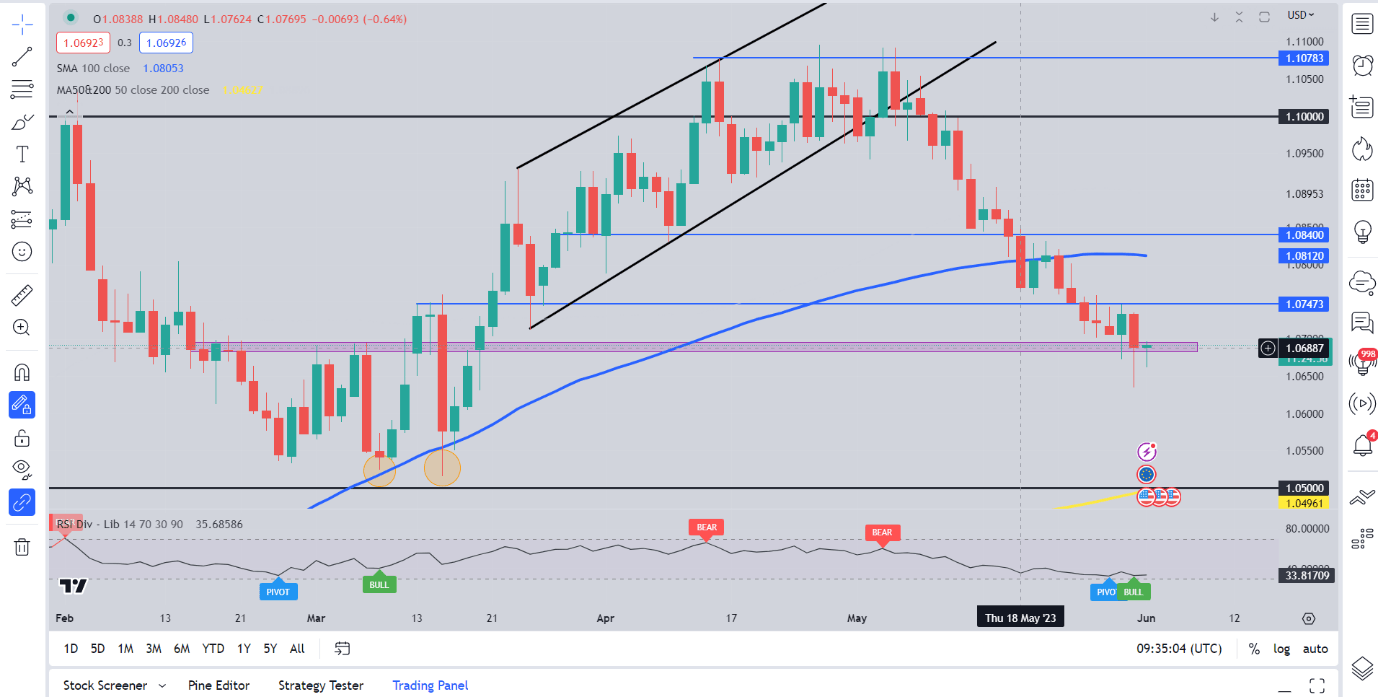
EURUSD initial reaction saw a 20-pip spike higher toward the 1.0700 handle. The longer-term picture for EURUSD remains abit unclear at present as we hover around a key support area just below the 1.0700 handle. Tuesdays hammer candle close off the support area hinted at a bullish recovery for EURUSD which failed to materialize. There are still signs that a bounce could be in store for EURUSD as we have yet to see daily candle close below the support area (pink block on the chart). The RSI is also back in oversold territory which will no doubt keep bears cautious around current price levels.

Key Levels to Keep an Eye on:

Resistance Levels:

  • 1.0700
  • 1.0750
  • 1.0810 (100-day MA)

Support Levels:

  • 1.0635
  • 1.0575
  • 1.0500 (psychological level)