US Dollar Holds the High Ground While Crude Oil Whips Around. Higher USD?

US Dollar Holds the High Ground While Crude Oil Whips Around. Higher USD?

The US Dollar added modest gains to Friday’s rally on Monday as markets digest the OPEC+ production cut agenda that was announced over the weekend.

USD had been assisted by a mixed jobs report on Friday that was overall seen as more positive than negative. Currency markets have had a quiet start to the week so far.

339k jobs were added in May according to the non-farm payrolls data. This beat the 195k anticipated and there was also an upward revision to the April figure to 295k from 253k.

However, the unemployment rate ticked up to 3.7% from 3.4% previously and above the 3.5% anticipated.

APAC equity indices have generally had a positive day after Wall Street notched up decent gains in their cash session to end last week after the resolution of the debt ceiling deal lifted the mood. Futures are pointing toward a subdued start to Monday.

The mood was buoyed by China’s Caixin services PMI May reading of 57.1 instead of the 55.2 expected and 56.4 prior.

The OPEC+ announcement of a reduction in oil production output among the cartel saw Saudi Arabia bearing the brunt of cutbacks. They will be reducing their contribution to global supply by 1 million barrels per day.

The UAE received an increase in its production target while Russia’s remains unchanged.

Crude spiked higher on the open today but has since given up a chunk of the gains although prices are still above where they closed the Friday session.

The WTI futures contract is near US$ 72.50 bbl while the Brent contract is a touch below US$ 77 bbl. Live prices can be viewed here.

Treasury yields have remained elevated to start the week with the 1-year bond remaining near the 23-year high above 5.30%.

June 14th is the next Federal Open Market Committee (FOMC) meeting, and the blackout period began over the weekend. This means that committee members will not be making any public comments about policy until after the gathering.

Looking ahead, after the Swiss CPI and Eurozone PPI, the US will see factory and durable goods orders data. Tomorrow the RBA will decide on monetary policy followed by the Bank of Canada on Wednesday.

Check the calendar for more events.

DXY (USD) INDEX TECHNICAL ANALYSIS

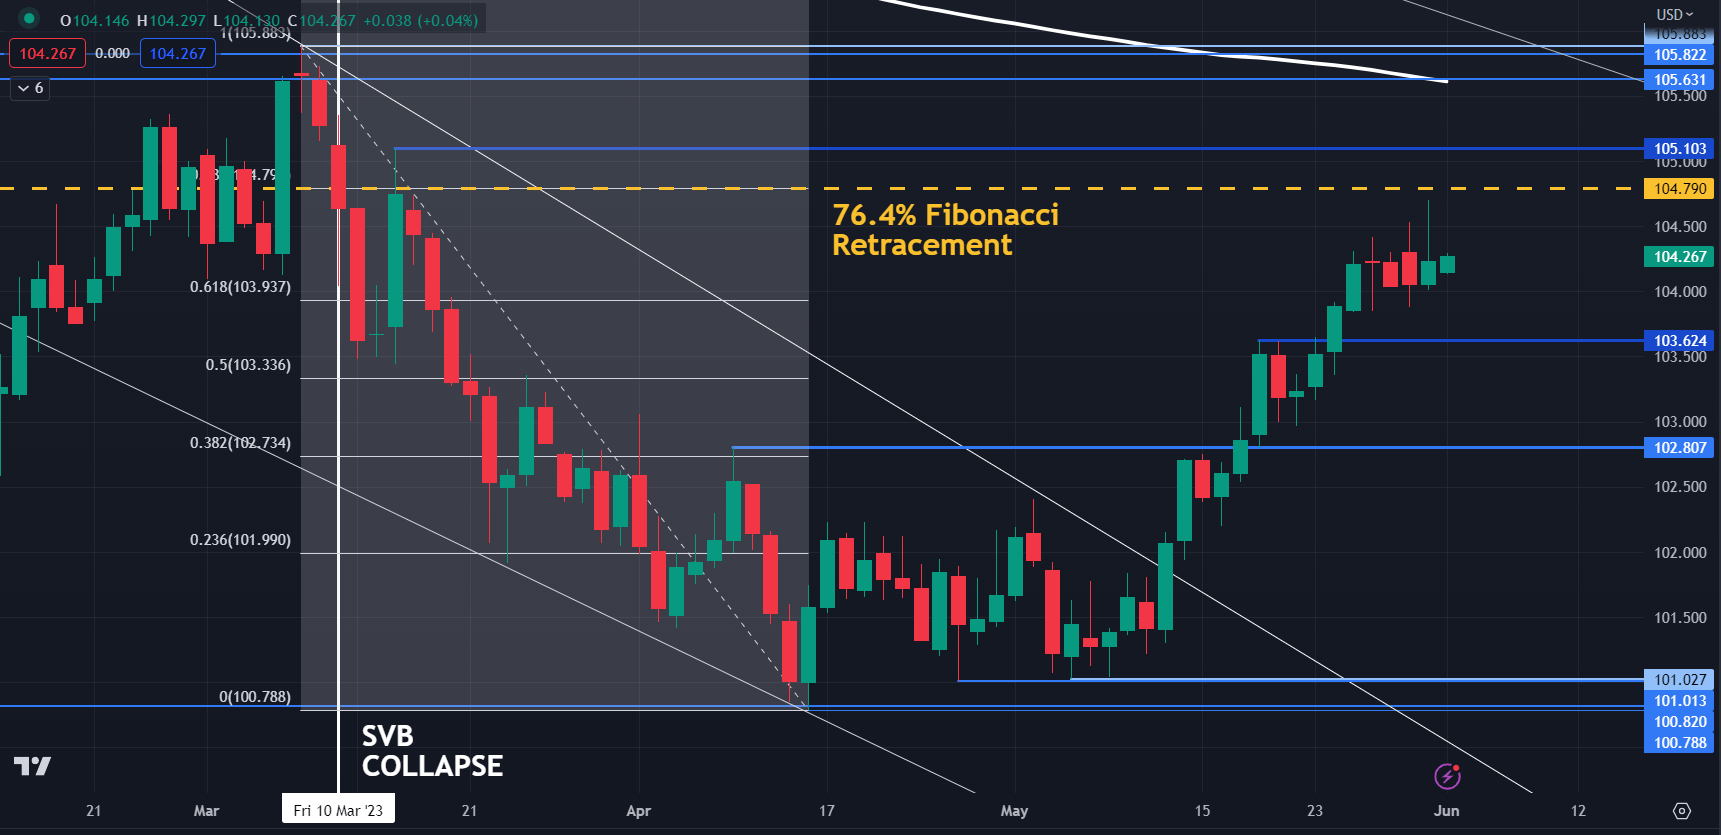
The DXY index appears to be in a short-term sideways pattern for now. Resistance might be in the 104.70 – 104.80 area where last week’s high was as well as the 76.4% Fibonacci Retracement.

On the downside, support may lie at the recent low of 103.38 or the breakpoint of 102.80.

image1.png

Chart created in TradingView

USD/CAD Price Forecast: Loonie to Exploit Death Cross Formation?

USD/CAD Price Forecast: Loonie to Exploit Death Cross Formation?

CANADIAN DOLLAR FUNDAMENTAL BACKDROP

The Canadian dollar powered through some key technical levels last week and opened up relatively strong this week although marginally weaker against the USD. The primary driver has been the OPEC+ meeting on Sunday that featured further crude oil production cuts by Saudi Arabia (1 000 000 bpd) to a total output of 9 000 000 bpd. The supply limits will follow through to 2024 as well giving the crude oil linked loonie some support from a commodities point of view.

From a US dollar perspective, a NFP headline beat was not enough to swing money market expectations in favor of another interest rate hike due to the increase in unemployment and a decline albeit marginal in the average earnings figure. The Bank of Canada (BOC) discloses its interest rate announcement on Wednesday 7th June and is anticipated to remain on hold; however, forecasts show an almost 50/50 split between a pause and hike which may stem from strong Canadian GDP last week. With no real impactful Canadian data between now and Wednesday, I tend to favor the BOC holding rates steady.

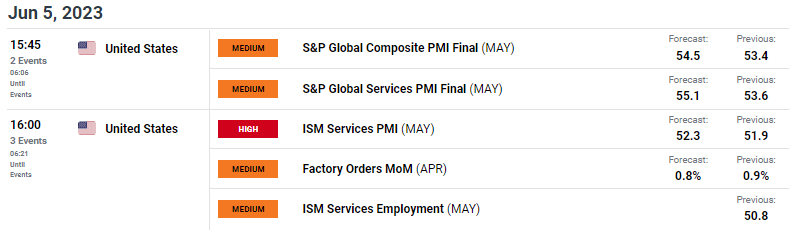
The economic calendar today (see below) includes some key information about the US economy via services PMI data with more focus on the ISM report. This data print is important due to the fact that the US is primarily a services driven economy and with forecasts pointing to the upside, the greenback may find some additional backing – possible increasing the probability of a Fed rate hike as the services sector has been a major driver of US inflation.

USD/CAD ECONOMIC CALENDAR

image1.png

TECHNICAL ANALYSIS

USD/CAD DAILY CHART

image2.png

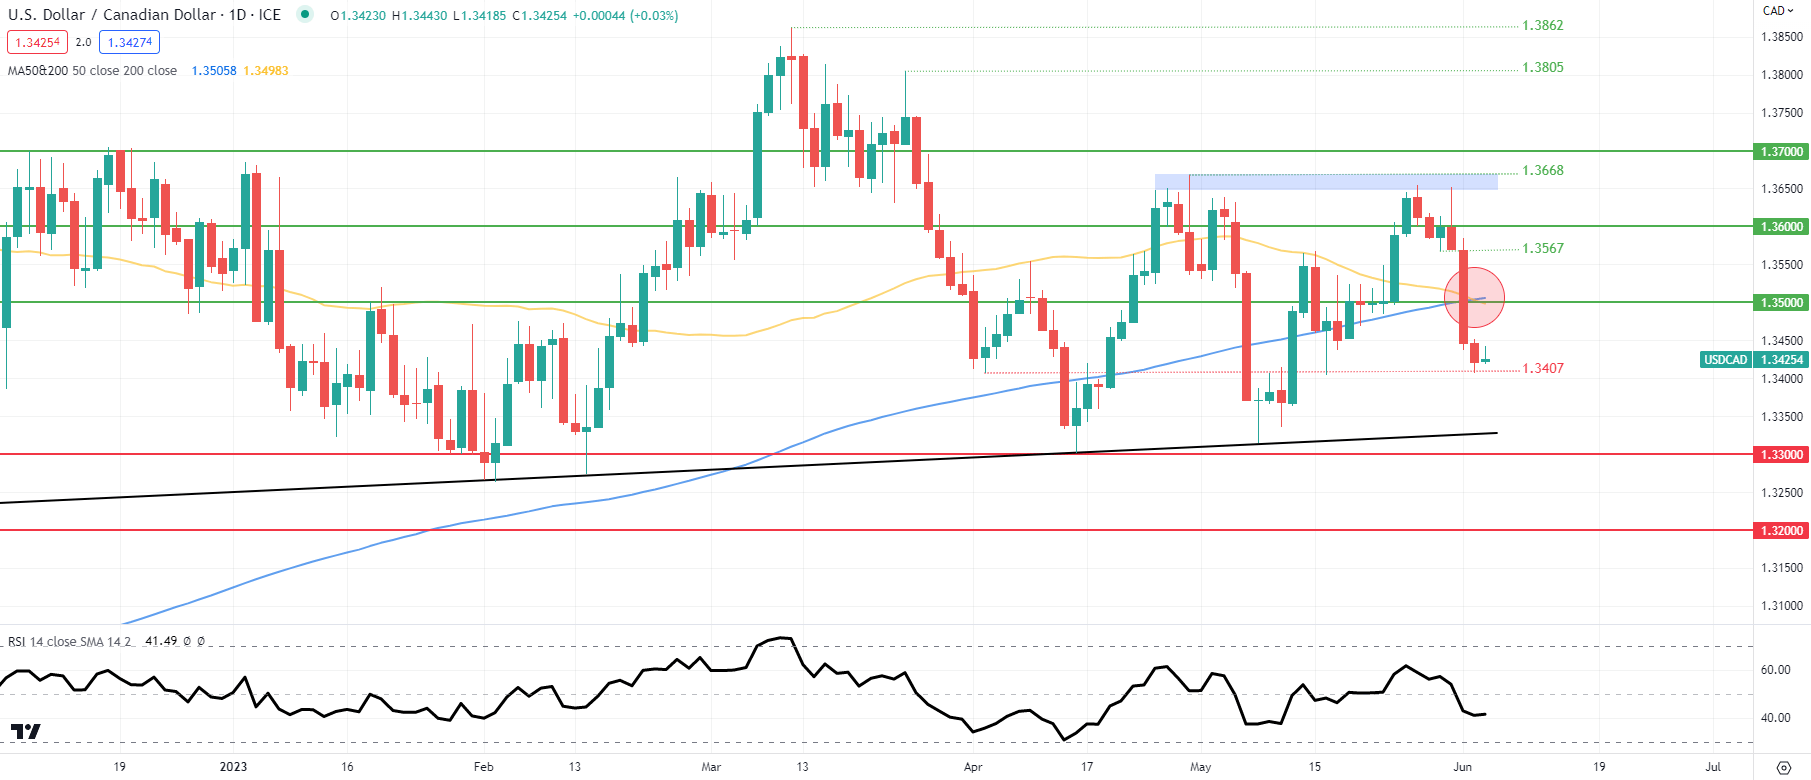
Daily USD/CAD price action may be on the cusp of extending the short-term CAD rally with the formation of the death cross (red). A candle close and break below the 1.3407 swing low could prompt a large move lower towards trendline support (black).

US Dollar (DXY) on the Backfoot Ahead of the US Jobs Report (NFP)

US Dollar (DXY) on the Backfoot Ahead of the US Jobs Report (NFP)

The US debt ceiling deal has passed through Congress and now just needs President Joe Biden’s signature to come into force, just a couple of days before the US government was expected to run out of money. Today’s agreement suspends the debt ceiling until Janaury1 2025 and should save around $1.5 trillion over the next 10 years. The multi-week debate over this debt ceiling caused US short-dated bill yields to rise sharply as investors priced in the very faint possibility of a US default. With these fears now in the rearview mirror, the pressure on these yields will be removed.

The US jobs market remains robust with companies still struggling to hire workers despite a slowing US economy. This week’s labor reports confirm Fed chair Powell’s view that the jobs market remains ‘very tight’ with the JOLTS and ADP releases this week both beating market consensus.

image1.pngimage2.png

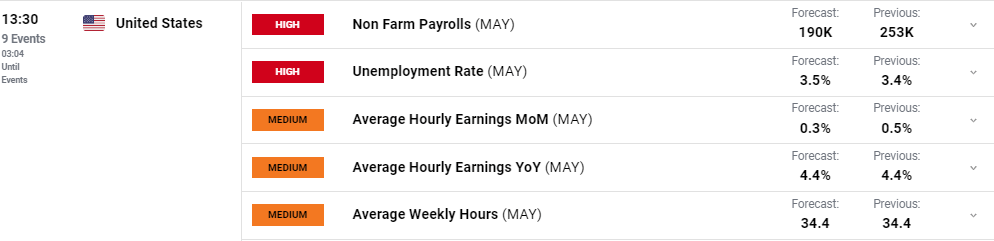
The latest US Jobs Report (NFPs) will hit the screens later today and will be closely parsed for any further evidence of labor market tightness. While the overall over the past year is lower, aside from a couple of outlier months, April’s report showed a small uptick while the unemployment rate stayed close to a multi-decade low. Today’s report is expected to show that 190k new jobs were added in May, although market consensus has been proved to be consistently low over the last year. Traders should also be aware of any market revisions to the headline number and to the average hourly earnings data.

image3.png

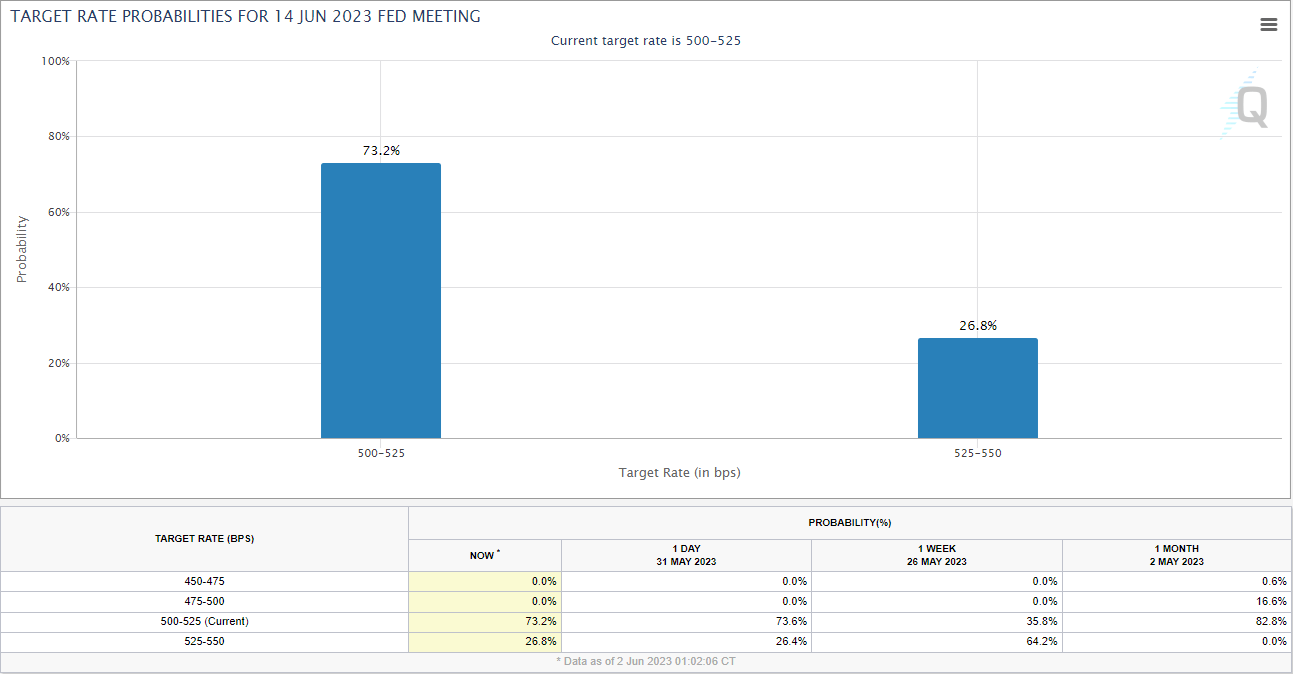
The US dollar continues to slip lower with the move gaining extra momentum from recent commentary by two Federal Reserve voting members, Harker and Jefferson, who said that the Fed could keep interest rates on hold at this month’s FOMC meeting. Prior to these comments, the market was pricing in a roughly 65% chance of a 25bp hike on June 14. This probability has now slipped to just 27% with a 73% chance that the Fed will not hike rates.

image4.png

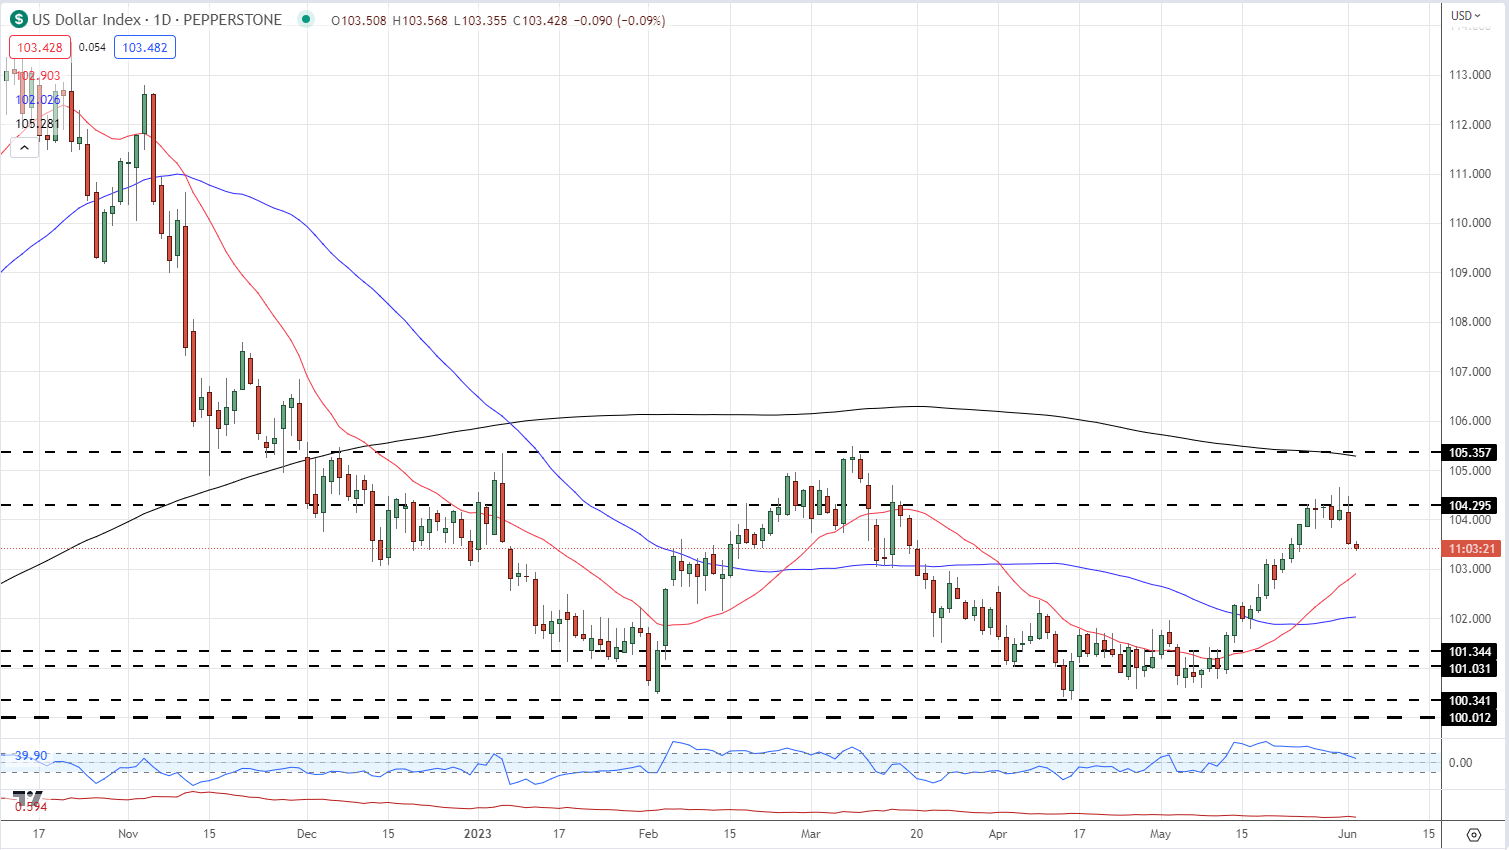
The one-month US dollar rally has seemingly come to an end with the greenback now touching lows last seen over one week ago. The technical outlook remains mixed with the 200-dma and a prior level of resistance capping any move higher, while the 20- and 50-dmas are likely to provide support. Today’s NFP report may well move the US dollar but further moves, including any potential resistance and support breaks, will be dictated by the June FOMC meeting.

US Dollar Daily Price Chart – June 2, 2023

image5.png

Chart via TradingView

EUR/USD Turns the Tide as USD/JPY Fumbles, USD/CAD Carves Out Double-Top Pattern

EUR/USD Turns the Tide as USD/JPY Fumbles, USD/CAD Carves Out Double-Top Pattern

EUR/USD TECHNICAL ANALYSIS

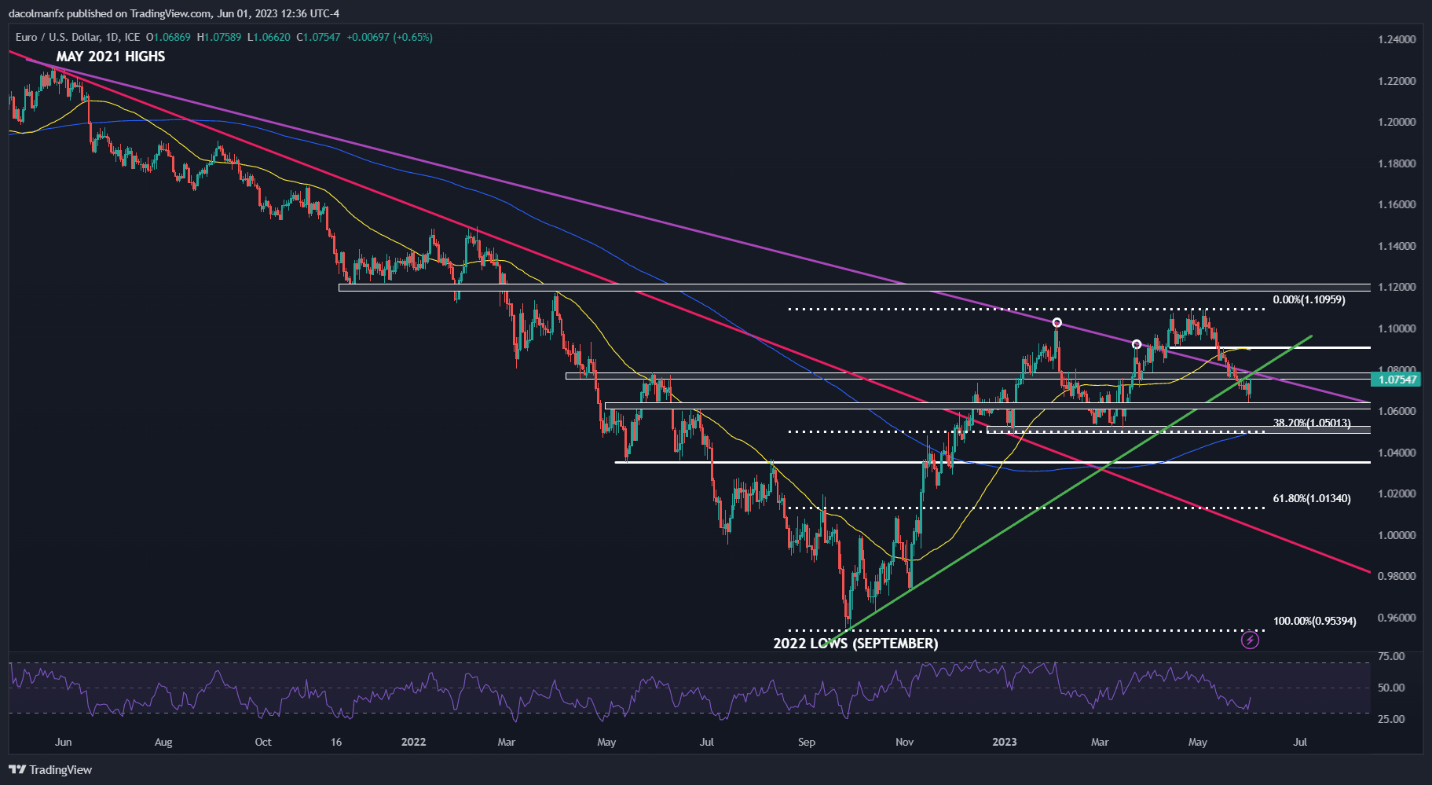
EUR/USD regained strength on Thursday and managed to bounce off horizontal support at 1.0640/1.0600 following Wednesday’s steep sell-off. While the euro’s prospects have started to deteriorate in recent days, the bullish case should not be written off just yet, as buyers appear to be returning to the market and seem intent on challenging a key ceiling located a tad below the psychological 1.0800 mark.

The next few sessions will be critical and may help determine the near-term directional bias, so traders should carefully watch how price action evolves and how it reacts around major tech zones. That said, there are two possible scenarios worth considering: 1) clearance of cluster resistance stretching from 1.0750 to 1.0785, and 2) upside exhaustion and rejection from current levels.

If the first scenario plays out and buyers drive the exchange rate above 1.0750/1.0785, sentiment could take a turn for the better, paving the way for a move toward the 50-day simple moving average, which is hovering slightly below the 1.0900 handle. In contrast, if the second scenario unfolds and sellers spark a bearish reversal, EUR/USD may soon be on its way to retesting its May lows.

EUR/USD TECHNICAL CHART

A screenshot of a graph  Description automatically generated with low confidence

USD/JPY TECHNICAL ANALYSIS

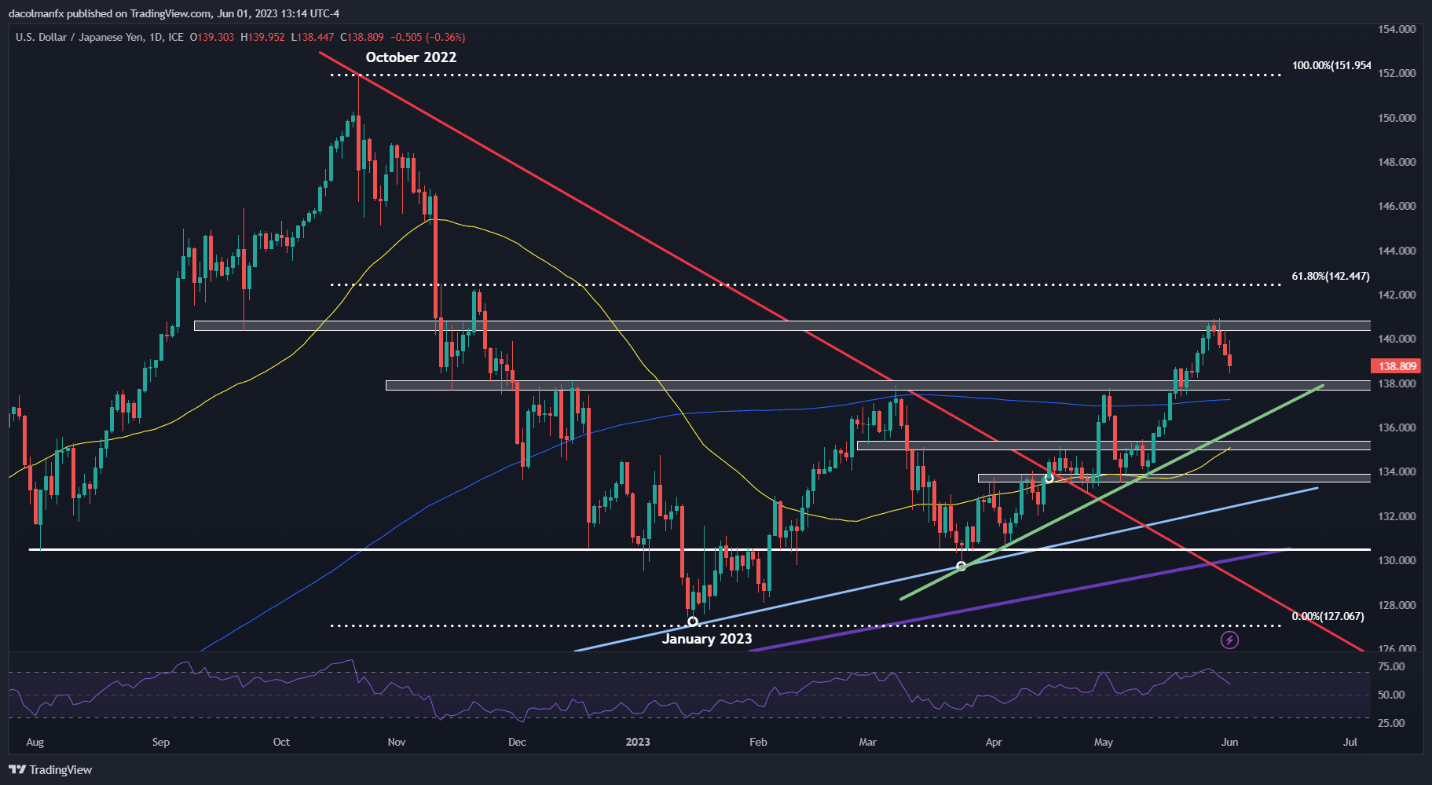
USD/JPY rallied in May on bets that the Fed would continue lifting rates at upcoming FOMC meetings, but expectations have shifted in a more dovish direction in the last couple of days after some officials came out in support of a “pause” to assess the lagged effects of past tightening. In this context, markets have largely priced out the likelihood of a 25 bp hike in June, leading to a pullback in the U.S. dollar.

In terms of technical analysis, USD/JPY began to retrench after failing to clear overhead resistance located modestly above the psychological 140.00 mark. Sellers retook control of the market from those levels, pushing prices back toward the 138.00 area – the next major support in play. If this floor gives way in the coming sessions, bears may become emboldened to launch an attack on short-term trendline support near 135.90.

On the flip side, if USD/JPY pivots higher and resumes its upward trek, the first resistance to keep an eye on lies at 140.50/140.90. Successfully piloting above this ceiling could reinforce upward momentum, opening the door for climb toward 142.45, the 61.8% Fibonacci retracement of the October 2022/January 2023 decline.

USD/JPY TECHNICAL CHART

A screen shot of a graph  Description automatically generated with low confidence

USD/CAD TECHNICAL ANALYSIS

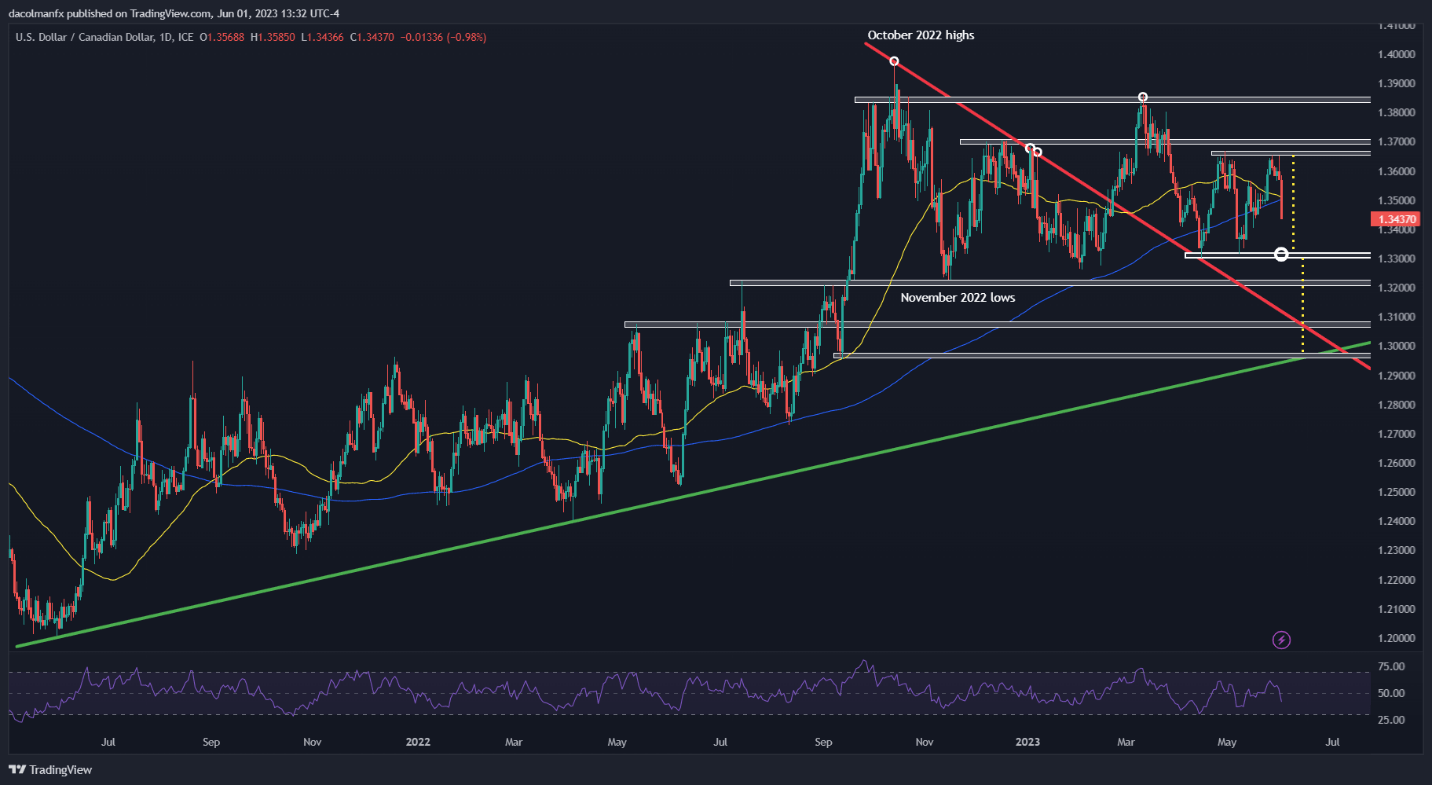
USD/CAD rallied toward its April highs earlier this week, but was quickly repelled lower from those levels, with the pair selling off and seemingly carving out the second leg of a double top pattern on Thursday – a bearish configuration according to technical analysis.

A double top is a reversal pattern that often develops in the context of an extended move higher, composed of two similar peaks separated by an intermediate trough. The setup is confirmed once the price completes its “M” shape and breaks below the neckline which serves as a base for the pattern. In the case at hand, the neckline sits slightly above the 1.3300 handle.

The likely size of the downward move can be quantified by projecting vertically the height of the double top from the break point. For USD/CAD, this could mean a potential slump toward 1.2960 over a medium-term horizon.

USD/CAD TECHNICAL CHART

A screenshot of a computer screen  Description automatically generated with low confidence


Gold Prices Set for Best Week Since Early April, Will NFP Data Take This Away?

Gold Prices Set for Best Week Since Early April, Will NFP Data Take This Away?

Gold Finds Momentum on US ISM Data Disappointment

Gold prices rallied over 0.7 percent on Thursday, bringing total gains this week so far to about 1.6. This is setting up to be the best week for the yellow metal since the beginning of April. A closer look reveals that XAU/USD has been rising while the US Dollar and Treasury yields have been weakening, underscoring the anti-fiat properties of gold.

Over the past 24 hours, US ISM Manufacturing clocked in at 46.9 for May, lower than the 47 estimate. But, what was more surprising is that prices paid crossed the wires at 44.2, significantly lower than the 52.3 forecast. A reminder that values below 50 indicate contracting activity and vice versa. Effectively, the data underscored that the cyclical component of the economy is continuing to contract.

Now, prices are seemingly following lower, which added fuel to the story that perhaps inflation may continue weakening in the near term. As a result, financial markets have been quick to price rate cuts back from the Federal Reserve, hence falling yields and a softer currency. Wall Street absolutely rejoiced with this news, with the Nasdaq 100, S&P 500 and Dow Jones rallying hard.

This is the current market environment we find ourselves in given that the central bank has signaled a pause, with the near-term path to remain heavily data-dependent (this includes both the probability of hikes and cuts). One day the central bank’s preferred inflation gauge drives up rate hike bets, today ISM data pours cold water on it.

Looking into the remaining 24 hours, the Asia-Pacific trading session is lacking notable economic event risk. Instead, gold will be highly anticipated US non-farm payrolls data which is due at 12:30 GMT. Understand that another solid print could reverse the market reaction seen on Thursday if it gets traders to think about the possibility of further Fed tightening, once again diminishing gold’s appeal.

Gold Technical Analysis

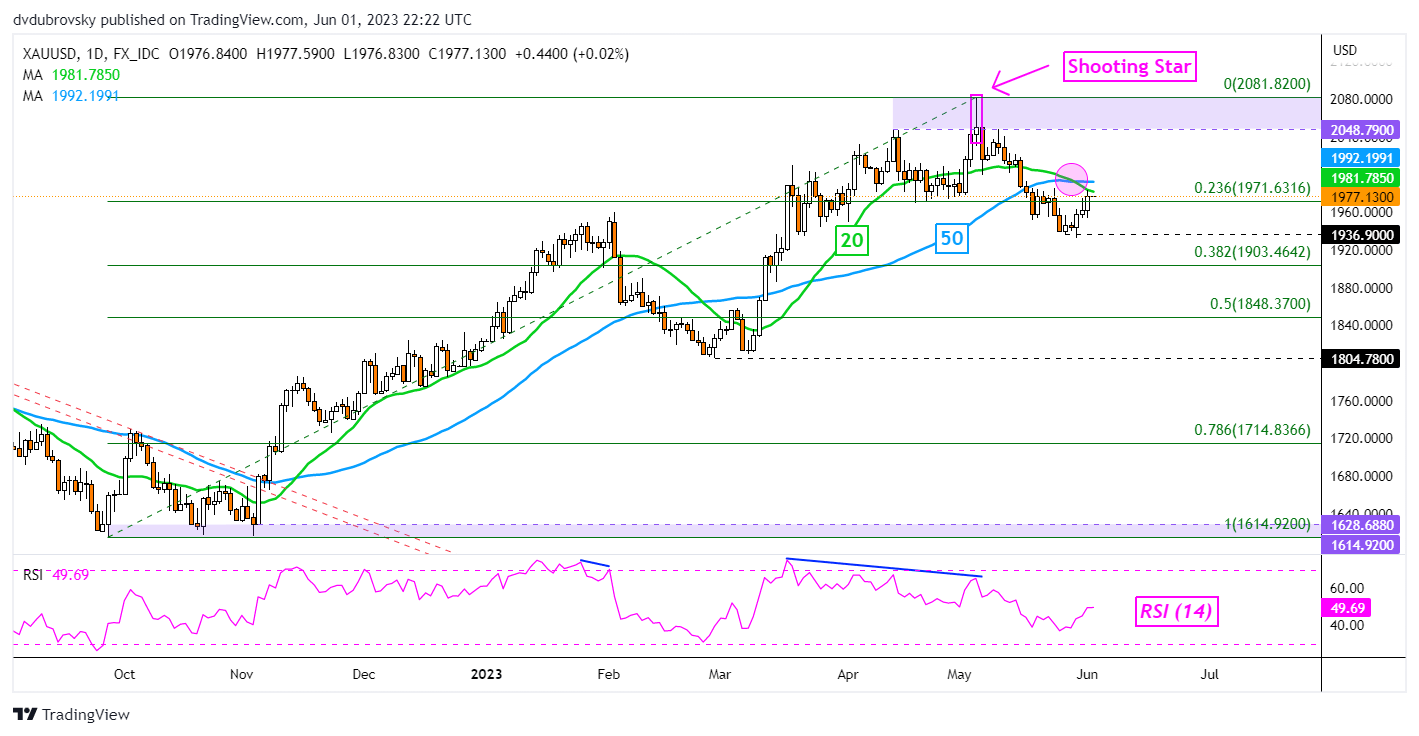
Gold prices face the next critical technical obstacle on the daily chart below. A bearish Death Cross between the 20- and 50-day Simple Moving Averages formed recently, offering a downside technical bias. Prices have rallied up to the 20-day line, which may hold as resistance, with the 50-day equivalent shortly after. As such, these could reinstate the downside focus. Key support seems to be at 1936.

XAU/USD Daily Chart

XAU/USD Daily Chart


Crude Oil Price Jumps on Optimism Ahead of OPEC+ Meeting. Where to for WTI?

Crude Oil Price Jumps on Optimism Ahead of OPEC+ Meeting. Where to for WTI?

The crude oil price went to a three-week low yesterday before staging a solid recovery with markets taking onboard some positive economic news and the US Dollar facing some headwinds. The market is now focusing on the OPEC+ meeting that kicks off this weekend.

China’s better-than-expected Caixin PMI got the ball rolling, compensating for Wednesday’s weak official PMI reading. Japan’s private capital expenditure was a beat, as was the US ADP jobs data. Eurozone CPI eased as well, further buoying the mood.

Not every piece of data was rosy, and all the statistics can be found on the economic calendar here. Markets also appear to be optimistic that the US debt ceiling deal will pass through the Senate late Friday.

It seems that Treasury yields slid lower on the prospect of a resolution and might continue to do so should the vote pass without incident. The benchmark 2-year note is around 30 basis points lower from the peak seen at this time last week of 4.64%.

The US Dollar weakness was broad-based with the global growth-orientated Australian Dollar seen as the largest beneficiary. Industrial metals have also notched up notable gains in the last 24 hours.

For the oil market, the focus will be on the OPEC+ meeting that will begin this Sunday in Vienna. A number of top officials from the oil-producing nations have been making ructions around production targets.

Of intrigue is the lack of coherency between the commentary and this places significant focus on this gathering. The cut to production announced by the cartel in early April saw a price gap higher in oil.

Headlines emanating from this assembly may trigger volatility to start next week.

WTI CRUDE OIL TECHNICAL ANALYSIS

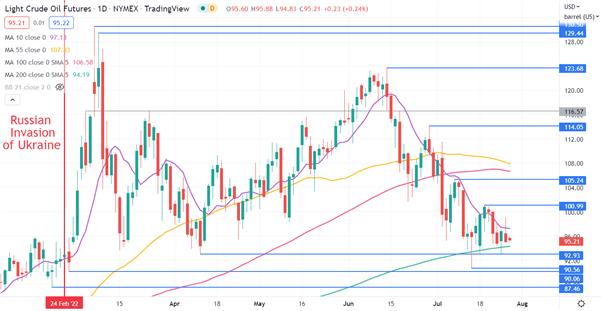
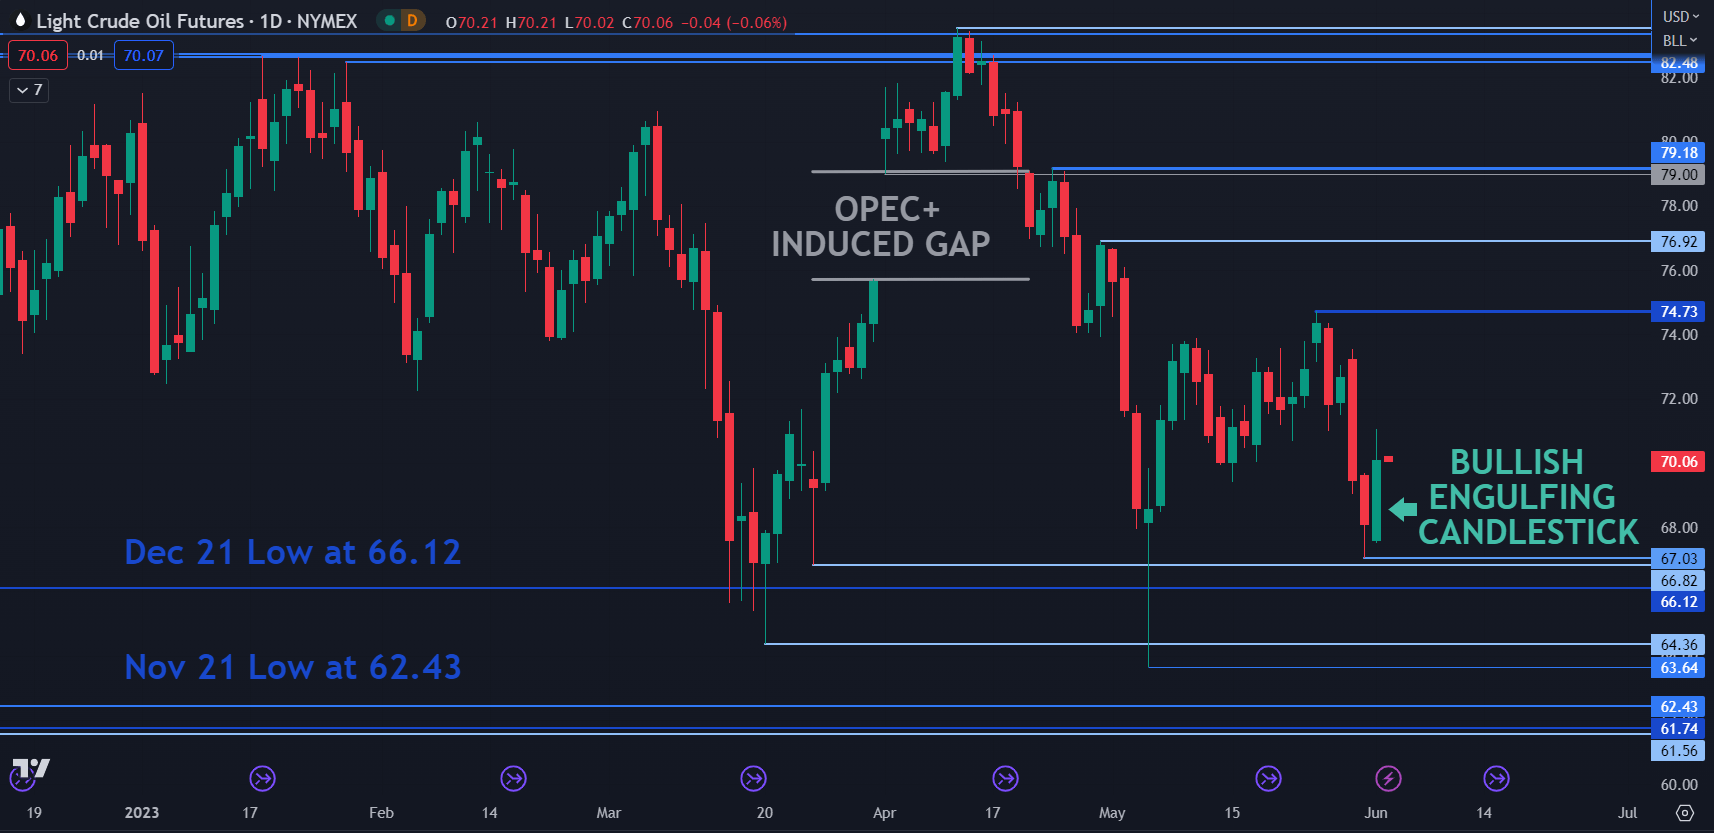
The WTI crude oil front month futures contract made a low at 67.03 yesterday which was just above a breakpoint at 66.82. These levels may provide support, as well as the breakpoints and prior lows of 66.12, 64.36, 63.64, 62,43, 61,74 and 61.56.

After making that low, it rallied and the price action has now created a Bullish Engulfing Candlestick formation and could indicate that a bullish reversal could unfold.

On the topside, resistance might be at the previous peaks at 74.73, 76.92 and 79.18 ahead of the cluster zone in the 82.50 – 83.50 area.

image1.png


Hoping For an Early Fed Pivot Does Not Mean We Will Get One

Hoping For an Early Fed Pivot Does Not Mean We Will Get One

Every economic age has its dominant phrase. Think of the ‘irrational exuberance’ which then-Federal Reserve Chair Alan Greenspan fretted about during the 1990’s dot-com bubble. If that’s too far back for you, what about European Central Bank chief Mario Draghi in 2012 promising skeptical markets that he’d do ‘whatever it takes’ to save the Euro?

The buzzword of this inflation-ravaged era is more succinct. In fact, it’s just one word – ‘pivot.’

For our purposes it means the point at which the United States Federal Reserve will feel it can stop raising interest rates and begin to offer the possibility that they could start to go down.

It’s easy to see why that word dominates. 2022 brought, among other dark things, interest rate rises unprecedented in the working lives of many people now engaged with financial markets. The US central bank has hit the monetary brakes no fewer than seven times, pushing the benchmark rate up to a target range of 4.25-4.5%. That’s the highest rate in fifteen years. Moreover, while there are clear rhetorical signs that the Fed is now more cautious about raising rates than it was back in the summer, there are equally clear signals that borrowing costs will go higher yet and that it may not top out below 5%.

Given that the Fed Funds rate spent much of the time between 2009 and 2021 barely above zero, the scale of the turnaround has been astonishing.

And given that so many market participants cut their teeth in a long era of docile inflation, cheap money and ever-flowing credit, it’s no wonder that so many should be keen that the Fed does indeed pivot as soon as possible. The thing about Golden Ages is that people always want them back.

But that doesn’t mean they come back. Of course, the key to whether or not the Fed will, in fact, pivot, will be found in the inflation data. And the picture there is still very unclear.

Boosted by a number of factors, from the war in Ukraine through to Covid’s supply-chain havoc and a general rethink of the previously dominant trend toward ever-more globalization, prices surged in 2022 by measures not seen for fully 40 years. The US was not alone in facing this gale, of course. Other countries did so too, and some had it a lot worse. Inflation has run hotter in Europe thanks among other factors to its energy dependence on Russia.

Even Japan has seen a resurgence of pricing power, where inflation has been thought dead for decades.

But the US still runs the table, and it’s the success of the US response which will matter most. And there are some encouraging signs. The Fed’s preferred measure of inflation continued to slacken in November, providing another indicator that price pressures may indeed have peaked earlier in the year.

The Personal Consumption Expenditures price index, or PCE, rose 5.5% on the year, well below the 6.1% rise seen just a month earlier. The core measure, which cuts out the volatile effects of food and energy costs, was up by a more reassuring 4.7% annualized. Both readings were at their lowest since October 2021.

The release chimes with official Consumer Price Index data for the same month, which showed a similar slackening.

Nevertheless, price rises there still stand at 7.1%, which is a very long way indeed from the 2% rate targeted by the Fed. Moreover, the US central bank’s mandate is to promote stable prices and maximum employment. There may not be many active in the markets today who remember the inflationary pressures of the 1970s and early 1980s. However, there will be many in the Fed who do remember them, and how hard-won the victory was. The monetarist students at the US central bank will be only too aware that they can’t afford to end the rate rising process until inflation – and as importantly, inflation expectations – have been actually and obviously seen to be crushed.

Hence, we see things like stocks falling despite robust Gross Domestic Product numbers. Investors are seeing everything through the inflation prism, and any sign that the Fed’s action has yet to clearly cool economic activity just has investors ever-more convinced that the pivot is not here yet.

5.5% inflation may be better than 6.1%, but it’s still outrunning the Fed’s target by a huge amount, and there’s simply no way policymakers are going to stop fighting while that’s the case. Chair Jerome Powell and the rest of the Open Market Committee well know that their success in getting inflation down will define their time.

Many commentators think we might get very close to pivot territory by the late spring of next year, but in truth we’d probably have to see a marked moderation in wage momentum and, probably, employment growth. Both have remained surprisingly strong despite the Fed’s actions.

Inflation also has a nasty tendency to get sticky. Faced with rising prices, employees demand higher wages, which only add to cost pressures at a time when there’s usually little option but to pass these on again to consumers. And so on…

The upshot of all this is that it could yet be a very long time before the Fed actually does ‘pivot,’ and any prognosis that such a thing could happen in the early part of 2023 depends on evidence of a pretty rapid economic slowdown coming soon. If the economic data don’t start to support this thesis unambiguously in the early months of the year, then the waiting for the pivot could prove a much longer game than many in the markets now hope it’ll be.

How Do the US Dollar, Gold, S&P 500, and More Trade at the Onset of Recessions?

How Do the US Dollar, Gold, S&P 500, and More Trade at the Onset of Recessions?

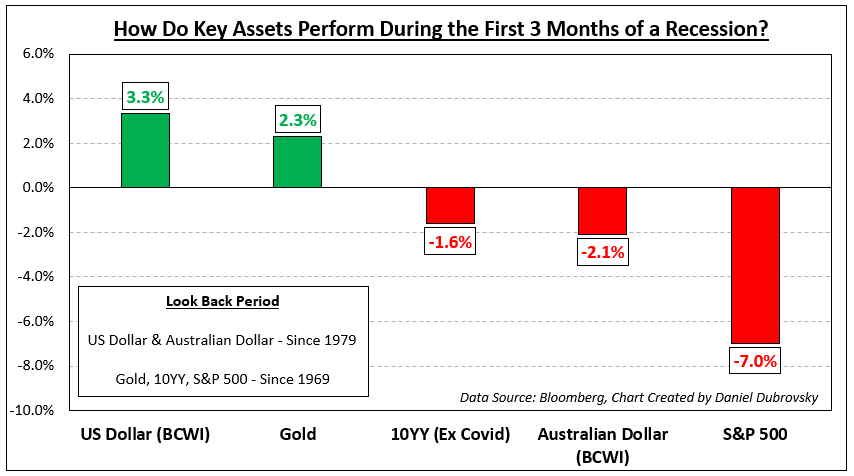
The onset of recessions in the United States typically results in reoccurring financial market trading patterns. While not all of them will be the same, we can look back and see how key assets have performed. This is a special report that analyzes how the US Dollar, gold, S&P 500, Australian Dollar and 10-year Treasury yield traded during the first 3 months of economic downturns.

The length and severity of each recession will vary. This means the usual reaction you might expect from an asset during the onset of a downturn will not always repeat perfectly. For example, during the 2000s housing crash, the US entered a recession in Q4 of 2007. While the stock market declined during these 3 months as one might have expected, peak market volatility occurred much later towards the end of 2008.

Before diving into this topic, I need to set the ground rules, starting with the definition of a recession. In this study, I will be using a GDP-based recession indicator, which attempts to assign dates to downturns based on a mathematical model. This is as opposed to the NBER’s Business Cycle Dating Committee playbook, which can at times be subjective. You can learn more about the indicator I am referencing here.

This definition is also different from the widely referenced two consecutive quarters of negative growth, which is unofficial and often too simplistic, failing to capture other economic trends. For example, in 2022, the economy experienced 2 quarters of negative growth in Q1 and Q2. But, the labor market outperformed.

For analyzing the US and Australian Dollars, I will be using a correlation-weighted currency index instead of an exchange rate. This helps us capture the broader direction of a currency against the world rather than any individual unit. Otherwise, comparing AUD/USD with the DXY Dollar Index runs the risk of placing too much emphasis on the greenback.

Average Snapshot

The chart below is a snapshot of how these assets performed during the onset of recessions ordered from best performing to the worst. The sequence is as follows: US Dollar, gold, 10-year Treasury yield, Australian Dollar and S&P 500. The availability of currency data meant I could only look back to 1979. For the rest of the assets, I was able to look back to 1969. The remainder of this article breaks down the individual performance beginning with the US Dollar.

Average Snapshot

US Dollar

Looking back to recessions since 1979, which adds up to 6, the Bloomberg Correlation-Weighted US Dollar Index rose 3.3% on average in the first 3 months of economic downturns. That is not to say each time it climbed. The up/down ratio is 50%. But, as you can see in the chart below, when the dollar rallies, it tends to do so strongly. During periods when the currency fell, the downside reaction was much weaker. This should come as little surprise. In the currency spectrum, the US Dollar functions as a haven given its status as the world’s reserve currency.

US Dollar

Gold

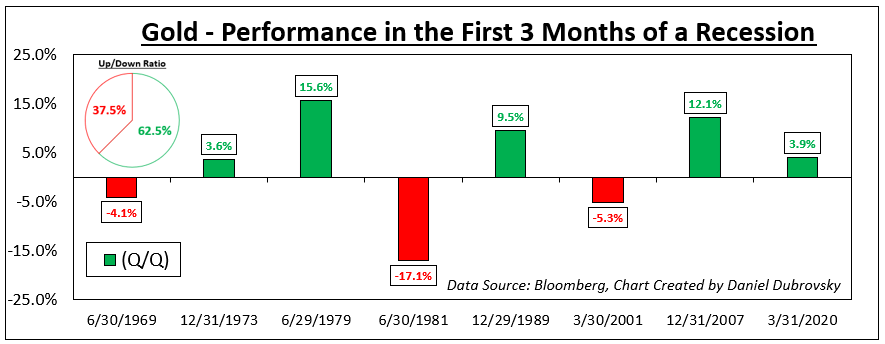
Meanwhile, gold also tends to perform decently at the onset of recessions going back to 1969. On average, the yellow metal returned +2.3% with a win/loss ratio of about 62.5%. Like the US Dollar, the wins were stronger than your average losses, excluding the early 1980s recession (-17.1%). Does this make gold a haven? Remember that gold is not as liquid as a currency. XAU/USD tends to function as an anti-fiat instrument. When the return on cash dwindles, which is what usually happens during recessions, gold becomes relatively more attractive and vice versa.

Gold

10-Year Treasury Yield

From this point forward, we are moving on to assets that underperform. Since 1969, the 10-year Treasury yield has declined by -1.6% on average during the onset of recessions (excluding Covid, which was a major negative outlier that skews the mean). Factoring in Covid though, the up/down ratio is about 29%. Bonds tend to receive a high amount of demand during economic uncertainty due to perceived safety, pushing up the price at the cost of yields.

10-Year Treasury Yield

Australian Dollar

Looking at the Bloomberg Correlation-Weighted Australian Dollar Index, the Aussie returned on average -2.1% during the first 3 months of a US recession since 1979. AUD also has a depressingly low win/loss rate of 16.7%. In currency markets, the Aussie is known for its sentiment-linked status, often closely following equities. Australia’s economy is closely tied to the global business cycle due to commodity exports, making it important to watch growth in the United States. When the latter sneezes, the world can catch a cold, driving up market volatility and negatively impacting the Australian Dollar.

Australian Dollar

S&P 500

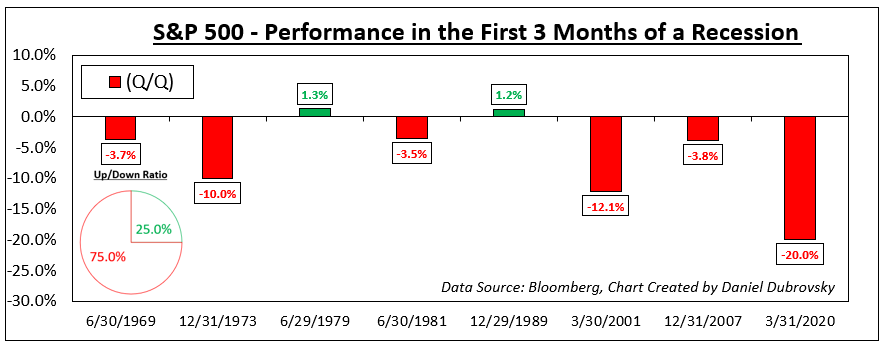
Finally, we arrive at the S&P 500, which is one of the key US benchmark stock indices. Unsurprisingly, the S&P 500 has returned on average -7.0% at the onset of recessions since 1969. But, unlike the Australian Dollar, the win/loss ratio is slightly better at 25%. This is unsurprising. Depending on the severity of the recession, uncertainty plays a key role in how much the stock market declines and how fast it does.

Recessions raise the risk that companies can go out of business and/or lay off workers, resulting in stock market crashes. Often, a bubble popping can lead to a recession, such as the dotcom bust in the early 2000s and the housing market leading in 2008. There are also leading indicators of a recession that you might be interested to learn about.

S&P 500

GBP/USD Price Forecast: Pound Rally Awaits NFP Confirmation

GBP/USD Price Forecast: Pound Rally Awaits NFP Confirmation

GBPUSD FUNDAMENTAL BACKDROP

The British pound has been given a significant boost after concern around the US debt ceiling has been lifted. Risk sentiment across currency markets has improved alongside commentary by Fed officials of a possible pause in the June meeting to acquire more data to generate a clearer picture of the US economy. A comparatively more hawkish Bank of England (BoE) now expected to hike again later this month due to elevated UK inflation has supplemented the bullish bias for the pound.

BANK OF ENGLAND INTEREST RATE PROBABILITIES

image1.png

The economic calendar today is dominated by the US Non-Farm Payroll (NFP) report (see economic calendar below) which I cover extensively in my NFP Preview. From a cable perspective, this release may extend the rally (NFP miss or in line with estimates) or cap upside should the report come in stronger than expected.

ECONOMIC CALENDAR

image2.png

TECHNICAL ANALYSIS

GBP/USD WEEKLY CHART

image3.png

Chart prepared by Warren Venketas, IG

The weekly cable chart shows a possible weekly close in the form of a bullish engulf (black), opening up room for further upside for sterling.

GBP/USD DAILY CHART

image4.png

The daily chart highlights the key area of confluence around the 1.2545 resistance zone (blue) – an area bears have defended relentlessly of recent. A confirmation daily close above this level could approve the longer term bullish engulf and expose subsequent resistance zones.

Key resistance levels:

  • 1.2680
  • 1.2584
  • 1.2545 (blue zone)

Key support levels:

  • 1.2500
  • 50-day MA (yellow)

BULLISH IG CLIENT SENTIMENT

IG Client Sentiment Data (IGCS) shows retail traders are currently net SHORT on GBP/USD with 58% of traders holding short positions (as of this writing). At DailyFX we typically take a contrarian view to crowd sentiment resulting in a short-term upside disposition.

How to Read a Candlestick Chart

How to Read a Candlestick Chart

Reading candlestick charts – Talking points:

  • Candlestick charts differ greatly from the traditional bar chart
  • Traders generally prefer using candlestick charts for day-trading because they offer an enjoyable visual perception of price
  • It’s important to understand the key components of a candle, and what they indicate, to apply candlestick chart analysis to a trading strategy

What is a candlestick chart?

A candlestick chart is simply a chart composed of individual candles, which traders use to understand price action. Candlestick price action involves pinpointing where the price opened for a period, where the price closed for a period, as well as the price highs and lows for a specific period.

Price action can give traders of all financial markets clues to trend and reversals. For example, groups of candlesticks can form patterns which occur throughout forex charts that could indicate reversals or continuation of trends. Candlesticks can also form individual formations which could indicate buy or sell entries in the market.

The period that each candle depicts depends on the time-frame chosen by the trader. A popular time-frame is the daily time-frame, so the candle will depict the open, close, and high and low for the day. The different components of a candle can help you forecast where the price might go, for instance if a candle closes far below its open it may indicate further price declines.

Boost your chart patterns expertise with our interactive quiz!

Our Forex Trading Patterns Quiz will test your knowledge of some of the most important trading patterns. Take the test today by clicking on the link and raise your technical analysis game!

Interpreting a candle on a candlestick chart

The image below represents the design of a typical candlestick. There are three specific points (open, close, wicks) used in the creation of a price candle. The first points to consider are the candles’ open and close prices. These points identify where the price of an asset begins and concludes for a selected period and will construct the body of a candle. Each candle depicts the price movement for a certain period that you choose when you look at the chart. If you are looking at a daily chart each individual candle will display the open, close, upper and lower wick of that day.
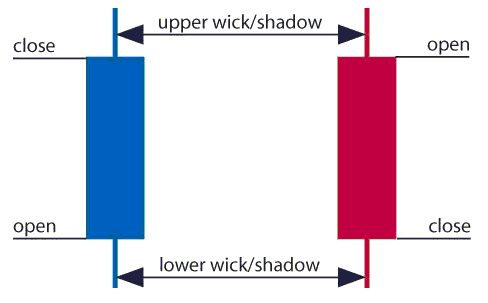
A red and a blue candlestick with open and close wicks

Open price:

The open price depicts the first price traded during the formation of the new candle. If the price starts to trend upwards the candle will turn green/blue (colors vary depending on chart settings). If the price declines the candle will turn red.

High Price:

The top of the upper wick/shadow indicates the highest price traded during the period. If there is no upper wick/shadow it means that the open price or the close price was the highest price traded.

Low Price:

The lowest price traded is the either the price at the bottom of the lower wick/shadow and if there is no lower wick/shadow then the lowest price traded is the same as the close price or open price in a bullish candle.

Close Price:

The close price is the last price traded during the period of the candle formation. If the close price is below the open price the candle will turn red as a default in most charting packages. If the close price is above the open price the candle will be green/blue (also depends on the chart settings).

The Wick:

The next important element of a candlestick is the wick, which is also referred to as a ‘shadow’. These points are vital as they show the extremes in price for a specific charting period. The wicks are quickly identifiable as they are visually thinner than the body of the candlestick. This is where the strength of candlesticks becomes apparent. Candlesticks can help traders keep our eye on market momentum and away from the static of price extremes.

Direction:

The direction of the price is indicated by the color of the candlestick. If the price of the candle is closing above the opening price of the candle, then the price is moving upwards and the candle would be green (the color of the candle depends on the chart settings). If the candle is red, then the price closed below the open.

Range:

The difference between the highest and lowest price of a candle is its range. You can calculate this by taking the price at the top of the upper wick and subtracting it from the price at the bottom of the lower wick. (Range = highest point – lowest point).

Having this knowledge of a candle, and what the points indicate, means traders using a candlestick chart have a clear advantage when it comes to distinguishing trendlines, price patterns and Elliot waves.

Bar Chart vs Candlestick Chart

As you can see from the image below, candlestick charts offer a distinct advantage over bar charts. Bar charts are not as visual as candle charts and nor are the candle formations or price patterns. Also, the bars on the bar chart make it difficult to visualize which direction the price moved.
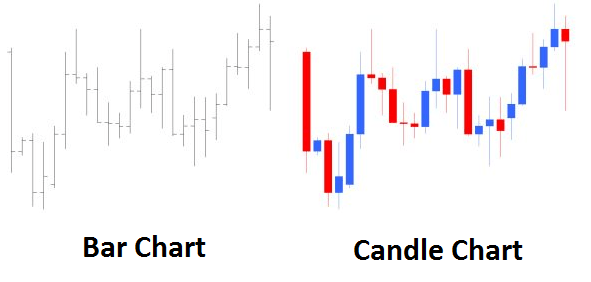
Difference between bar chart and candle chart

Forex for Beginners

Forex for Beginners
Recommended by David Bradfield
From margin to leverage and more: Key concepts explained
Get My Guide

How to read a candlestick chart

There are various ways to use and read a candlestick chart. Candlestick chart analysis depends on your preferred trading strategy and time-frame. Some strategies attempt to take advantage of candle formations while others attempt to recognize price patterns.

Interpreting single candle formations

Individual candlesticks can offer a lot of insight into current market sentiment. Candlesticks like the Hammer, shooting star, and hanging man, offer clues as to changing momentum and potentially where the market prices maytrend.

As you can see from the image below the Hammer candlestick formation sometimes indicates a reversal in trend. The hammer candle formation has a long lower wick with a small body. Its closing pricing is above its opening price. The intuition behind the hammer formation is simple, price tried to decline but buyers entered the market pushing the price up. It is a bullish signal to enter the market, tighten stop-losses or close out a short position.

Traders can take advantage of hammer formations by executing a long trade once the hammer candle has closed. Hammer candles are advantageous because traders can implement ‘tight’ stop-losses (stop-losses that risk a small amount of pips). Take-profits should be placed in such a way as to ensure a positive risk-reward ratio. So, the take-profit is larger than the stop-loss.
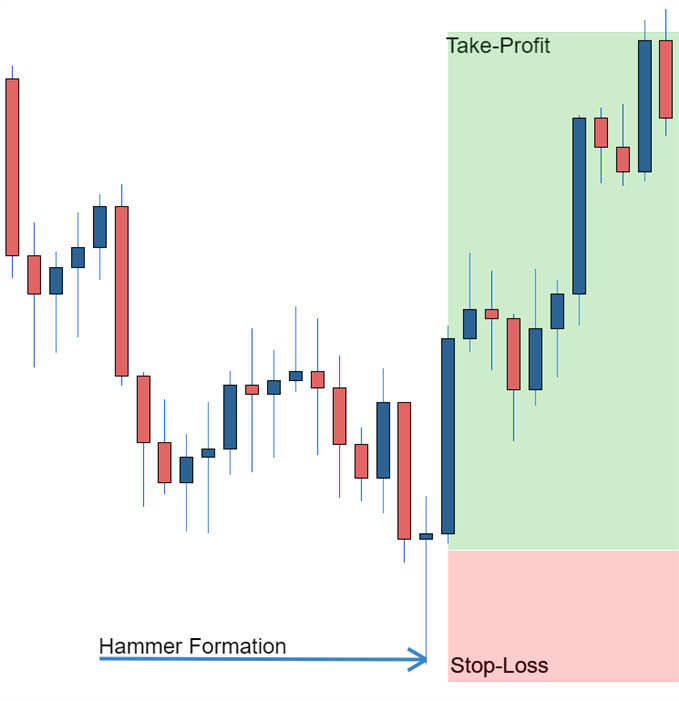
Hammer formation showing stop loss

Recognizing price patterns in multiple candles

Candlestick charts help traders recognize price patterns that occur in the charts. By recognizing these price patterns, like the bullish engulfing pattern or triangle patterns you can take advantage of them by using them as entries into or exit signals out the market.

For example, in the image below we have the bullish engulfing price pattern. The bullish engulfing is a combination of a red candle and a blue candle that ‘engulfs’ the entire red candle. It is an indication that it could be the end of a currency pairs established weakness. A trader would take advantage of this by entering a long position after the blue candle closes. Remember, the price pattern only forms once the second candle closes.

As with the hammer formation, a trader would place a stop loss below the bullish engulfing pattern, ensuring a tight stop loss. The trader would then set a take-profit. For more forex candlestick charts check our forex candlesticks guide where we go in depth into the advantages of candlestick charts as well as the strategies that can be implemented using them.
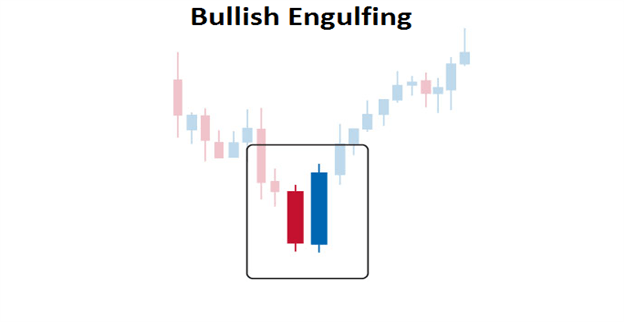
Bullish engulfing pattern

Further tips for reading candlestick charts

When reading candlestick charts, be mindful of:

At DailyFX we offer a range of forecasts on currencies, oil, equities and gold that can aide you in your trading. It is also worth following our webinars where we present on a variety of topics from price-action to fundamentals that may affect the market.