AUD/USD refreshes day low below 0.6600 despite mixed views for Fed policy, RBA policy eyed

AUD/USD refreshes day low below 0.6600 despite mixed views for Fed policy, RBA policy eyed

The AUD/USD has refreshed its day’s low at 0.6587 in the London session. The Aussie asset has witnessed immense selling pressure despite the street holding mixed views on the interest rate decision by the Federal Reserve (Fed) for June’s monetary policy meeting.

S&P500 futures are holding nominal gains in the European session, indicating that the risk appetite theme is being underpinned by the market participants. The overall upbeat market mood seems biased toward the US equities and not supporting the risk-sensitive currencies. The US Dollar Index (DXY) has turned sideways after printing a fresh day’s high at 104.32. The USD Index is expected to extend its upside journey amid the absence of signals of exhaustion in the upside momentum.

Meanwhile, the street is divided about Fed’s interest rate policy stance. A scrutiny of the Friday’s Nonfarm Payrolls (NFP) report showed that the Unemployment Rate jumped to its seven-month high at 3.7%. Contrary to that, additions of fresh payrolls in the United States labor market in May were at 339K, significantly higher than the estimates of 190K. The situation is a little surprising on whether to consider consistent solid payroll additions and support more rate hikes or pause the same due to a sudden rise in the jobless rate.

On the Australian Dollar front, the interest rate decision by the Reserve Bank of Australia (RBA) will remain in focus. Considering the fact that Australian inflation has turned stubborn again as the monthly Consumer Price Index (CPI) indicator rose to 6.8% in April from March’s 6.3% figure, one more interest rate hike of 25 basis points (bps) which will push the Official Cash Rate (OCR) to 4.10%, cannot be ruled out.

Silver Price Analysis: XAG/USD turns vulnerable below $23.55 confluence support

Silver Price Analysis: XAG/USD turns vulnerable below $23.55 confluence support

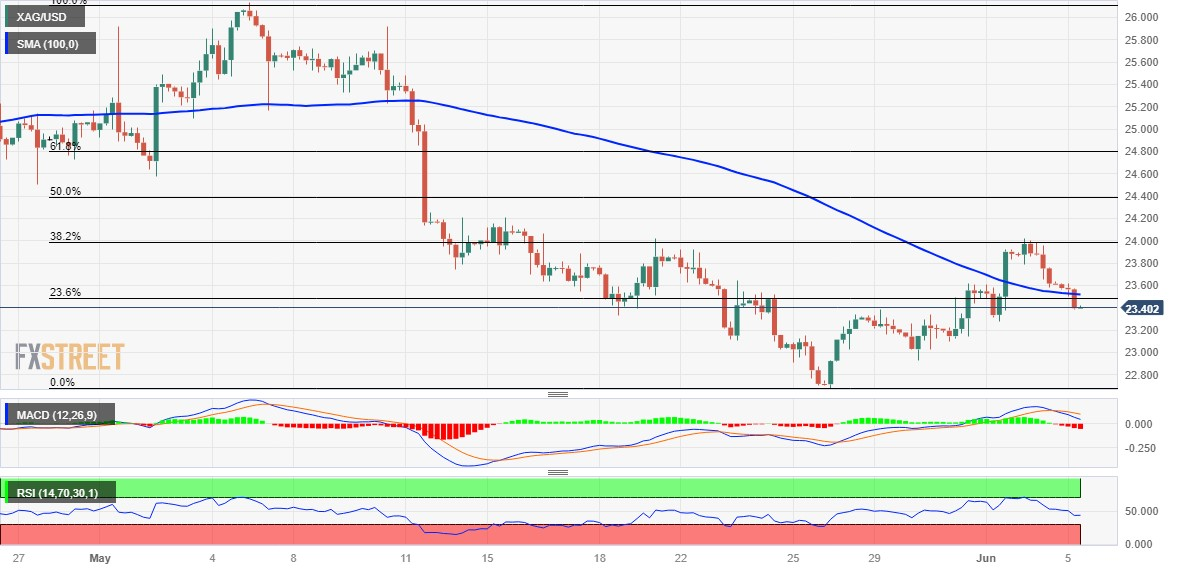
Silver extends Friday’s rejection slide from the $24.00 mark, or the 38.2% Fibonacci retracement level of the downfall witnessed in May and drifts lower for the second successive day. The white metal maintains its offered tone, just below the $23.50 level through the early European session on Monday and seems vulnerable to weaken further.

From a technical perspective, the intraday slide drags the XAG/USD below the $23.55 confluence support, comprising the 23.6% Fibo. level and the 100-period Simple Moving Average (SMA) on the 4-hour chart. Moreover, bearish oscillators on daily/4-hour charts add credence to the negative outlook and support prospects for a further intraday depreciating move.

Hence, a subsequent slide, towards testing the $23.00 round figure, looks like a distinct possibility. Some follow-through selling will expose the $22.70-$22.65 region, or over a two-month low touched in May, below which the XAG/USD could eventually drop to the $22.00 mark. The latter represents the very important 200-day SMA and should act as a pivotal point.

On the flip side, sustained strength beyond the $23.55 confluence support breakpoint could allow the XAG/USD to make a fresh attempt towards conquering the $24.00 mark. This is closely followed by the $24.15-$24.20 horizontal resistance, above which the momentum could push the commodity further towards the 50% Fibo. level, around the $24.45-$24.50 region.

The XAG/USD might eventually climb to the $24.80 zone, or the 61.8% Fibo. level, and aim to reclaim the $25.00 psychological mark for the first time since May 11. The upward trajectory could get extended further towards the $25.30-$25.35 supply zone en route to the $26.00 round figure and over a one-year high, around the $26.10-$26.15 area touched in May.

Silver 4-hour chart

fxsoriginal

USD/CAD sticks to gains on stronger USD, remains below mid-1.3400s amid bullish Oil prices

USD/CAD sticks to gains on stronger USD, remains below mid-1.3400s amid bullish Oil prices

The USD/CAD pair attracts some buying near the 200-day Exponential Moving Average (EMA) on Monday and sticks to its modest intraday gains through the early part of the European session. The pair currently trades around the 1.3430-1.3435 region, up nearly 0.10% for the day, and for now, seems to have snapped a three-day losing streak to the 1.3400 mark, or a nearly three-week low touched on Friday.

The US Dollar (USD) gains some follow-through traction for the second successive day and turns out to be a key factor acting as a tailwind for the USD/CAD pair. Despite the mixed US monthly employment details, the markets area still pricing in another 25 bps lift-off by the Federal Reserve (Fed) later this month. This remains supportive of a further rise in the US Treasury bond yields and pushes the Greenback higher on the first day of a new week. That said, the prevalent risk-on mood might hold back traders from placing aggressive bullish bets around the safe-haven buck.

The markets continue to cheer the optimism over the passage of legislation to lift the government’s $31.4 trillion debt ceiling to avert an unprecedented American default. Adding to this, a private-sector survey showed on Monday that China’s services activity picked up in May and boosted investors’ confidence, which is evident from a generally positive tone around the equity markets. This, along with an intraday rally in Crude Oil prices, which tends to underpin the commodity-linked Loonie, further contributes to capping any meaningful upside for the USD/CAD pair.

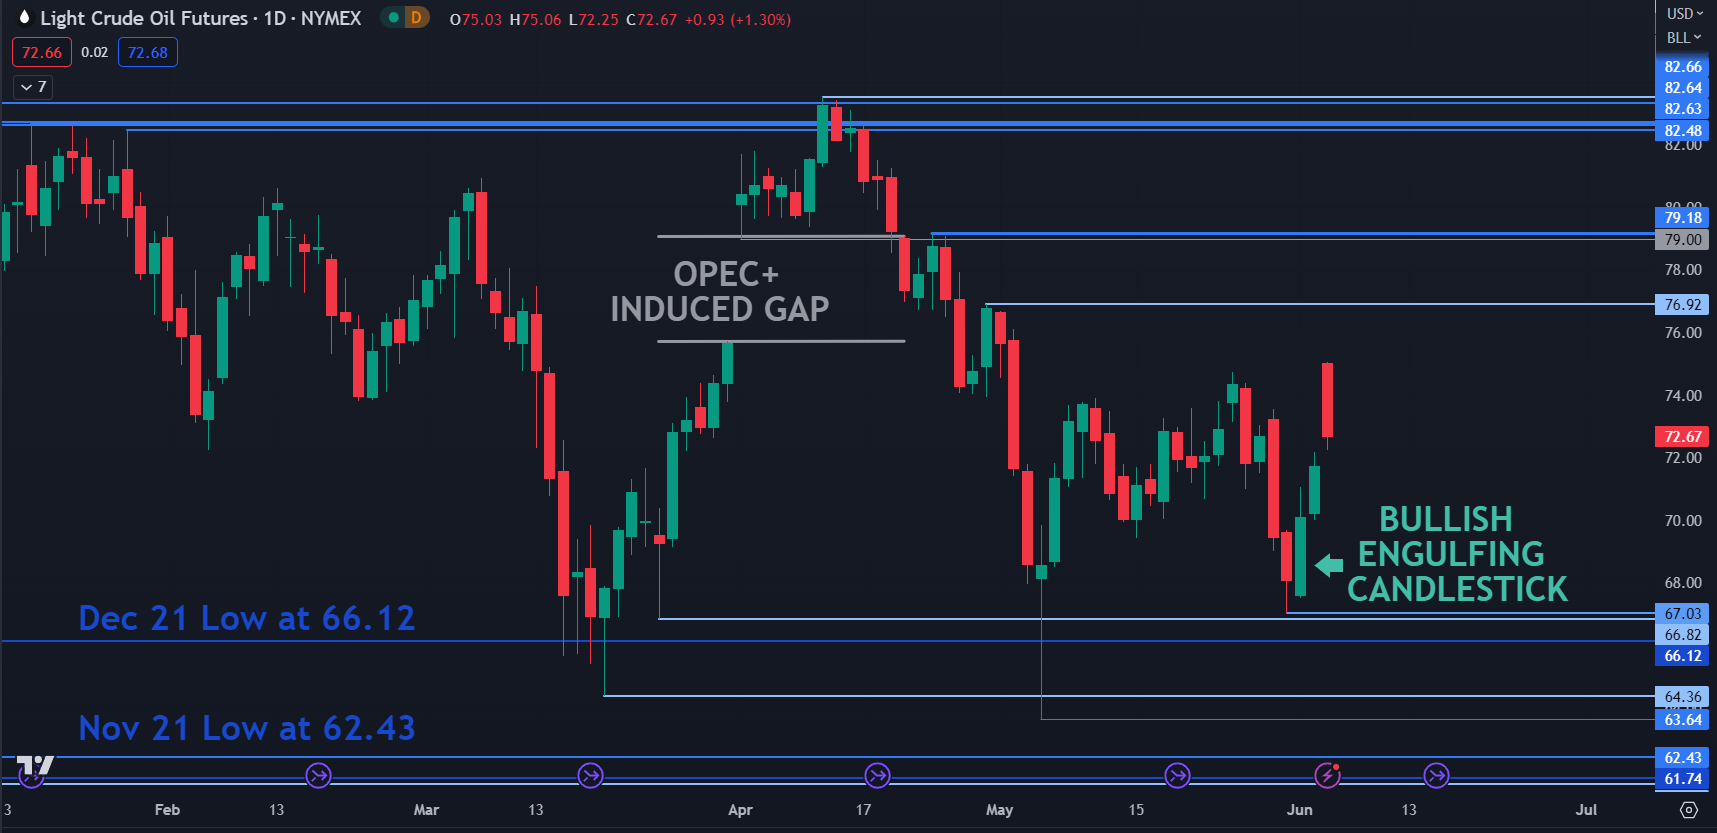
In fact, Oil prices opened with a bullish gap on Monday in reaction to an OPEC+ agreement over the weekend to extend at least 3.66 million bpd of cuts till end-2024 from end-2023. Adding to this, Saudi Arabia pledged to cut its production by about 1 million bpd in July to 9 million bpd and lends additional support to the black liquid. This, in turn, makes it prudent to wait for a strong follow-through buying around the USD/CAD pair before positioning for any further appreciating move ahead of the release of the US ISM Services PMI later during the early North American session.

USD/JPY sits near multi-day peak, around 140.25-30 area amid stronger USD

USD/JPY sits near multi-day peak, around 140.25-30 area amid stronger USD

The USD/JPY pair builds on Friday’s strong intraday positive move and gains some follow-through traction for the second successive day on Monday. The pair maintains its bid tone through the first half of the European session and currently trades around the 140.25-140.35 region, just a few pips below a four-day high touched in the last hour.

The post-NFP US Dollar (USD) recovery from over a one-week low remains uninterrupted on the first day of a new week and is seen as a key factor acting as a tailwind for the USD/JPY pair. Despite the mixed US jobs data released on Friday, the markets are still pricing in the possibility of another 25 bps rate hike by the Federal Reserve (Fed) at its policy meeting later this month. This, in turn, remains supportive of a further rise in the US Treasury bond yields and continues to underpin the Greenback.

The Japanese Yen (JPY), on the other hand, is weighed down by a more dovish stance adopted by the Bank of Japan (BoJ). Apart from this, the prevalent risk-on mood – as depicted by a generally positive tone around the equity markets – further dents the JPY’s relative safe-haven status and lends additional support to the USD/JPY pair. That said, the prospect of Japanese authorities intervening in the markets helps limit deeper losses for the JPY and caps any further gains for the major, at least for now.

This, in turn, warrants some caution for aggressive bullish traders and before positioning for any further intraday appreciating move. The fundamental backdrop, however, suggests that the path of least resistance for the USD/JPY pair is to the upside. Trades now look to the US ISM Services PMI, due later during the early North American session. Apart from this, the US bond yields will drive the USD, which, along with the broader risk sentiment, should provide fresh impetus to the major.

Strong growth signalled by UK service sector in May

Strong growth signalled by UK service sector in May

UK service providers maintained a strong rate of business activity expansion during May, with growth holding close to April’s 12-month peak. Survey respondents commonly cited resilient customer demand and cautious optimism about the near-term growth outlook, despite pressure on budgets from elevated inflation. Input costs increased at a rapid pace in May and the latest round of inflation was the strongest for three months. Higher operating expenses were overwhelmingly linked to rising staff wages. Efforts to pass on higher payroll costs resulted in a further steep increase in average prices charged. The headline

Industrial producer prices down by 3.2% in the euro area and by 2.9% in the EU

Industrial producer prices down by 3.2% in the euro area and by 2.9% in the EU

In April 2023, industrial producer prices fell by 3.2% in the euro area and by 2.9% in the EU, compared with March 2023, according to estimates from Eurostat, the statistical office of the European Union. In March 2023, prices decreased by 1.3% in both the euro area and the EU. In April 2023, compared with April 2022, industrial producer prices increased by 1.0% in the euro area and by 2.3% in the EU. Industrial producer prices in the euro area in April 2023, compared with March 2023, decreased by 10.1% in the energy sector and by 0.6% for intermediate goods, while prices increased by 0.2% for durable

Asia Day Ahead: US debt ceiling resolution brings focus back to Fed’s rate outlook

Asia Day Ahead: US debt ceiling resolution brings focus back to Fed’s rate outlook

With the US debt default crisis averted which has been largely priced by markets previously, central focus this week could be shifted back to the US Fed rate outlook. Following yet another stronger-than-expected read in the US May non-farm payroll, interest rate expectations are finding some conviction for the need of another 25 basis-point move from the Fed in July, while views have also adjusted towards a more prolonged pause in rates this year. At least for now, a promising uptick in unemployment rate and softer-than-expected wage growth still suggest that additional tightening could come as one-off moves as opposed to an extended process.

The US dollar has resumed its way higher (+0.6%), alongside a broad-based upmove in Treasury yields, which kept the pressure on gold and silver prices. Headlines of potential oil production cuts by Saudi Arabia in July has provided an initial boost for oil prices, but optimism were quick to fizzle out in today’s session. Market participants could be reminded of the short-lived rally back in April this year, where downside surprises in global economic data eventually overshadowed previous headlines of production cuts.

To see a more sustained upside in Brent crude prices, a series of resistance lies ahead to overcome. Prices are back to retest the US$78.60 level, where a near-term upward trendline stands alongside the Ichimoku cloud resistance. Greater conviction could have to come from a move back above the US$80.00 level in order to set the ground for a retest of its April 2023 high.
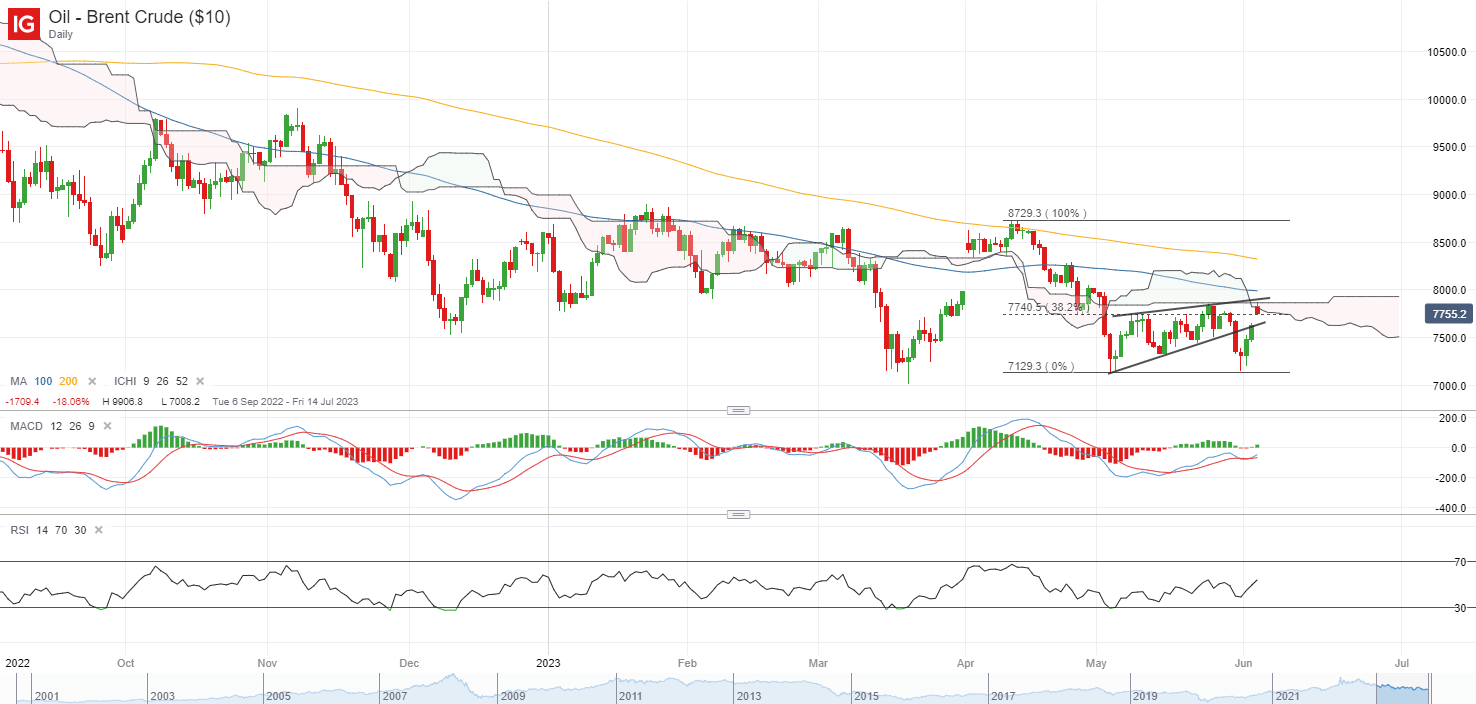
image1.png

Asian stocks look set for a positive open, with Nikkei +1.30%, ASX +1.21% and KOSPI +0.60% at the time of writing, largely displaying a follow-through from Wall Street’s rally to end last week. The eye-catching performance could be the 4% gain in the Hang Seng Index last Friday, potentially reflecting some expectations for upcoming policy support following the downside surprises in economic data thus far. Further validation may have to be sought on that front, while the economic calendar today will bring the release of the Caixin services PMI data. Economic resilience may be the key to provide any follow-through in gains.

For the Hang Seng Index, a bullish crossover on moving average convergence/divergence (MACD) may provide some relief for the bulls in the near term, but a series of resistance still stand in the way ahead. This includes a downward trendline resistance since January this year and the key psychological 20,000 level, which coincides with the upper edge of the Ichimoku cloud on the weekly chart. These levels may need to be overcome to provide greater conviction of a more sustained upside.
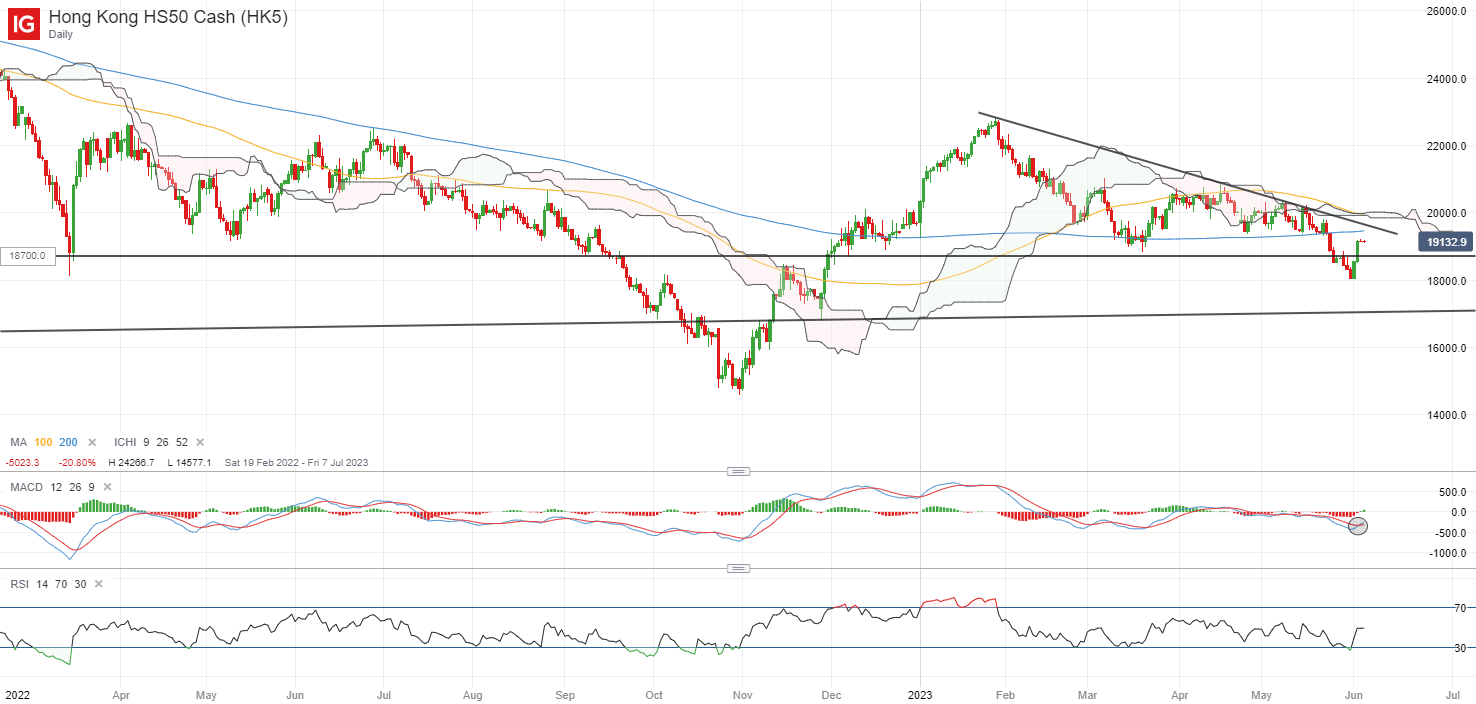
image2.png

US Treasury yields have found a broad-based move higher last Friday, following the stronger-than-expected US non-farm payroll figure which suggests that US interest rates could likely stay high for longer through the rest of the year. The two-year yields were up around 16 basis-points, with higher Treasury yields prompting gold prices to give back almost of its past week’s gains. The latest CFTC data has revealed further unwinding of net-long positioning among money managers for the third consecutive week, with potentially more room for moderation from previous bullish build-up if Treasury yields remain supported.

On the technical front, last week’s move has brought gold prices back to retest a key trendline support at the US$1,950 level. Any further move below its May 2023 low could mark a downward break of a key support confluence zone, where its 100-day moving average (MA) and Ichimoku cloud resides. That could pave the way to retest the US$1,875 level next.
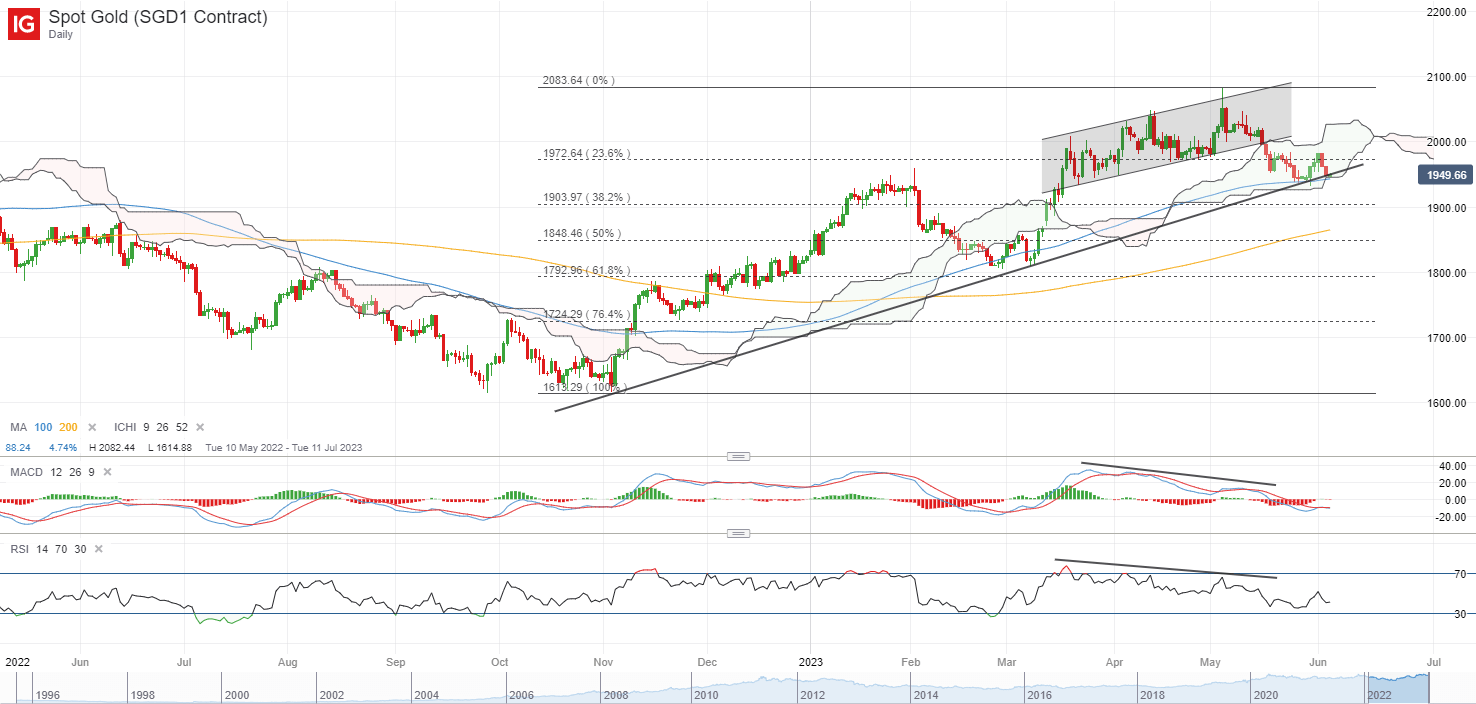
image3.png

Source: IG charts

Crude Oil Price Jumps Again after OPEC+ Announced Production Cuts. Higher WTI?

Crude Oil Price Jumps Again after OPEC+ Announced Production Cuts. Higher WTI?

Crude oil opened at a 5-week high on Monday after OPEC+ announced a reduction in the output target over the weekend that will take effect from the 1st of July.

The decision at the Vienna gathering of the Organisation of Petroleum Exporting Countries (OPEC+) comes after a similar move back in April that saw black gold race to a 6-month peak.

After that run-up, it collapsed to an 18-month low at the start of last month ahead of last weekend’s conclave. The price action so far today has been somewhat similar with an initial rally of over 4% from Friday’s close before giving up most of those gains. The latest prices can be viewed here.

Within OPEC+, Saudi Arabia will do most of the heavy lifting, lowering their production by a million barrels per day. This puts the largest oil-exporting nation at around 9 million barrels per day, down from circa 10.5 million barrels per day before the April cuts.

Russian production targets were left unchanged, and the United Arab Emirates (UAE) gained permission to add slightly while some African nations saw modest cuts and their output will be monitored.

The move had been telegraphed to some extent by the Saudi Arabia Minister of Energy Abdulaziz bin Salman.

Two weeks ago, he said, “speculators, like in any market, they are there to stay. I keep advising that they will be ouching. They did ouch in April. I don’t have to show my card, I’m not [a] poker player… but I would just tell them, watch out.”

The US Dollar is also stronger to start the week after mixed jobs data on Friday that saw 339k jobs added in May according to the non-farm payrolls data. This beat the 195k anticipated and there was also an upward revision to the April figure to 295k from 253k.

However, the unemployment rate ticked up to 3.7% from 3.4% prior and above the 3.5% forecast.

There had been some commentary from a number of Fed speakers last week hinting that the bank might ‘skip’ a hike at the June 14th Federal Open Market Committee (FOMC) meeting. We are now in the blackout period for committee members to be making public statements about policy until after the gathering. Without further guidance on Fed thinking, uncertainty and speculation might see a tick-up in volatility across markets, including oil prices.

WTI CRUDE OIL CHART

image1.png

Chart created in TradingView

Japanese Yen Week Ahead as Fed Skip Bets Grow: USD/JPY, EUR/JPY, AUD/JPY

Japanese Yen Week Ahead as Fed Skip Bets Grow: USD/JPY, EUR/JPY, AUD/JPY

The Japanese yen’s slide appears to be losing steam as US Federal Reserve rate hike expectations take a ‘U’-turn after dovish remarks from central bank officials.

The market is now pricing in a 79% chance of a pause at the June 13-14 FOMC meeting, compared to 35% a week ago, after several Fed officials including the vice chair-designate pointed toward a ‘skip’ in June. “Skipping a rate hike at a coming meeting would allow the Committee to see more data before making decisions about the extent of additional policy firming,” vice chair nominee Philip Jefferson said late last week.

However, any decision to hold rates steady should not be viewed as the end of the tightening cycle, the vice chair nominee added. Fed Chair Powell last month left the door open for a pause at the June meeting given the tightening in credit conditions, but reiterated that the central bank would now make decisions “meeting by meeting”.

USD/JPY Daily Chart

image1.png

Meanwhile, Japan’s Q1 GDP data and Econ Watchers Survey are due on Thursday, which could shed some light on the economy. Macro data have been underwhelming with the Economic Surprise Index for Japan at the lowest level since January. With Japan’s headline inflation showing signs of moderation and the Bank of Japan’s (BOJ) persistence with ultra-loose policy settings, there are very few monetary policy cues to push USD/JPY meaningfully in either direction as of now. For more discussion see “Making Sense of Japanese Yen’s Recent Slide: Is it the Start of a Renewed Leg Lower?”, published June 1.

USD/JPY 240-minute Chart

image2.png

Chart Created by Manish Jaradi Using TradingView

USD/JPY: Holding above a key cushion

USD/JPY has rebounded from quite strong converged support on the 89-period moving average and the lower edge of the Ichimoku cloud on the 240-minute charts. However, as the colour-coded candlestick charts show, USD/JPY remains in a consolidation phase within the broader short-term bullish phase (see the 240-minute chart).

The pair last week retreated from a stiff hurdle on the median line of a pitchfork channel from January (at about 141.30), roughly coinciding with the upper edge of a rising channel also from the start of the year. Last week’s high of 141.00 could continue to pose constraints on the latest rebound. On the downside, USD/JPY would need to drop below the mid-May low of 133.75 for the immediate upward pressure to fade.

EUR/JPY Daily Chart

image3.png

Chart Created by Manish Jaradi Using TradingView

EUR/JPY: Sideway price action could stretch a bit

The sharp drop in momentum even as EUR/JPY last week attempted to retest the early-May high of 151.60 is a sign that the cross could be due for an extended consolidation given the March-May rally. This follows a retreat from the upper edge of a rising channel from mid-2022 (see chart). There’s no threat to the broader uptrend unless EUR/JPY were to break below the 145.50-146.50 floor. In sum, EUR/JPY could be settling in a 146.00-152.00 range in the interim.

AUD/JPY Daily Chart

image4.png

Chart Created by Manish Jaradi Using TradingView

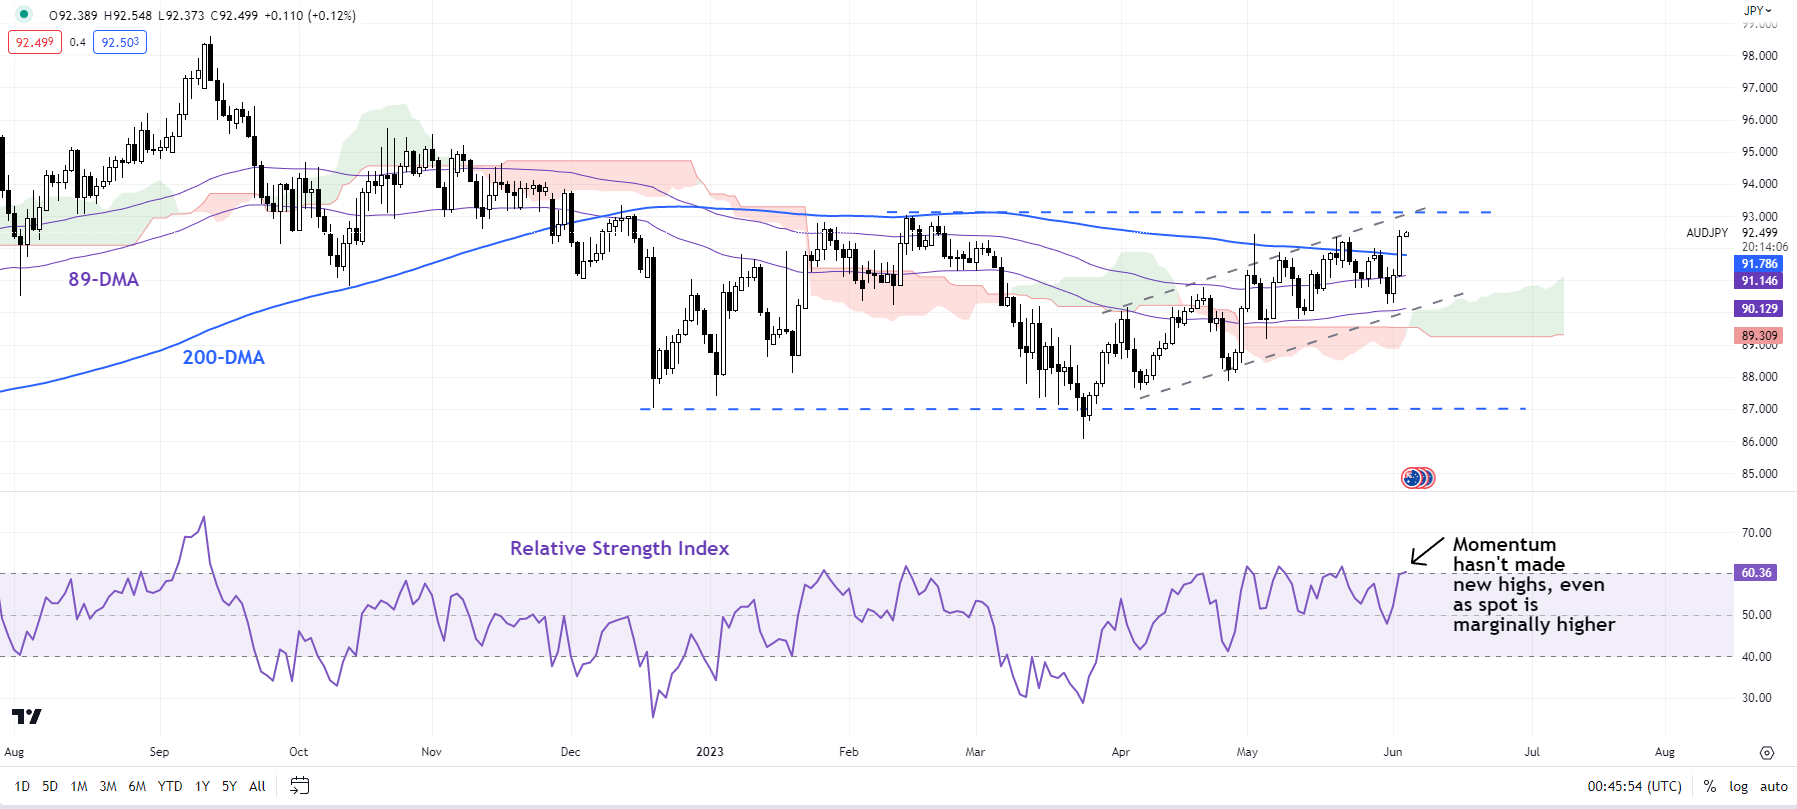
AUD/JPY: Struggles at a key ceiling

AUD/JPY is once again testing the tough converged barrier on the 200-day moving average, coinciding with the February high of 93.00. Interestingly, momentum hasn’t picked up substantially to reflect the renewed strength that the cross showed last week. Nevertheless, the cross needs to clear the cap for the outlook to improve materially. An encouraging sign for bulls is that AUD/JPY hasn’t broken any support, keeping alive the possibility of an eventual break higher.