EUR/USD Prices Forecast: Flat Ahead of ECB Decision to Hike or Pause

EUR/USD Prices Forecast: Flat Ahead of ECB Decision to Hike or Pause

Euro Holds Steady Ahead of ECB Decision

EUR/USD traders are keeping a close watch on the European Central Bank’s (ECB) impending monetary policy statement and interest rate decision on Thursday, with the Euro trading nearly flat against the U.S. Dollar. This comes as uncertainty prevails regarding whether the ECB will raise rates amidst growing concerns about inflation. The U.S. inflation data released on Wednesday failed to sway expectations of a Federal Reserve pause next week.

Early Cautious Stance

As of 09:00 GMT, the EUR/USD pair is trading at 1.0734, marking a slight increase of 0.04% or 0.004 points. The Euro has managed to recover marginally from a three-month low against the Dollar. However, it remains in a cautious stance as traders await the ECB’s decision, with the looming meeting acting as a cap on significant moves.

Trading Derivatives carries a high level of risk to your capital and you should only trade with money you can afford to lose. Trading Derivatives may not be suitable for all investors, so please ensure that you fully understand the risks involved, and seek independent advice if necessary. A Product Disclosure Statement (PDS) can be obtained either from this website or on request from our offices and should be considered before entering into a transaction with us. Raw Spread accounts offer spreads from 0.0 pips with a commission charge of USD $3.50 per 100k traded. Standard account offer spreads from 1 pips with no additional commission charges. Spreads on CFD indices start at 0.4 points. The information on this site is not directed at residents in any country or jurisdiction where such distribution or use would be contrary to local law or regulation.

ECB Dilemma: Hike or Pause?

Market expectations for the ECB’s meeting are divided between a rate pause and a 25 basis point rate increase. Notably, there’s a leaning towards a hike, partly driven by reports suggesting that the ECB expects inflation to stay above 3% next year, exceeding the 2% target.

Euro’s Fate Tied to ECB’s Inflation View

The Euro’s future trajectory hinges on the ECB’s updated economic forecasts, especially regarding inflation. The central bank faces a tough decision as it grapples with persistent high inflation, currently above 5%, against a backdrop of slowing economic growth.

A Last Hike or a Pause?

Analysts and investors had anticipated a rate pause, but the mood has shifted due to the prospect of higher inflation in the ECB’s forecasts. Currently, money markets assign a 63% probability of a rate hike, which would be the last in a cycle initiated in July 2022.

Risks and Economic Impact

The brisk tightening cycle undertaken by the ECB has started affecting the Eurozone economy, particularly in manufacturing and lending to businesses and households. Germany, the largest Eurozone economy, is showing signs of heading into recession. The ECB is also expected to lower its growth projections, raising concerns about the need for further tightening.

Short-Term Outlook

In summary, the Euro maintains a cautious stance as traders await the ECB’s rate decision, which could either mark the end of a tightening cycle or continue it amidst inflationary pressures. Economic uncertainties persist, with implications for both the Euro and the Eurozone’s economic outlook.

Technical Analysis

4-Hour EUR/USDThe EUR/USD market currently stands at 1.0732, slightly below the 4-hour close of 1.0734. The 200-4H moving average is 1.0865, indicating the price is below this long-term average. The 50-4H moving average at 1.0736 aligns closely with the current price. The 14-4H RSI reading of 47.97 suggests neutral momentum.

Major support rests at 1.0671 to 1.0638, with the main resistance at 1.0766 to 1.0772. Overall, the market sentiment appears neutral, with price proximity to key moving averages and RSI near 50, suggesting indecision. Further analysis is advised for a clearer trend. Traders expect more clarity after the release of the ECB statements. Bullish news could trigger a breakout over 1.0772.

Silver Prices Forecast: XAG/USD Faces Bearish Trend Amid Rate Uncertainty

Silver Prices Forecast: XAG/USD Faces Bearish Trend Amid Rate Uncertainty

Silver (XAG/USD) Prices Near One-Month Lows Amidst Dollar Strength and Fed Rate Pause Expectations

Silver (XAG/USD) prices are facing downward pressure as they approach one-month lows. This decline is primarily attributed to the strengthening U.S. dollar and the growing likelihood of a Federal Reserve rate pause. The recently released U.S. inflation data, although mixed, has solidified expectations of the Fed maintaining interest rates next week. This has diminished the attractiveness of non-interest-bearing assets like Silver in the eyes of investors.

While U.S. consumer prices surged in August, driven by soaring gasoline costs, the annual increase in underlying inflation was the smallest in nearly two years. This discrepancy has created uncertainty regarding the Fed’s rate trajectory for 2024.

Trading Derivatives carries a high level of risk to your capital and you should only trade with money you can afford to lose. Trading Derivatives may not be suitable for all investors, so please ensure that you fully understand the risks involved, and seek independent advice if necessary. A Product Disclosure Statement (PDS) can be obtained either from this website or on request from our offices and should be considered before entering into a transaction with us. Raw Spread accounts offer spreads from 0.0 pips with a commission charge of USD $3.50 per 100k traded. Standard account offer spreads from 1 pips with no additional commission charges. Spreads on CFD indices start at 0.4 points. The information on this site is not directed at residents in any country or jurisdiction where such distribution or use would be contrary to local law or regulation.

Traders Expect Unchanged Rates This Week with a Possibility of a Rate Hike in November

Market sentiment currently suggests a 97% probability that the Fed will keep interest rates unchanged in the upcoming week. However, there is a 40% chance of a rate hike in November, according to the CME’s FedWatch Tool. Simultaneously, the European Central Bank is considering raising its key interest rate. The decline in holdings of the SPDR Gold Trust by 0.3% further underscores weakening demand for gold and silver.

Impact of a Stronger Dollar and Fed’s Intent to Maintain Rates

The stronger U.S. dollar, reinforced by the inflation data, has made Silver relatively more expensive for investors holding other currencies. While the Consumer Price Index (CPI) figures largely met expectations, they imply that the Federal Open Market Committee (FOMC) is inclined to keep interest rates steady.

This expectation has provided a temporary support level for Silver. As the outlook for the Fed points towards maintaining rates both in September and potentially in November (with a 60% likelihood), investors are increasingly drawn to higher-yielding assets such as U.S. Treasury bonds, diverting their attention away from zero-interest Silver.

Shifting Investor Concerns from Inflation to Opportunity Costs

Investors are now primarily concerned about the opportunity costs associated with holding Silver in an environment of rising interest rates. The focus is shifting from inflation worries to the implications of keeping a non-interest-bearing asset like Silver amidst increasing interest rates.

All eyes are now on forthcoming economic data, including U.S. August producer prices and retail sales figures, along with the European Central Bank’s interest rate decision. These events precede the highly anticipated Fed policy announcement scheduled for September 20.

Bearish Pressure on Silver Due to Strong Dollar, Expected Fed Rate Pause, and Reduced Demand

In summary, Silver is currently facing bearish pressure driven by multiple factors, including the strength of the U.S. dollar, the prospect of a Federal Reserve rate pause, and a decline in demand as indicated by the reduced holdings of the SPDR Gold Trust. These combined factors challenge the appeal of Silver as a non-interest-bearing asset in an environment where interest rates are on the rise.

Technical Analysis

4-Hour Silver (XAG/USD)Spot Silver (XAG/USD) currently trades at $22.53, below the 200-4H moving average of $23.47 and 50-4H moving average of $23.23, indicating a bearish trend. The 14-4H RSI at 27.59 signals an oversold condition, reflecting weakened momentum.

The main support area lies between $22.70 and $22.28, while the main resistance zone ranges from $25.00 to $25.27. Presently, the price is inside the support zone but below resistance levels. This analysis suggests a bearish sentiment in the market. Traders should exercise caution, monitoring for potential reversals due to the oversold conditions.

US Stock Futures Rise Ahead of PPI Release

US Stock Futures Rise Ahead of PPI Release

US Stock Futures Rise Ahead of PPI Release

US stock futures climbed Thursday morning, with futures tied to the Dow Jones Industrial Average advancing by 77 points or 0.22%. This movement came in anticipation of the August producer price index (PPI), a crucial measure of wholesale inflation. Meanwhile, S&P 500 futures and Nasdaq 100 futures also saw modest increases, by 0.32% and 0.35%, respectively. This is despite the 30-stock Dow losing 0.2% during Wednesday’s session, primarily due to a decline in 3M shares. However, both the Nasdaq Composite and the S&P 500 managed to close in the green, up by nearly 0.3% and 0.1% respectively.

Impact of Recent CPI Readings on the Market

The August reading of the consumer price index (CPI) held immense significance for traders. The core CPI, which strips out food and energy, rose 0.3% from July and 4.3% YoY. These figures somewhat exceeded economists’ expectations, leading to heightened market speculations. The data fueled uncertainty regarding the Federal Reserve’s upcoming monetary decisions. The central bank’s stance on interest rates, influenced by economic indicators like inflation, has been the subject of keen observation. As it stands, there’s a 97% chance the rates will remain unchanged in the Fed’s September meeting. However, future sessions might see a shift, with a 40% possibility of a rate hike announcement in November.

Trading Derivatives carries a high level of risk to your capital and you should only trade with money you can afford to lose. Trading Derivatives may not be suitable for all investors, so please ensure that you fully understand the risks involved, and seek independent advice if necessary. A Product Disclosure Statement (PDS) can be obtained either from this website or on request from our offices and should be considered before entering into a transaction with us. Raw Spread accounts offer spreads from 0.0 pips with a commission charge of USD $3.50 per 100k traded. Standard account offer spreads from 1 pips with no additional commission charges. Spreads on CFD indices start at 0.4 points. The information on this site is not directed at residents in any country or jurisdiction where such distribution or use would be contrary to local law or regulation.


Treasuries and Further Economic Reports

U.S. Treasury yields remained largely unchanged as market participants pondered inflation’s trajectory after the recent CPI announcement. Specifically, the 10-year Treasury saw a minor increment to 4.2545%.

As we move forward, traders have their eyes on the imminent release of the PPI, expected to rise by 0.4%, slightly outpacing July’s 0.3% gain. Upcoming retail sales figures and Friday’s consumer sentiment report will also play a crucial role in shaping market sentiment.

Global Market Movements

On the global front, shares of Japanese holding giant Softbank experienced a dip after its subsidiary, Arm, announced its IPO pricing at $51 per share. This IPO values Arm, set to trade on the Nasdaq, at an impressive fully diluted market capitalization of over $54 billion. Softbank is expected to retain control of approximately 90% of Arm’s outstanding shares.

Short-Term Forecast: Bullish with Volatility

While the central bank might hold steady on rates for now, markets will likely see increased volatility. Futures data suggests a near-even split on the possibility of a rate increase in November. This uncertainty, combined with other economic indicators, makes a bullish short-term forecast with a side of volatility through year-end highly probable. Assets that have pushed the market up this year might soon appear overvalued in light of rising yields.

Australian Unemployment Holds Steady at 3.7% Despite China’s Economic Woes

Australian Unemployment Holds Steady at 3.7% Despite China’s Economic Woes

Australian Employment

Employment figures from Australia remained a focal point following the RBA decision to leave the cash rate unchanged.

The Australian unemployment rate remained unchanged at 3.7% in August.

According to the ABS,

  • The participation rate increased to 67.0%, while monthly hours worked decreased.
  • Employment jumped by 63.9k while full employment rose by a modest 2.8k.

The latest figures showed that labor market conditions steadied after a rocky July. In July, full employment slid by 18.7k. As a result, the Australian unemployment rate increased from 3.5% to 3.7%.

Weaker labor market conditions impact consumer spending and service sector activity. Final goods consumption and services account for 70% of the Australian economy. A continued uptrend in unemployment would reduce consumption and impact service sector activity, leaving the Australian economy exposed to the risk of a recession.

Significantly, China’s economic woes have had a limited impact on Australian labor market conditions. China accounts for one-third of Australian exports. With the Australian trade-to-GDP ratio at about 50, trade accounts for 20% of Australian jobs.

AUD to USD Reaction to the Employment Report

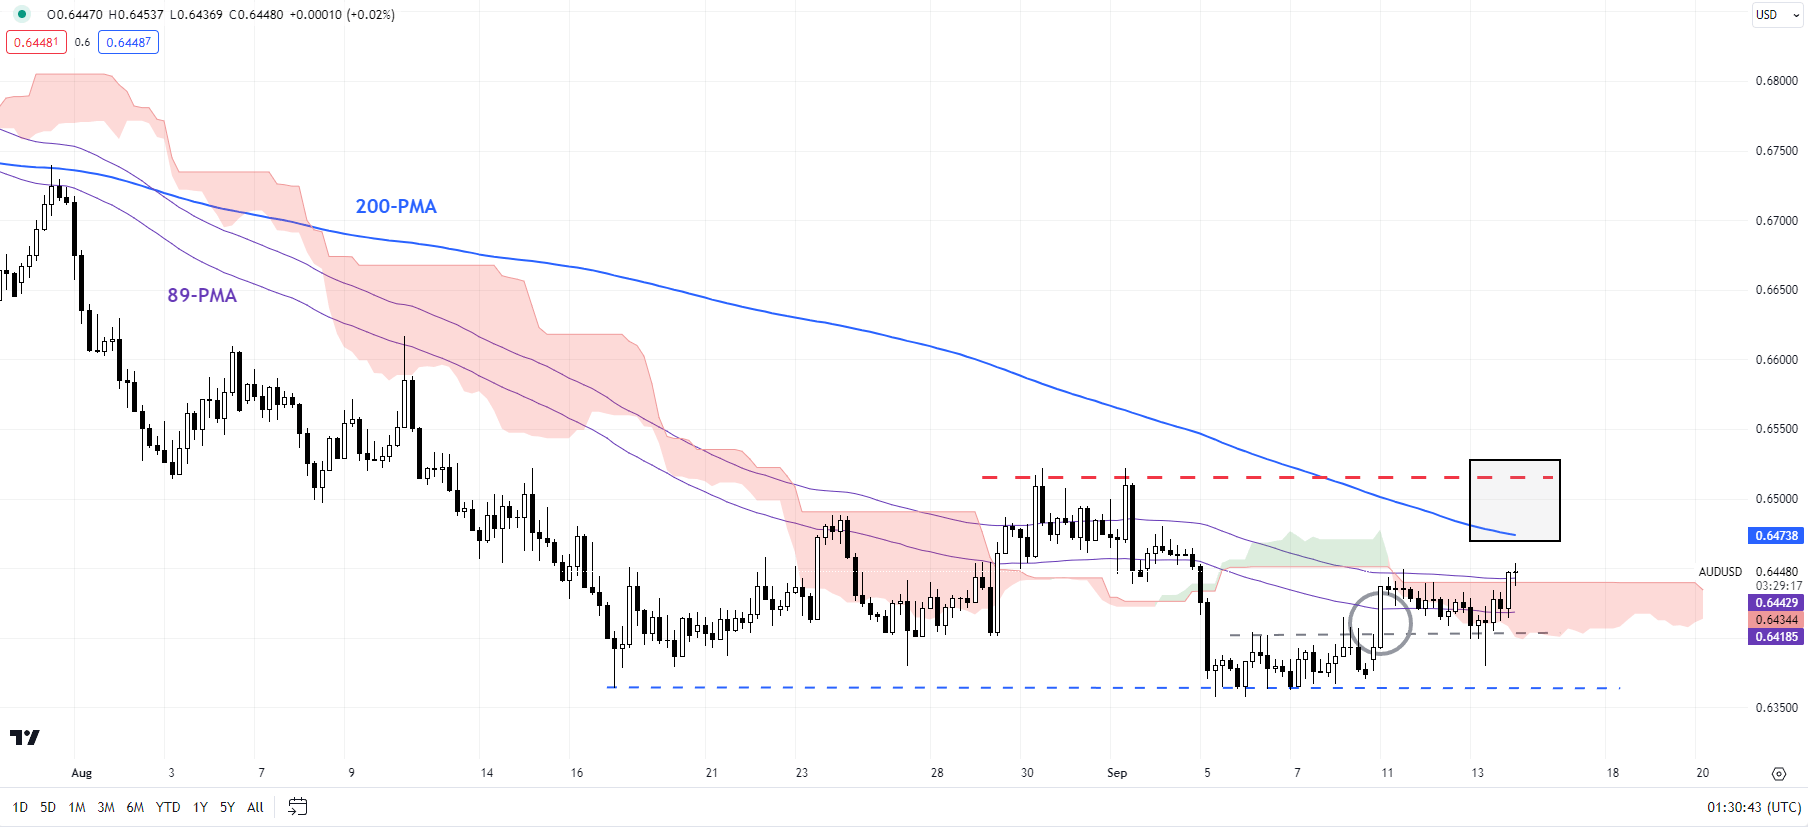
Before the employment numbers, the AUD/USD fell to a low of $0.64139 before surging to a pre-stat high of $0.64489.

However, in response to the employment report, the AUD/USD jumped to a post-stat high of 0.64537 before falling to a low of $0.64337.

This morning, the AUD/USD was up 0.27% to $0.64386.

AUD/USD responds to Australian employment report.
140923 AUDUSD 3 Minute Chart

Next Up

Economic indicators from the US could retest investor conviction on a Fed pause on interest rate hikes.

US producer prices, jobless claims, and retail sales figures will draw interest. A pickup in producer prices, steady labor market conditions, and a jump in retail sales could signal the need for more tightening to curb demand-driven inflation.

However, the numbers need to be better than expected to shift bets on the Fed after the recent US CPI Report.

British Pound Stabilizes as Retail Traders Slowly Increase Bearish GBP/USD Exposure

British Pound Stabilizes as Retail Traders Slowly Increase Bearish GBP/USD Exposure

The British Pound has been marking time in recent weeks, pausing a slow and steady decline against the US Dollar since July. That said, retail traders are increasing downside exposure of late. This can be seen by looking at IG Client Sentiment (IGCS), which often functions as a contrarian indicator. With that in mind, will Sterling reverse higher?

GBP/USD Sentiment Outlook – Bullish

The IGCS gauge shows that about 62% of retail traders are net-long GBP/USD. Since most of them are biased to the upside, this still hints that prices may continue falling down the road. But, downside exposure has increased by 5.22% and 9.71% compared to yesterday and last week, respectively. With that in mind, recent changes in exposure are hinting that prices may soon reverse higher.

British Pound Daily Chart

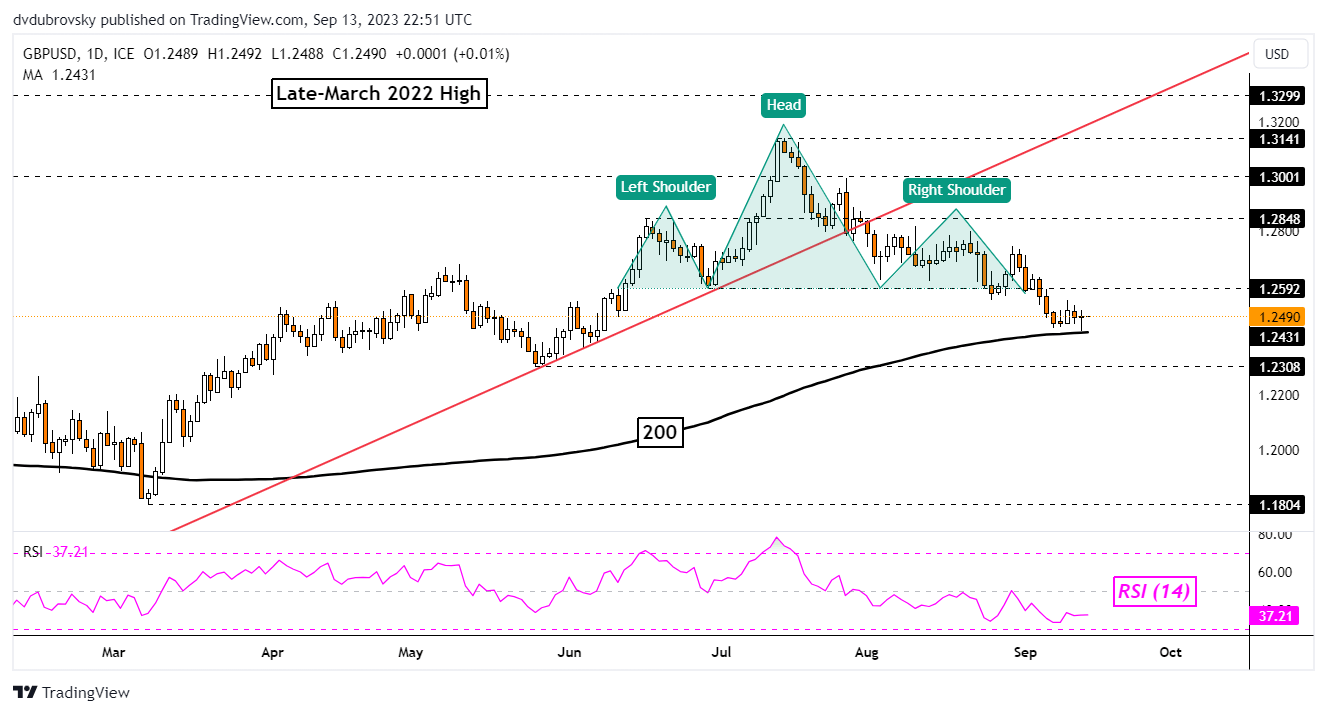
On the daily chart, GBP/USD remains technically biased lower in the aftermath of confirming a breakout under a bearish Head & Shoulders chart formation. But, since then, prices have been stabilizing around the 200-day Moving Average. The latter is thus maintaining the dominant upside focus.

A turn higher from here would place the focus on the neckline of the chart formation around 1.2592. Confirming a breakout above this point would undermine the Head & Shoulders, exposing the left shoulder around 1.2848.

Otherwise, breaking under the 200-day MA exposes the May low of 1.2308 as subsequent support.

image2.png

Chart Created in Trading View

Euro Technical Outlook – Trends Versus Ranges for EUR/USD, EUR/JPY and EUR/GBP

Euro Technical Outlook – Trends Versus Ranges for EUR/USD, EUR/JPY and EUR/GBP

EUR/USD TECHNICAL ANALYSIS

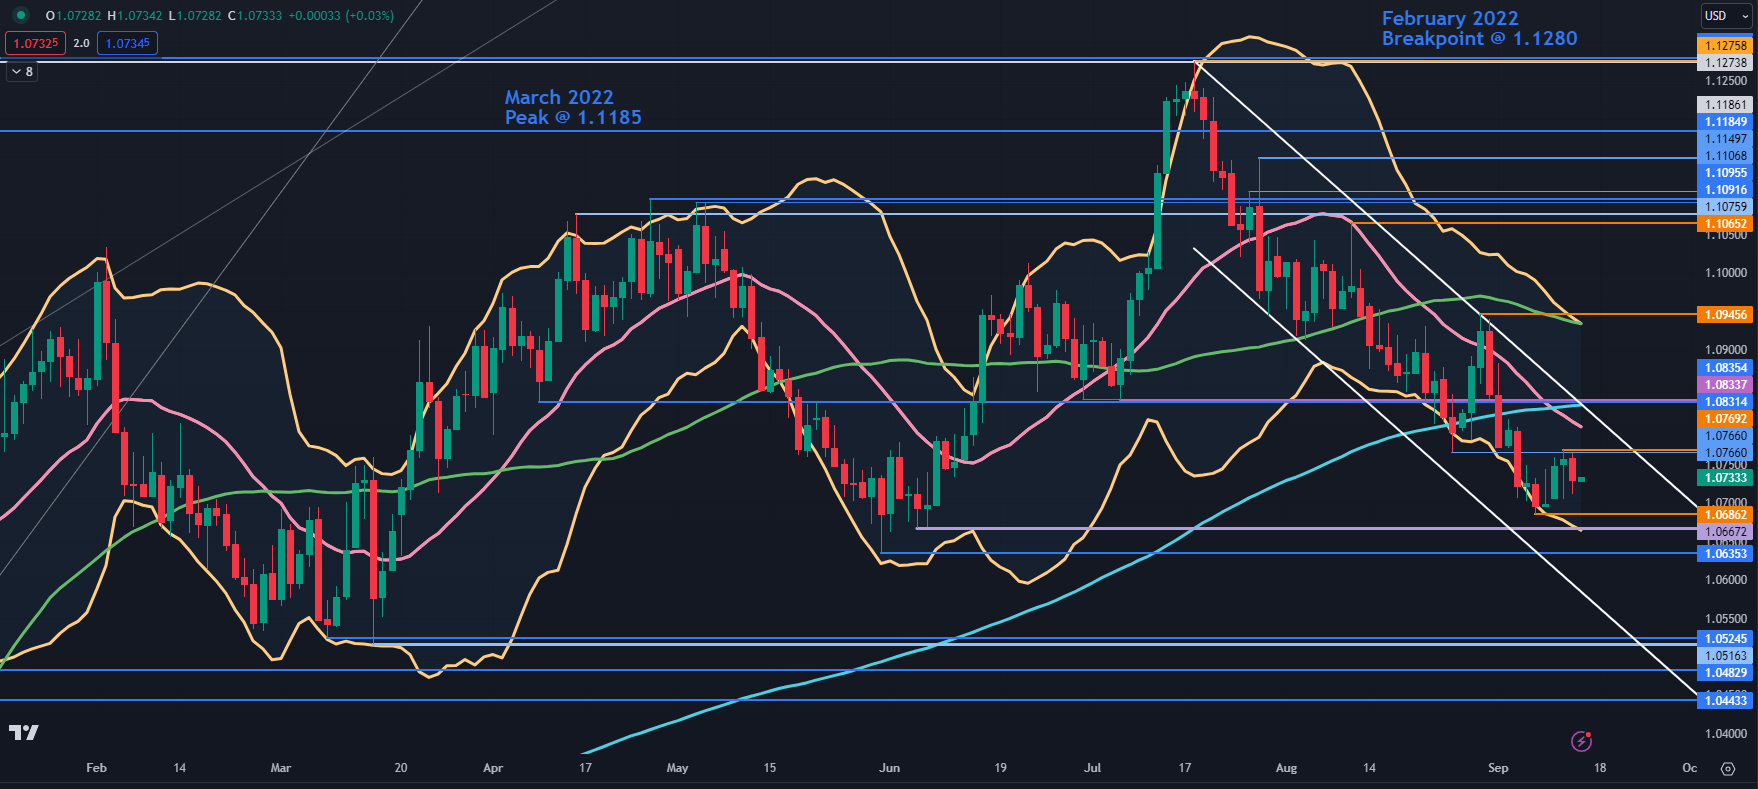
EUR/USD has consolidated this week after making a 3-month low last Thursday.

The close on that day was below the lower band of the 21-day Simple Moving Average (SMA) based Bollinger Band.

The day after, it closed back inside the band. This might technically signal a pause in the bearish run or a potential reversal.

Conversely, the price remains in a descending trend channel that emerged after making a peak in July at 1.1276 which was among two breakpoints of 1.1273 and 1.1280. This might set up the 1.1270 – 1.1280 area as a resistance zone.

With these conflicting signals in mind, the recent retreat from pushing lower might confirm the range trading environment for EUR/USD. It has traded between 1.0516 and 1.1276 since the beginning of 2023.

Nearby resistance could be at Tuesday’s high near 1.0770, which also has a breakpoint nearby. Above there, a series of breakpoints in the 1.0530 – 1.0835 area and the 200-day SMA may offer resistance.

Further up, the prior peak at 1.0945 and the 55-day SMA nearby, could offer resistance ahead of a cluster zone of breakpoints and recent highs in the 1.1065 – 1.1105 area.

On the downside, support may lie at the prior lows of 1.0686, 1.0667, 1.0635, 1.0525, 1.0483 and 1.0443.

EUR/USD DAILY CHART

image1.png

EUR/JPY TECHNICAL ANALYSIS

EUR/JPY appears to have rejected a move lower on Monday when it traded down to 159.58.

That dip broke below two previous lows and the 55-day Simple Moving Average (SMA) before closing back above all of them at the end of the session.

The sell-off could be interpreted as a stop-loss take-out rather than an emerging bear market. In any case, the ascending trend line remains intact, and a near-term range trade pattern seems to be unfolding.

Support could be in the 156.60 – 157.00 area ahead of the trend line, currently near 156.10. Support might be at the breakpoint at 153.45 and below there, the breakpoints at 151.61 and 151.07 as well as the recent low at 151.41 may also lend support.

On the topside, potential resistance might be at the prior peaks of 159.49 and 159.76.

EUR/JPY remains above an ascending line and the bullish trend might be intact for now. To learn more about trend trading, click on the banner below.

A bullish triple moving average (TMA) formation requires the price to be above the near-term simple moving average (SMA), the latter to be above the medium-term SMA and the medium-term SMA to be above the long-term SMA. All SMAs also need to have a positive gradient.

Looking at the 55-, 100- and 200-day SMAs, the criteria for a TMA have been met, which may suggest that bullish momentum is evolving.

EUR/JPY DAILY CHART

image2.png

EUR/GBP TECHNICAL ANALYSIS

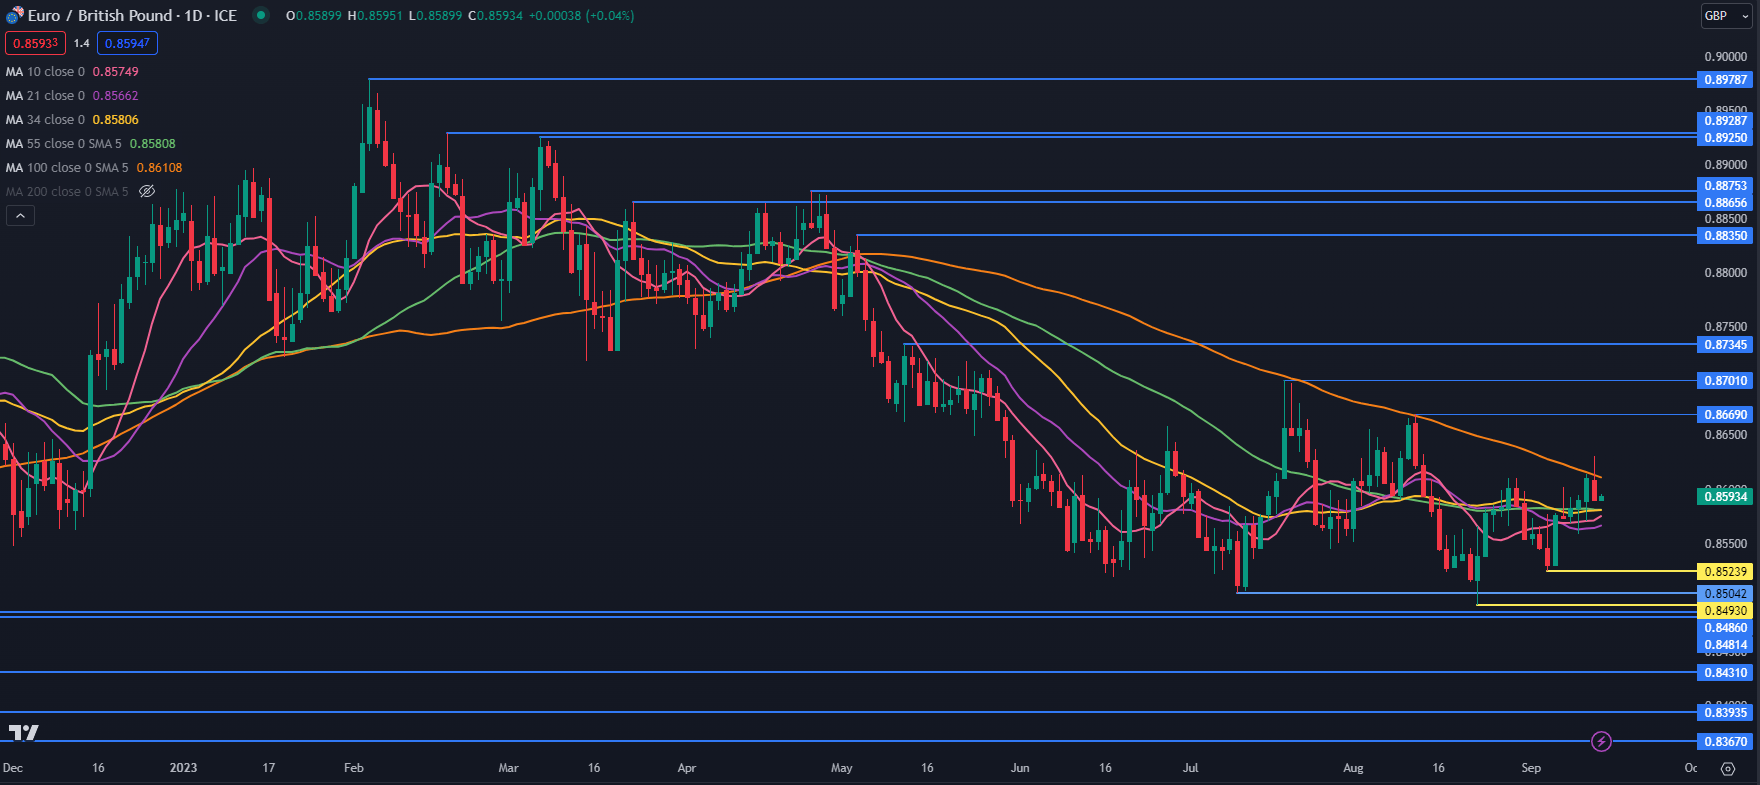
EUR/GBP has traded between 0.8493 and 0.8701 for 4 months in what appears to be a range trading environment.

The 10-, 21-, 34-, 55- and 100-day SMAs are all grouped together between 0.8566 and 0.8611, which may confirm a lack of direction for EUR/GBP.

If either side of that range is penetrated, a breakout trade opportunity may evolve. To learn more about breakout trading, click on the banner below.

Support might be at the prior lows and breakpoints of 0.8524, 0.8504, 0.8493, 0.8486 and 0.8481.

On the upside, resistance could be at the 100-day SMA which is currently near 0.8611. It held on two occasions in July and August but was briefly breached yesterday before tumbling back below it.

Further up, resistance might be at the previous peaks at 0.8669, 0.8701 and 0.8735.

EUR/GBP DAILY CHART

image3.png

Australian Dollar Holds Early Gains After Jobs Beat; Is AUD/USD Forming a Base?

Australian Dollar Holds Early Gains After Jobs Beat; Is AUD/USD Forming a Base?

The Australian dollar held early Asia gains against the US dollar after the Australian economy created more jobs than expected last month.

The Australian economy created 64.9k jobs in August, compared with forecasts for a gain of 23k, following job losses in July. The unemployment rate remained flat at 3.7%, in line with expectations, just off five-decade lows. The solid jobs number was almost entirely due to part-time employment gains (62.1k), prompting a slight retreat in AUD/USD. Full-time employment rose 2.8k following losses of 24.2k in July.

AUD/USD 5-minute Chart

image1.png

The Australian jobs market is showing signs of cooling, reducing the urgency to tighten further. Recent Australian data, including GDP, composite, and services PMI, have been encouraging, coming in higher than previous readings.However, the Economic Surprise Index for Australia suggests the data have broadly been underwhelming. Wednesday’s jobs data does little to alter the broader expectations of RBA remaining on hold next month. Market pricing suggests a small possibility of a rate hike in November.

With the broader US inflation trajectory still pointing down, albeit gradually, US Federal Reserve rate expectations remained largely anchored around one more hike in November (about 40% chance) before rate cuts beginning mid-2024. US CPI rose by 3.7% on-year last month, against expectations of 3.6%, well above 3.2% in July. However, core inflation eased to 4.3% on-year from 4.7% previously.

AUD/USD 240-Minute Chart

image2.png

While the rates outlook for both economies remains similar until the year-end, the outperformance of the US economy has pushed up USD globally. In contrast, the outlook for the Australian economy has been deteriorating since the last year. Much would depend on the outlook on the Chinese demand, Australia’s largest export destination. Beijing has announced a spate of support measures/stimulus measures in recent weeks to cushion some of the downside risks, but those measures have yet to translate into an improved outlook for the economy.

AUD/USD Weekly Chart

image3.png

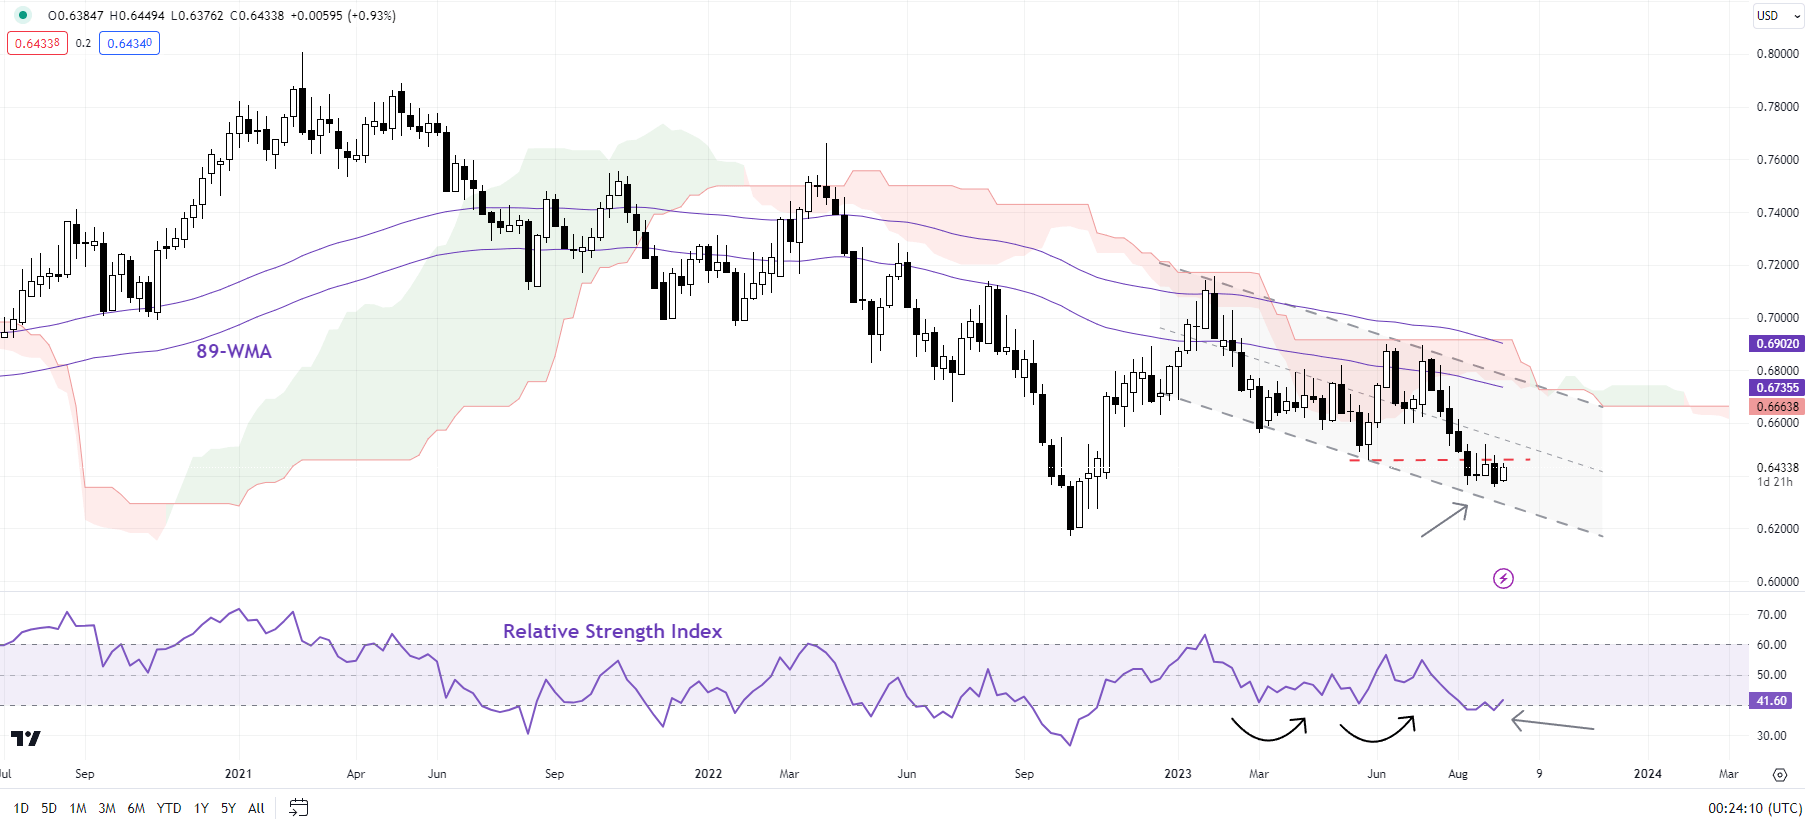
Meanwhile, on technical charts, AUD/USD looks oversold as speculative short AUD positioning is at the highest levels since early 2022. The hold in recent weeks around 0.6350, coinciding with the lower edge of a declining channel since March suggests AUD/USD is attempting to form an interim base. This is reinforced by developments on higher timeframe charts – the 14-week Relative Strength Index is near the 40-level, which was associated with a rebound on two occasions in H1-2023.

The rise earlier this week above 0.6400 is an encouraging sign for bulls. Any break above the end-August high of 0.6525 would trigger a minor double bottom (the August and September lows), pointing to gains toward 0.6700.

XAU/USD Price Forecast: US PPI & Retail Sales Could Push Gold to $1900

XAU/USD Price Forecast: US PPI & Retail Sales Could Push Gold to $1900

XAU/USD FUNDAMENTAL BACKDROP

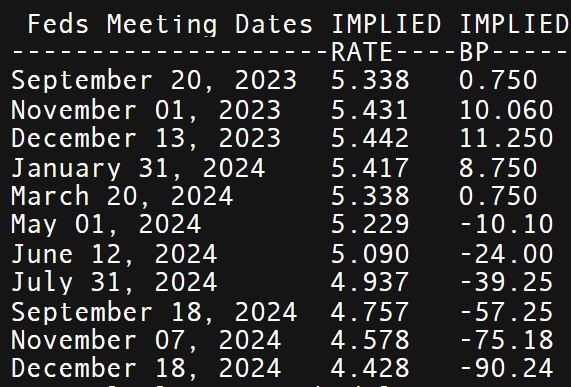
Gold prices remain under pressure this Thursday after yesterday’s US CPI report showed elevated headline inflation despite a softer core inflation read. This translates through to sustained tight monetary policy by the Federal Reserve. Energy was the primary contributor to the higher headline figure and with crude oil prices expected to remain buoyant, the ‘higher for longer’ narrative is gaining traction. There may not be any additional rate hikes but rate cuts could be pushed back. If we look at money market pricing below, markets expect a rate cut around June 2024 but with data dependency holding sway over the Fed, this could easily change.

IMPLIED FED FUNDS FUTURES

image1.png

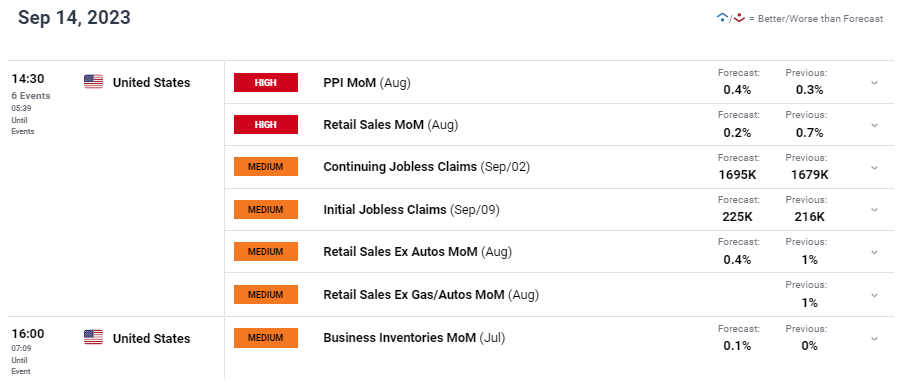
Later today, gold traders will look to US PPI, jobless claims and retail sales (see economic calendar below) for guidance. Initial jobless claims has been on a downward trajectory recently thus highlighting the robust US labor market and adding to hawkish bets. Should this be the case alongside higher PPI, gold could breakdown further. It is important to remember that PPI is known as a leading indicator for CPI as a rise in producer costs tend to transfer over to the consumer.

GOLD ECONOMIC CALENDAR

image2.png

TECHNICAL ANALYSIS

GOLD PRICE DAILY CHART

image3.png

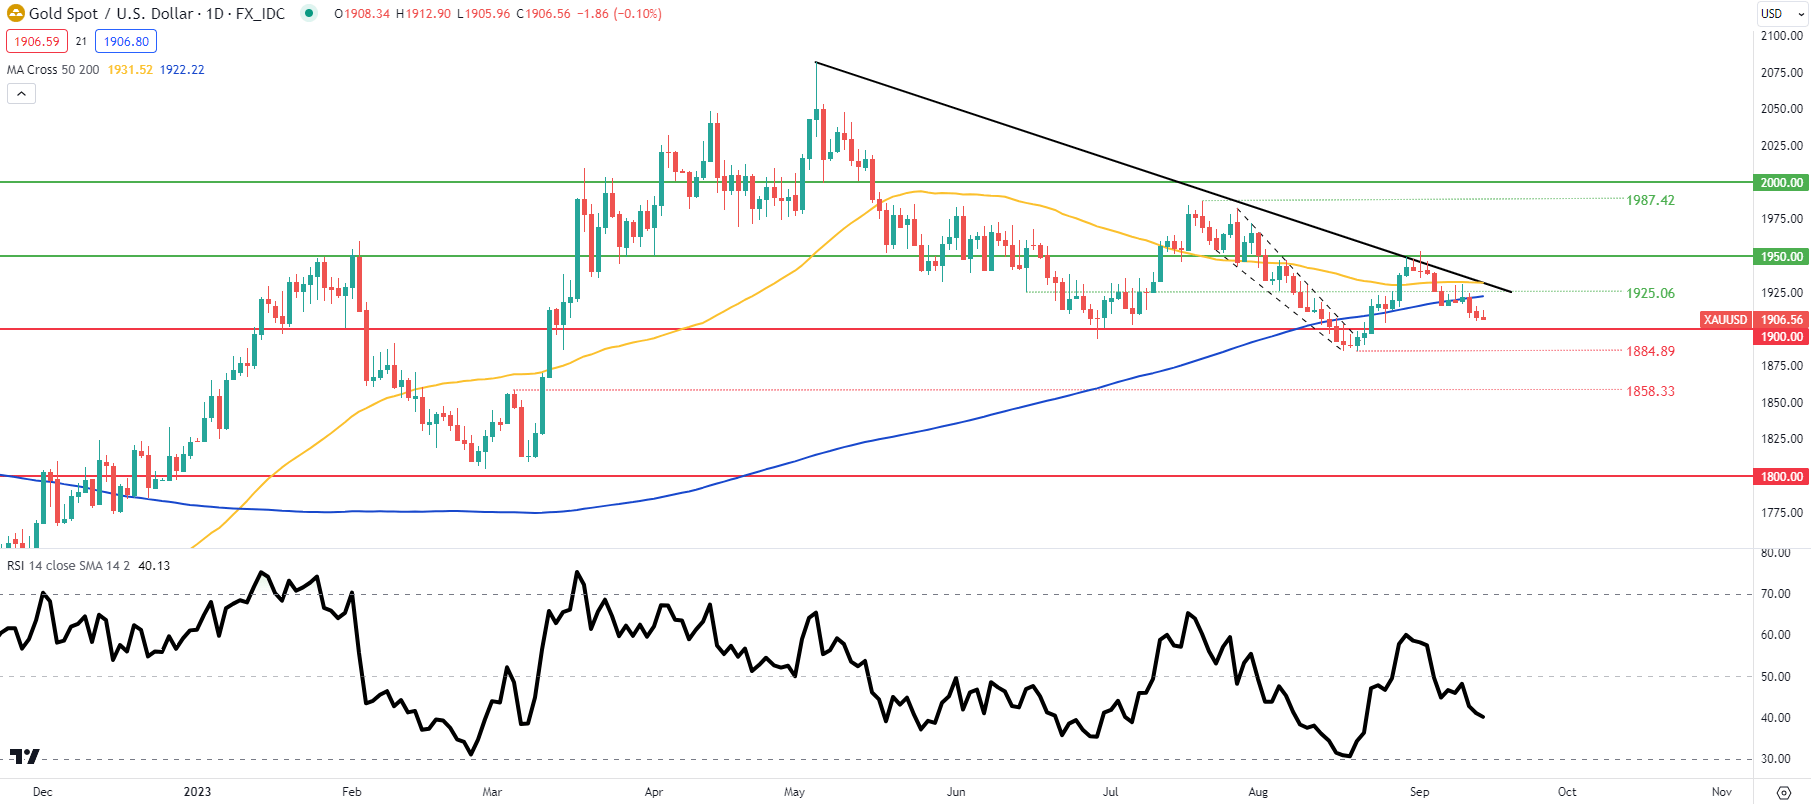
Daily XAU/USD price action is now trading below both the 50-day and 200-day (blue) moving averages respectively. This bearish momentum (augmented by the Relative Strength Index (RSI)) brings into consideration the 1900.00 psychological support level. Strong US data and sticky PPI numbers could result in a retest of this support zone.

Australian Dollar Holds Early Gains After Jobs Beat; Is AUD/USD Forming a Base?

Australian Dollar Holds Early Gains After Jobs Beat; Is AUD/USD Forming a Base?

The Australian dollar held early Asia gains against the US dollar after the Australian economy created more jobs than expected last month.

The Australian economy created 64.9k jobs in August, compared with forecasts for a gain of 23k, following job losses in July. The unemployment rate remained flat at 3.7%, in line with expectations, just off five-decade lows. The solid jobs number was almost entirely due to part-time employment gains (62.1k), prompting a slight retreat in AUD/USD. Full-time employment rose 2.8k following losses of 24.2k in July.

AUD/USD 5-minute Chart

image1.png

The Australian jobs market is showing signs of cooling, reducing the urgency to tighten further. Recent Australian data, including GDP, composite, and services PMI, have been encouraging, coming in higher than previous readings.However, the Economic Surprise Index for Australia suggests the data have broadly been underwhelming. Wednesday’s jobs data does little to alter the broader expectations of RBA remaining on hold next month. Market pricing suggests a small possibility of a rate hike in November.

With the broader US inflation trajectory still pointing down, albeit gradually, US Federal Reserve rate expectations remained largely anchored around one more hike in November (about 40% chance) before rate cuts beginning mid-2024. US CPI rose by 3.7% on-year last month, against expectations of 3.6%, well above 3.2% in July. However, core inflation eased to 4.3% on-year from 4.7% previously.

AUD/USD 240-Minute Chart

image2.png

While the rates outlook for both economies remains similar until the year-end, the outperformance of the US economy has pushed up USD globally. In contrast, the outlook for the Australian economy has been deteriorating since the last year. Much would depend on the outlook on the Chinese demand, Australia’s largest export destination. Beijing has announced a spate of support measures/stimulus measures in recent weeks to cushion some of the downside risks, but those measures have yet to translate into an improved outlook for the economy.

AUD/USD Weekly Chart

image3.png

Meanwhile, on technical charts, AUD/USD looks oversold as speculative short AUD positioning is at the highest levels since early 2022. The hold in recent weeks around 0.6350, coinciding with the lower edge of a declining channel since March suggests AUD/USD is attempting to form an interim base. This is reinforced by developments on higher timeframe charts – the 14-week Relative Strength Index is near the 40-level, which was associated with a rebound on two occasions in H1-2023.

The rise earlier this week above 0.6400 is an encouraging sign for bulls. Any break above the end-August high of 0.6525 would trigger a minor double bottom (the August and September lows), pointing to gains toward 0.6700.

The Mystery of Bearish Engulfings: Do they Reliably Predict Forex Price Reversals?

The Mystery of Bearish Engulfings: Do they Reliably Predict Forex Price Reversals?

A Bearish Engulfing (BE) is a candlestick pattern that can be identified when looking at virtually any financial trading instrument. All you need is an opening, high, low and closing price. As implied by the name, technicalists will often use these as signals that an upward-trending market might be readying to reverse. But as you might have heard past performance is not always indicative of future results.

This is not a report about the intricacies of Bearish Engulfings: which you may learn more about here. Rather, the purpose of this educational content is to test their effectiveness using price and price alone. This will come from the foreign exchange market (forex). At the end of the article, I will go over the key takeaways and some of the limitations of this study. In the meantime, let us set some ground rules.

Identifying Bearish Engulfings – EUR/USD, GBP/USD, USD/JPY, AUD/USD, USD/CAD

Almost 37,000 candles were analyzed between EUR/USD, GBP/USD, USD/JPY, AUD/USD and USD/CAD using daily data since 1995 from TradingView. One of the reasons why I chose the foreign exchange market is because of its unparalleled liquidity, especially amongst the major pairs. This helps produce smoother price action compared to other markets, such as stocks and cryptocurrencies.

How did I identify Bearish Engulfings? It was based on a set of rules I coded to search over each candle to recognize if it was valid. For this study, I focused on a near-term horizon, which translates to 20 days before and after an engulfing. In total, there are too many rules to go over. Instead, let us look at some of the most important ones:

Bearish Engulfing Detection Rules

  1. The Bearish Engulfing body must meet a minimum size requirement, it cannot be too small
  2. The body of the candle before the BE (the pre-candle) cannot be too small relative to the BE body
  3. Rather than the pre-candle low, the BE must close under the pre-candle open
  4. Before the BE, there must be the appearance of an uptrend (no downtrends or flat price action)
  5. The pre-candle close must also be a 20-day high close, with some cautious room for error

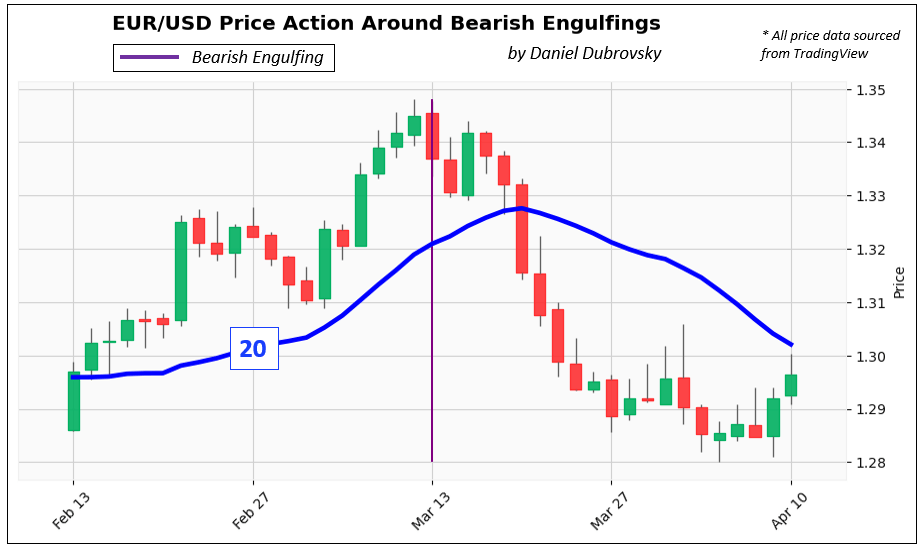
Limitations to these rules and subjectivity will be discussed at the end of this report. In the meantime, the chart below is an example of a detected EUR/USD Bearish Engulfing pulled on March 13th, 2005. This serves as an example of a clean one. Notice how the price was trending higher before the BE and the pre-candle close was a 20-day high close. After the BE, the price turned lower as one would expect.

In total, the code detected slightly over 200 Bearish Engulfings from a possible almost 37,000 candles. Of course, not all of them were as clean as the one below. If you would like to watch how some of the other cases appeared, I highly encourage you to check out this link to a Twitter thread I made that displays some of the Bearish Engulfings in each pair.

Identifying Bearish Engulfings – EUR/USD

37,000 Candles, Over 200 Bearish Engulfings, How Do the Trends Look Like?

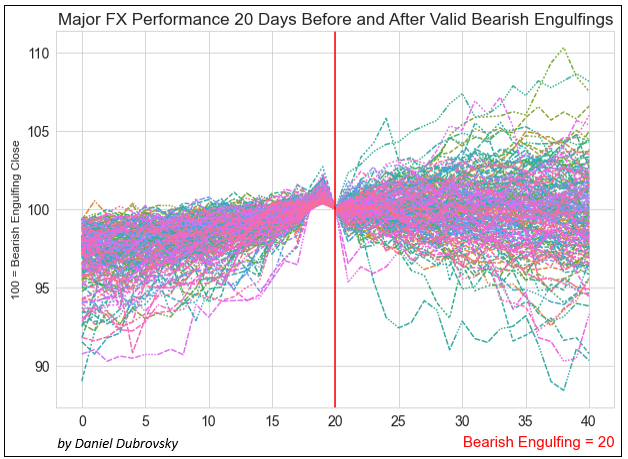
Below is a chart that plots each Bearish Engulfing trend 20 days before and after its appearance. To make sure that every trend was in the same scale range, each BE (close) was indexed to 100 as a starting point.

In the period leading into the BE, you can see how the trends were rising with a consistent pattern and range. Then, the day before the BE was always the peak. This is what creates the dip into the BE, which represents the close under the pre-candle.

What happens after the Bearish Engulfing? The trends continue for 20 days and with each passing period, spread out in a cone or triangle-like fashion. The right side also exhibits a larger dispersion of prices (variance) than the left, with a wide range of peaks and troughs. At first glance, this speaks to randomness and pours cold water on the idea of Bearish Engulfings as consistent reversal signals. But we need to take a closer look.

37,000 Candles, Over 200 Bearish Engulfings, How Do the Trends Look Like?

How Does the Average Bearish Engulfing Trend Look Like?

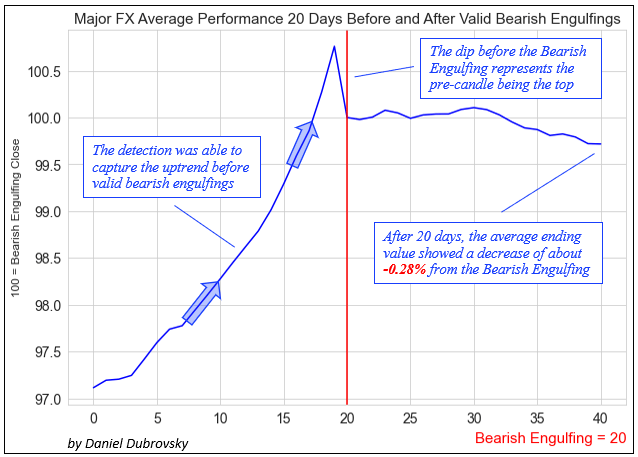
That is where the next chart comes in, which is the average Bearish Engulfing trend. This visualization confirms that the code was able to consistently capture the uptrend before the BE. Just like with the previous chart, you can see the top right before the BE before the price fell to 100, representing the dip into the engulfing. After the engulfing, prices continued lower, finishing -0.28% on average 20 days after the BE. So, it appears that there is a slight downward bias in the post-BE trend. I would argue that this is not the most important takeaway from this analysis.

How Does the Average Bearish Engulfing Trend Look Like?

Bearish Engulfings: Reversal or Topping Signal?

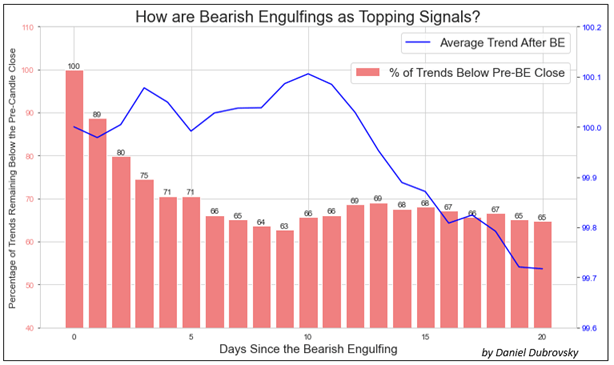
The last chart overlays the average Bearish Engulfing series, with the percentage of trends that closed below the pre-candle for each day. For example: after 5 days, 71% of trends remained below the pre-candle close. After 10 days, this number shrank to 66%, then rose to 68% on the 15th day and finally ending at 65% on the 20th day. In other words, on average, about two-thirds (2/3) of trends remained below the top after one month.

Here is a fun fact: after 20 days, the ending price observations created a statistically significant normal distribution. This means we can alternatively use a Cumulative Distribution Function (CDF) to calculate the probability of a series in this sample finishing below the top. And just like with the results mentioned earlier, that clocks in at roughly 65% as well.

Bearish Engulfings: Reversal or Topping Signal?

What’s the Verdict on Bearish Engulfings?

After analyzing almost 37,000 candles between EUR/USD, GBP/USD, USD/JPY, AUD/USD and USD/CAD, identifying at least 200 Bearish Engulfings, it seems that this candlestick pattern functions better as a topping signal than a reversal one. While the average trend finished almost -0.3% after 20 days, 2/3 of them remained below the top. In other words, if we can identify valid Bearish Engulfings in this market, it might be worth paying attention to. But, let us go over some study limitations.

Study Limitations

While Bearish Engulfings can be observed universally between markets, understand that a specific subset of the forex market was analyzed for this study, and it might be the most relevant to the pairs studied. Furthermore, this is based on a sample of a little over 200 Bearish Engulfings. More might be needed to enhance the validity of this study, (or even disprove it).

As much as I tried to keep this study as objective as possible, there is some inherent subjectiveness in technical analysis. For example, while most people can universally agree on the dimensions of a Bearish Engulfing and how they appear, the background in which they form is more fluid. In this sample, I considered if the BE closed under the pre-candle open and not the pre-candle low. Some may debate that the latter is more proper.

Another important factor is the timeframe. This was conducted on daily data, but you could theoretically analyze different layers of time horizons. That also includes the duration you measure before and after the engulfing. This study was focused on near-term price action, but you could also analyze broader trends, such as 40 days before and after the Bearish Engulfing.