DAX Index: Losing Streak Ends, But What’s Next for the DAX 30 Landscape?

DAX Index: Losing Streak Ends, But What’s Next for the DAX 30 Landscape?

DAX Ends a Five-Day Losing Streak

On Friday, the DAX ended a five-day losing streak, gaining 0.14%. Reversing a 0.14% loss from Thursday, the DAX ended the week down 0.63% to 15,740.

German Inflation Leaves the ECB in a Predicament

On Friday, finalized German inflation figures for August aligned with preliminary numbers. The annual inflation rate softened modestly from 6.2% to 6.1%. Significantly, the harmonized inflation rate eased from 6.5% to 6.4%. Sticky inflation remains a concern for the ECB.

Trading Derivatives carries a high level of risk to your capital and you should only trade with money you can afford to lose. Trading Derivatives may not be suitable for all investors, so please ensure that you fully understand the risks involved, and seek independent advice if necessary. A Product Disclosure Statement (PDS) can be obtained either from this website or on request from our offices and should be considered before entering into a transaction with us. Raw Spread accounts offer spreads from 0.0 pips with a commission charge of USD $3.50 per 100k traded. Standard account offer spreads from 1 pips with no additional commission charges. Spreads on CFD indices start at 0.4 points. The information on this site is not directed at residents in any country or jurisdiction where such distribution or use would be contrary to local law or regulation.

However, economic indicators from Germany have flashed recessionary signals, forcing the ECB to rethink its policy goals to tame inflation. Investors expect a German and Eurozone recessions after considering the latest stats. While concerns over the Chinese economy and Fed rate hikes remained headwinds, easing bets on an ECB rate hike provided support.

Fed Vice-Chair Williams Comments Resonate

US economic indicators exceeded expectations in the week. However, uncertainty lingers about Fed policy goals and whether the US economy can keep expanding.

On Thursday, influential Fed Vice-Chair John Williams projected a US unemployment rate above 4.0%. The Vice-Chair avoided the topic of rate hikes but highlighted that the Fed has monetary policy in the right place, leaving the data to influence interest rate future decisions.

There were no comments to suggest a September move, supporting modest gains for the Friday session.

The Friday Market Movers

Zalando tumbled by 5.14%. The German online retailer sat at the bottom of the DAX, with investors fretting over the possible effects of a Eurozone-wide recession on company earnings.

However, banks and autos were among the front runners, with dip buyers providing support. Commerzbank and Deutsche Bank saw gains of 1.82% and 0.71%, respectively. Volkswagen led the auto sector, gaining 1.23%

Today’s Session

Italian industrial production numbers for July will draw interest early in the session. Following the weak numbers from Germany, another gloomy report would test buyer appetite. Economists expect production to fall by 1.7% versus a 0.8% decline in June.

For the European auto sector, vehicle sales from China will influence investor sentiment toward demand. Economists forecast a 2.0% rise in vehicle sales year-over-year in August, recovering from a 1.4% decline in July.

The DAX Futures was up 1 point this morning.

US Inflation in the Spotlight

With the markets betting on a Fed pause on raising interest rates this month, inflation figures will influence bets on Fed policy.

This afternoon, US Consumer Inflation Expectation figures for August need consideration. Economists forecast Consumer Inflation Expectations to soften from 3.5% to 3.4%. Softer numbers would support bets on the Fed to leave interest rates unchanged this month.

However, US inflation numbers on Wednesday will have more impact on Fed policy goals. Economists forecast the US inflation rate to accelerate from 3.2% to 3.6% in August.

Short-Term Forecast

While the DAX Futures signals a steady open, euro area recessionary jitters and US inflation numbers will likely test buyer appetite over the near term.

DAX Technical Indicators

Daily Chart

The trend line held, preventing a sustained DAX break below it on Friday. A hold above the trend line would give the bulls a run at the 50-day EMA and 16,007 resistance level. However, the DAX would need upbeat stats from the Euro area and softer inflation numbers from the US to support a breakout session.

A DAX break below the trend line would bring the 15,663 support level and 15,500 into play. A larger-than-expected slide in Italian industrial production and hotter-than-expected US inflation numbers would bring 15,500 into view.

The 14-Daily RSI reading of 45.24 gives the DAX room to fall through the 15,663 support level before entering oversold territory.

DAX Daily Chart sends bearish near-term price signals.
DAX 110923 Daily Chart

4-Hourly Chart

The DAX continues to hover below the 50-day and 200-day EMAs, reaffirming bearish price signals. An unexpected rise in Italian industrial production would give the bulls a run at the 50-day EMA. However, gloomy numbers would bring the 15,663 support level into play. A break below the trend line would support a fall through the 15,663 support level to bring 15,500 into view.

Later in the session, US inflation numbers also need consideration.

The 46.08 RSI reading indicates the DAX can fall through the 15,663 support level before entering oversold territory.

4-Hourly Chart affirms bearish near-term price signals.
DAX 110923 4-Hourly Chart
USD to CAD Prices Forecast: Inflation Worries Dictate USD/CAD Movement Ahead of Crucial Data Release

USD to CAD Prices Forecast: Inflation Worries Dictate USD/CAD Movement Ahead of Crucial Data Release

USD to CAD Outlook Amid Inflation Concerns

Profit-Taking and Paused Yields

The USD to CAD exchange rate is on a descent for the second consecutive day, with the U.S. Dollar experiencing a mild setback. Investors appear to be pocketing profits in anticipation of the significant U.S. consumer inflation announcement scheduled for Wednesday. Additionally, a halt in the upward trajectory of Treasury yields is also influencing trading behavior. Presently, as of 08:27 GMT, the USD/CAD stands at 1.3606, marking a decrease by 0.0034 or -0.25%.

Loonie’s Recent Weakness and BoC’s Stance

Recently, the Canadian dollar, often referred to as the loonie, hit a five-month low when juxtaposed with its U.S. counterpart. This depreciation was a direct result of the Bank of Canada maintaining its interest rates, compounded by surprising robustness in the U.S. services sector, which strengthened the U.S. Dollar. The Bank of Canada’s neutral statement caused ripples in the market, highlighting potential concerns regarding inflation. Despite these undercurrents, a majority feel that the bank’s cycle of rate hikes has reached its culmination. The Canadian central bank has maintained its prime interest rate at 5%, acknowledging an era of subdued growth.

Trading Derivatives carries a high level of risk to your capital and you should only trade with money you can afford to lose. Trading Derivatives may not be suitable for all investors, so please ensure that you fully understand the risks involved, and seek independent advice if necessary. A Product Disclosure Statement (PDS) can be obtained either from this website or on request from our offices and should be considered before entering into a transaction with us. Raw Spread accounts offer spreads from 0.0 pips with a commission charge of USD $3.50 per 100k traded. Standard account offer spreads from 1 pips with no additional commission charges. Spreads on CFD indices start at 0.4 points. The information on this site is not directed at residents in any country or jurisdiction where such distribution or use would be contrary to local law or regulation.

Anticipated U.S. Inflation Data

A focal point for investors this week is the U.S. consumer price data. A significantly high figure could stoke concerns of prolonged higher interest rates or the possibility of steeper rate hikes in the near future. This could spur investors to retain their U.S. Dollar holdings.

Further, readings on the producer price index and retail sales are on the radar for those attempting to gauge upcoming Fed policies. The prevalent sentiment is that the U.S. central bank will sustain its benchmark rates during its September 20th session. However, market indicators also suggest an increasing likelihood, currently pegged at 44%, of a rate surge in the Fed’s November meeting.

Inflation Indicators on the Horizon

Wednesday is crucial as it marks the release of the August Consumer Price Index (CPI) report by the United States Bureau of Labor Statistics. All eyes are on this data, looking for definitive signs pertaining to inflationary trends. According to Morgan Stanley’s projections, core inflation for August is anticipated to hover close to 0.2%, nudged by rising energy prices, albeit slightly offset by expected disinflation in core goods.

Short-Term Forecast: Cautious Vigilance

Given the blend of the looming CPI report, coupled with the Bank of Canada’s recent actions and the Federal Reserve’s anticipated moves, markets are treading with a mix of anticipation and caution. Investors should be on the lookout for shifts in the U.S. Dollar’s position, hinging on the imminent inflation data.

Technical Analysis

4-Hour USD to CADThe current 4-hour price of 1.3600 is almost identical to the previous 4-hour price of 1.3601, showcasing negligible change. While it hovers slightly below the 50-4H moving average of 1.3602, it stands notably above the 200-4H moving average of 1.3474, hinting at a potential medium-term upward momentum. The 14-4H RSI at 41.18 is below the neutral zone, suggesting weakened momentum but not yet oversold.

The price is closely approaching the main resistance area (1.3612 to 1.3654) while staying well above the main support area (1.3508 to 1.3483). Based on this data, the current market sentiment leans slightly bullish.

Silver Prices Forecast: XAG/USD Climbs Amidst Dollar Downturn, CPI Anticipation

Silver Prices Forecast: XAG/USD Climbs Amidst Dollar Downturn, CPI Anticipation

Silver Prices and Dollar Retreat

Spot silver (XAG/USD) leapt by 0.61% to $23.09 per ounce on Monday, erasing a small portion of last week’s loss. U.S. silver futures weren’t far behind, climbing 0.85% to settle at $23.37. These gains were driven by a softer dollar, and the ascent may hold above the $22 mark if the U.S. currency continues its downturn.

Technical Barriers and Inflation Watch

The technical outlook suggests hurdles ahead for silver. Both the 50-4H and 200-4H moving averages pose resistance levels that need to be overcome for a sustained rally. Meanwhile, market analysts are closely watching U.S. inflation data due for release on Wednesday. The Consumer Price Index (CPI) figures could weigh heavily on the Federal Reserve’s next move on interest rates, adding another layer of volatility to the silver market.

Trading Derivatives carries a high level of risk to your capital and you should only trade with money you can afford to lose. Trading Derivatives may not be suitable for all investors, so please ensure that you fully understand the risks involved, and seek independent advice if necessary. A Product Disclosure Statement (PDS) can be obtained either from this website or on request from our offices and should be considered before entering into a transaction with us. Raw Spread accounts offer spreads from 0.0 pips with a commission charge of USD $3.50 per 100k traded. Standard account offer spreads from 1 pips with no additional commission charges. Spreads on CFD indices start at 0.4 points. The information on this site is not directed at residents in any country or jurisdiction where such distribution or use would be contrary to local law or regulation.

The Dollar’s Trajectory and Federal Reserve’s Policy

The dollar is displaying remarkable resilience, heading for its longest weekly winning streak since 2014, thanks mainly to robust U.S. economic data. This backdrop has kept silver traders on edge as they await the Federal Reserve’s policy decision on September 20, following U.S. inflation data due on September 13.

Safe Haven Appeal of Silver

Despite strong inflows into the dollar and U.S. Treasuries, silver remains an attractive safe haven for investors. If the Federal Reserve’s primary inflation gauge—the personal consumption expenditures price index—remains sticky, persistent inflation coupled with a potential economic slowdown could elevate silver’s status among other safe havens.

Short-Term Outlook

Traders currently see a 93% chance of the Federal Reserve holding rates steady this September and a 43% likelihood of a rate hike before 2024. Given the technical and fundamental landscape, the market sentiment for silver seems cautiously bullish over the long-run after experiencing a recent sell-off, hinging on upcoming U.S. inflation data and Federal Reserve policy decisions.

Technical Analysis

4-Hour Silver (XAG/USD)Spot Silver (XAG/USD) is currently trading at $23.11, closely aligning with its previous 4-hour price. When compared with key moving averages, it’s positioned below both the 200-4H MA ($23.61) and the 50-4H MA ($23.79), signaling potential bearish momentum. The 14-4H RSI stands at 40.18, suggesting a weakened momentum but not yet oversold territory.

Defining our boundaries, the primary support is set between $22.70 to $22.28, while the main resistance zone spans from $25.00 to $25.27. Given its positioning under both moving averages and the RSI’s inclination, the current market sentiment leans towards the bearish side.

US Inflation Reports: What They Mean for the Fed, Stocks, and Gold

US Inflation Reports: What They Mean for the Fed, Stocks, and Gold

Anticipation Builds Around Upcoming Inflation Reports

As Wall Street eagerly anticipates the latest inflation data releases, the focal points for analysts and investors are the Consumer Price Index (CPI) and the Core consumer inflation due out on Wednesday. These metrics, given their significance, could potentially influence several areas from the Federal Reserve’s policies to precious metals.

A Deeper Dive into CPI Expectations

The impending CPI report has been forecasted to showcase a 0.4% rise from the previous month, marking it as the most rapid monthly spike since January. Year-on-year, this would translate to an escalation in consumer prices by 3.4%, an uptick from July’s 3.2%. Furthermore, the core CPI, which strips away the fluctuating food and energy prices, is anticipated to have grown 0.2% over the past month. Annually, this brings us to a 4.3% surge, a deceleration from the 4.7% witnessed in July. Notably, this is speculated to be the tiniest annual boost in a span of two years.

Producer Price Index (PPI) Overview

Come Thursday, eyes will shift towards the Producer Price Index (PPI), which offers a vantage from the perspective of manufacturers and wholesalers. Predictions suggest a monthly increment of 0.4% for producer prices, marking acceleration from July’s 0.3% rate. Annually, this manifests as a 1.3% increase, surpassing July’s 0.8%. As producers’ charges to retail stores rise, it’s logical to anticipate concurrent movement between CPI and PPI.

Federal Reserve Policy: What Lies Ahead?

The looming inflation reports, especially the core CPI, are pivotal for the Federal Reserve’s decisions. Economists and investors alike are quite confident that the Federal Reserve, given its intense scrutiny of core inflation, will refrain from rate hikes in September. Market data, as of Friday, bolstered this sentiment by suggesting a hefty 92% probability of rates remaining unchanged post the September 19-20 meeting.

Inflation’s Broader Impact

The ramifications of these reports are broad and deep. High inflation figures might instill apprehension about the Federal Reserve keeping interest rates elevated or even amplifying them in upcoming months. Such a scenario could deter investors, especially given the recent S&P 500’s dip, losing around 5% since its summer peak.

Furthermore, signs of escalating inflation could bear down on the valuations of the mammoth growth names that have been the market’s linchpins. The winds of change could usher in higher nominal GDP growth, likely paired with unforeseen volatility and consequences.

Consequences for Precious Metals and the Dollar

While the dollar’s movement post these reports is keenly awaited, the trajectory of precious metals like gold and silver is of equal interest. Given silver’s safe-haven status and gold’s historical hedge against inflation, both could potentially see significant movement based on the data.

Conclusion

In summation, the forthcoming week holds a substantial weight for the financial landscape. As inflation remains a pertinent concern, its resonance through the Federal Reserve’s decisions, stock market fluctuations, and precious metal prices will be intently observed. The U.S. central bank’s September 20 meeting will be especially scrutinized, given the overarching implications of its outcomes on the economy.

Gold Prices Forecast: XAU/USD Strengthens Amid Dollar’s Downturn, Inflation Speculation

Gold Prices Forecast: XAU/USD Strengthens Amid Dollar’s Downturn, Inflation Speculation

Gold Price Movement Amid Dollar Retreat

Gold (XAU/USD) prices witnessed an upswing on Monday, propelled by the dollar’s downturn as the market eagerly awaits the forthcoming U.S. inflation data, potentially influencing the Federal Reserve’s stance on interest rates.

Spot gold increased by 0.43% to reach $1,927.28 per ounce, offsetting the 1% loss from the previous week, while its U.S. futures counterpart also ascended by 0.43% to $1,951.00. Experts anticipate that gold will maintain its foothold above the $1,900 threshold, especially if the U.S. dollar’s downturn continues, driven by speculation regarding the Federal Reserve’s next steps.

Trading Derivatives carries a high level of risk to your capital and you should only trade with money you can afford to lose. Trading Derivatives may not be suitable for all investors, so please ensure that you fully understand the risks involved, and seek independent advice if necessary. A Product Disclosure Statement (PDS) can be obtained either from this website or on request from our offices and should be considered before entering into a transaction with us. Raw Spread accounts offer spreads from 0.0 pips with a commission charge of USD $3.50 per 100k traded. Standard account offer spreads from 1 pips with no additional commission charges. Spreads on CFD indices start at 0.4 points. The information on this site is not directed at residents in any country or jurisdiction where such distribution or use would be contrary to local law or regulation.

Technical Analysis and Inflation Outlook

From a technical perspective, XAU/USD grapples with its 200-day moving average, a significant level that presents challenges. Market analysts highlight that any shortfall in U.S. inflation could exert further pressure on the dollar.

This, coupled with the anticipated U.S. Consumer Price Index (CPI) data set for release on Wednesday, could significantly inform the Federal Reserve’s interest rate decisions. Concurrently, gold futures experienced a slight surge on Friday, motivated by the dollar’s minor pullback, settling at $1,942.70.

Dollar’s Position and Upcoming Decisions

Despite recent setbacks, the dollar is on track for its most extended weekly triumph since 2014, largely due to robust U.S. economic figures. This momentum, however, has nudged gold towards its inaugural weekly decline in nearly a month. The focal point for investors now shifts to the impending U.S. inflation figures slated for September 13, followed by the Federal Reserve’s policy verdict on September 20.

Gold as a Safe Haven Amid Inflation Uncertainties

Despite the considerable investments funneling into the dollar and Treasuries, gold continues to allure many as a safe haven, providing crucial support to its price. Notably, even if the forthcoming CPI figures align with expectations, the Fed’s primary measure – the personal consumption expenditures price index – remains fairly resilient.

A potential economic slowdown, paired with persistent inflation, could catapult gold to the forefront among other safe havens. Presently, traders are hedging their bets, with a 93% likelihood of the Fed maintaining the current rates in September and a 43% probability of an additional rate hike preceding 2024.

In essence, the market sentiment appears cautiously bullish for gold, contingent upon the Fed’s unfolding decisions.

Technical Analysis

4-Hour Gold (XAU/USD)Based on the 4-hour chart for Spot Gold (XAU/USD), the current price of $1927.58 is slightly above the 200-4H moving average of $1926.47, indicating a marginal bullish tendency. It’s slightly below the 50-4H moving average of $1932.46, suggesting caution. The 14-4H RSI at 54.37 leans bullish, showing somewhat stronger momentum.

Main support resides between $1893.07 and $1885.79, while main resistance spans from $1946.99 to $1954.88. Given these factors, the market sentiment appears cautiously bullish, contingent on breaking the 50-4H MA and staying above main support.

Japanese Yen Rallies on Bank of Japan’s Ueda Comments. Will USD/JPY Reverse?

Japanese Yen Rallies on Bank of Japan’s Ueda Comments. Will USD/JPY Reverse?

The Japanese Yen has had a wild start to the week after comments from Bank of Japan Governor (BoJ) Kazuo Ueda opened the door to speculation for the end of its negative interest rate policy (NIRP).

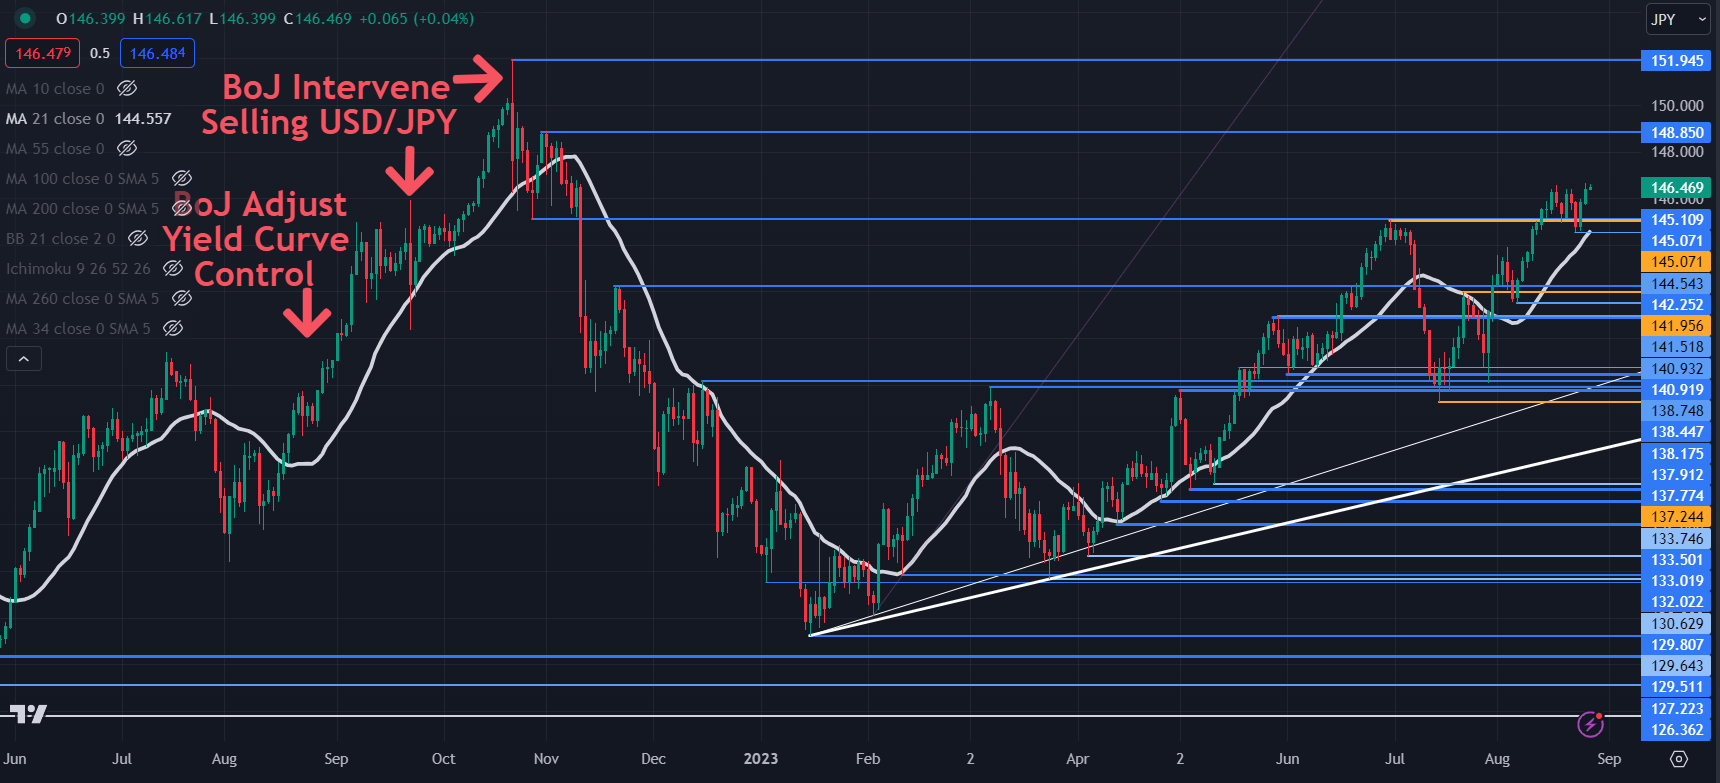
In early Asian trade on Monday morning, USD/JPY retreated from its 10-month peak of 147.87. It traded down to 146.67 before steadying back over 147. It has since dipped below 146.40. Live prices can seen on the right-hand side of this article.

The Yomiuri Shimbun newspaper is reporting that Ueda san may tilt monetary policy if wages and prices rise, citing that there are various options.

He made it clear that any policy adjustment will be dependent on circumstance by saying, “We have a variety of options if economic and price conditions turn upward.”

However, the market might have got ahead of itself in seeking tightening from the BoJ. Ueda also remarked, “There is still some way to go before the price target can be realized. We will continue our persistent monetary easing policy.”

The BoJ has a policy rate of -0.10% and is maintaining yield curve control (YCC) by targeting a band of +/- 0.50% around zero for Japanese Government Bonds (JGBs) out to 10 years.

The bank has become flexible on YCC implementation, recently allowing the 10-year Japanese Government Bond (JGB) to yield above 0.50%. It traded at 0.70% today, its highest return in almost 10 years.

The spread between JGBs and Treasury yields might be worth paying attention to as there has traditionally been a strong correlation to USD/JPY. The next few sessions may see some volatility in this part of the market.

USD/JPY AND YIELD SPREAD BETWEEN 10-YEAR TREASURIES AND JGBS

image1.png

Governor Ueda’s comments follow some soft jawboning last week from Masato Kanda, Japan’s Vice Minister of Finance for International Affairs and BoJ board member Hajime Takata.

It might be reasonable to expect more remarks from Japanese officials if USD/JPY makes another move to the topside.

The market is generally not anticipating physical intervention until the price moves toward 152.00, if at all. The November 2022 high was 151.95.

To learn more about how to trade USD/JPY, click on the banner below.

USD/JPY TECHNICAL ANALYSIS SNAPSHOT

USD/JPY made a 10-month high last Tuesday before consolidating. A breakout on either side of the range could see momentum evolve in that direction.

If a bullish run emerges, resistance might be at the prior peaks of 148.85 and 151.95.

On the downside, support may lie at the breakpoints in the 145.05 – 145.10 area ahead of the prior lows near 144.50 and 141.50.

The 34-day Simple Moving Average (SMA) is also near 144.80 and may lend support.

image2.png


Asia Day Ahead: Cautious mood ahead of US CPI, JPY on watch amid BoJ’s Ueda comments

Asia Day Ahead: Cautious mood ahead of US CPI, JPY on watch amid BoJ’s Ueda comments

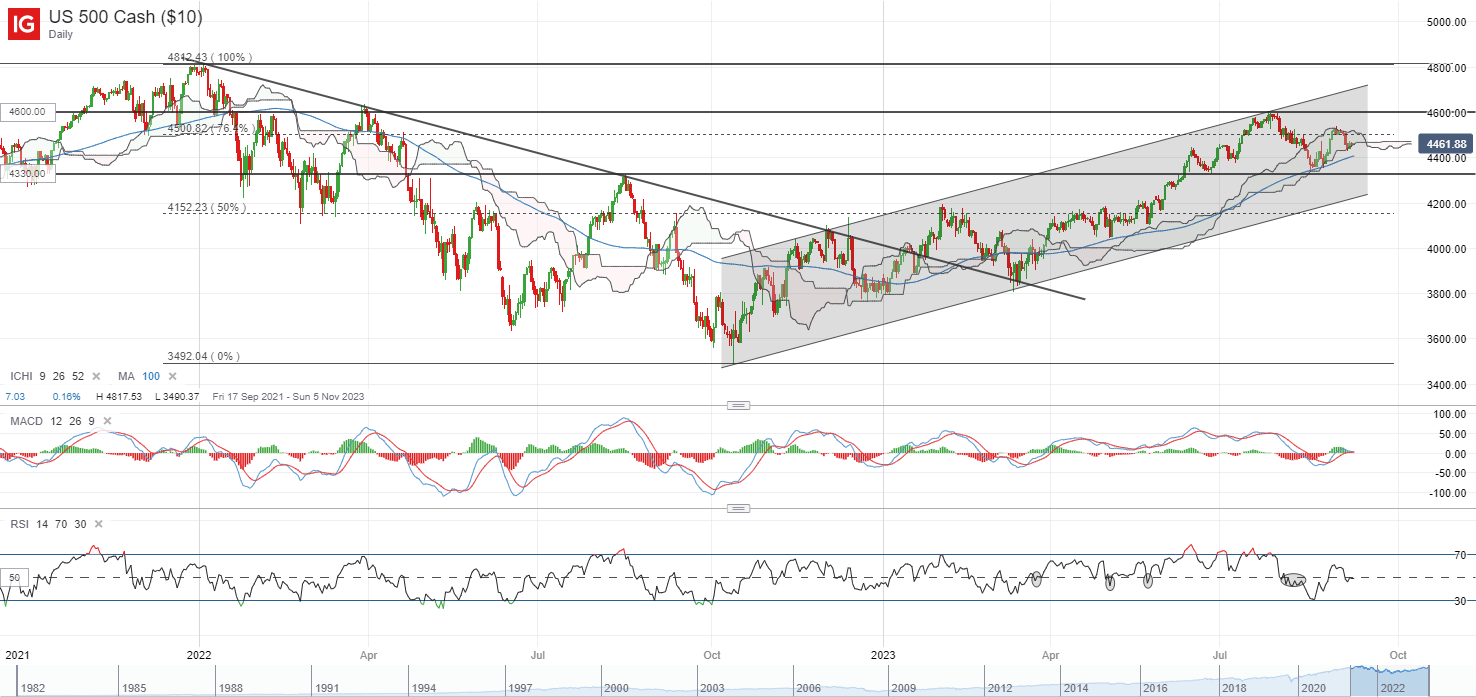
Major US indices attempted to stabilise towards the end of last week (DJIA +0.22%; S&P 500 +0.14%; Nasdaq +0.09%), but gains remained feeble following recent de-risking in tech and concerns of a resurgence in inflationary pressures. Thus far, Wall Street’s performance has been in line with the weak seasonality pattern for September, but several support lines may still have to give way before there are greater conviction that the broader upward trend is reversing. For now, the VIX has struggled to move higher, seemingly placing its sight back at its year-to-date low.

For the S&P 500, the index continues to trade within its Ichimoku cloud pattern on the daily chart, with buyers successfully defended it back in mid-August this year. Further downside may leave the 4,400 level on watch as support to hold, while sentiments could likely stay cautious to start the new week amid the Fed blackout period and lead-up to the US Consumer Price Index (CPI) – the last piece of key inflation data to anchor rate expectations before the next Federal Open Market Committee (FOMC) meeting.

Market expectations have been firmly priced for the Fed to keep rates on hold at the September meeting, but the central bank’s guidance for policymaking to be on a meeting-by-meeting basis still leaves the November meeting wavered. This may likely be in line with the Fed’s previous guidance of having one last rate hike by the end of this year before heading into a prolonged pause.

image1.png

Asia Open

Asian stocks look set for a downbeat open, with Nikkei -0.37%, ASX -0.29% and KOSPI -0.12% at the time of writing. The key story for markets to digest may revolve around the weekend remarks from Bank of Japan (BoJ) Governor Kazuo Ueda, with him guiding that the central bank may have enough wages data by year-end to decide on its ultra-loose monetary policies. With the option for an end to negative interest rates on the table, it is perceived to lay the groundwork for further policy normalisation ahead, although the Governor is also quick to downplay some speculations by indicating patience.

The slightly hawkish takeaway from his comments brought the Japan’s 10-year yields to another new high since 2014, narrowing the yield differential with the US which has been a key driving force for the USD/JPY. That said, with the next BoJ meeting scheduled to be less than two weeks away, there may still be room for disappointment for near-term hawkish bets, given that the Governor’s comments seem to place any rate decision only in 2024, along with the less likelihood of back-to-back policy tweaks given its broadly patient stance.

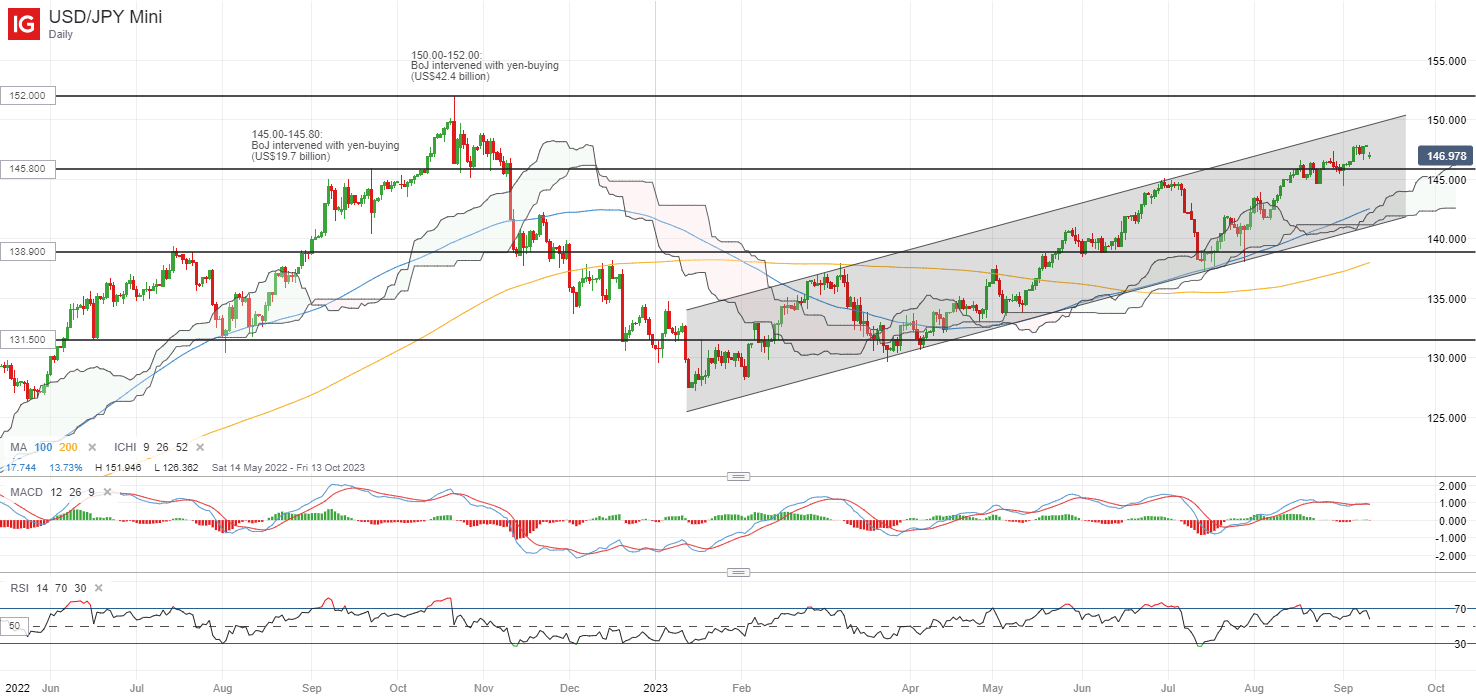
The 145.80 level may be a key support level on watch for the USD/JPY, which marked the upper bound of previous yen-buying intervention back in September 2022. Declining moving average convergence/divergence (MACD) and lower highs on relative strength index (RSI) may suggest ebbing upward momentum for now, but the broader upward trend may remain intact until several support lines are broken, with the 145.80 level serving as an immediate support to hold.

image2.png

On the watchlist: US dollar on watch ahead of US CPI data this week

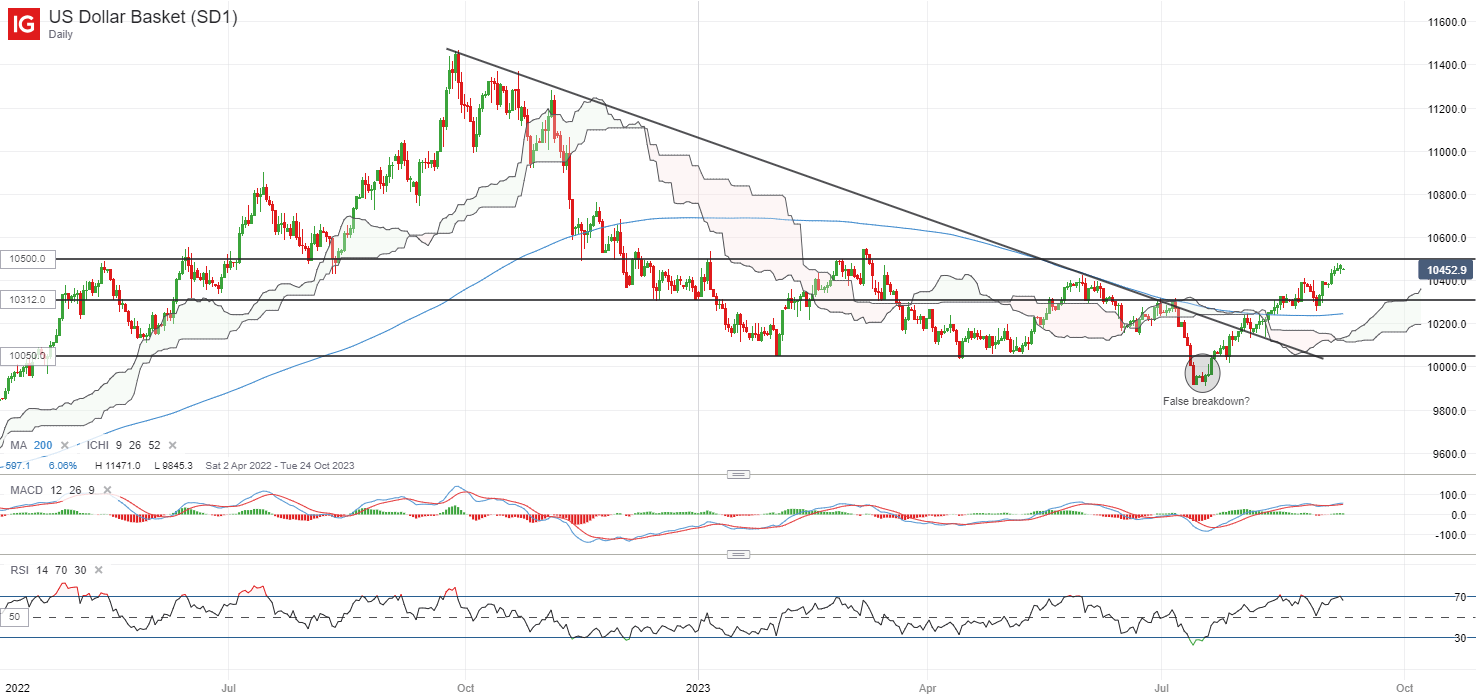
Thus far, US Treasury yields have stayed firm in the lead-up to the US CPI release this week, pricing for rates to be kept high for longer with ongoing expectations for a resurgence in US headline inflation (est 3.6% vs previous 3.2%). That have kept the US dollar near its six-month high, following a 5.6% rebound since mid-July this year.

While the US dollar continues to trade above its key 200-day moving average (MA), a potential bearish divergence in the making on the daily RSI may point to some near-term indecision with ebbing upward momentum. Ahead, the 105.00 level will be a crucial resistance to overcome, which marks the upper bound of a long-ranging pattern since the start of the year. Failing to cross the level may leave the 103.12 level on watch as immediate support.

image3.png

Australian Dollar Could Rebound a Bit; AUD/USD, EUR/AUD, GBP/AUD Price Setups

Australian Dollar Could Rebound a Bit; AUD/USD, EUR/AUD, GBP/AUD Price Setups

AUD/USD: Growing odds of a minor rebound

After an initial attempt to break higher in late August, AUD/USD is back around its August lows. However, a new/minor high created at the end of last month raises the prospect of AUD/USD retesting the 200-period moving average on the 240-minute charts (now at about 0.6500).

AUD/USD 240-Minute Chart

image1.png

Zooming out, in recent weeks, AUD/USD has been attempting to hold above quite strong support on a downtrend line from the end of 2022. Any break above the August 30 high of 0.6525 could indicate the start of a material consolidation. That’s because, on higher timeframe charts, including the weekly charts, AUD/USD is looking oversold and is showing tentative signs of fatigue. For more discussion, including fundamentals, see “Australian Dollar Looks to Recoup Losses Ahead of CPI; AUD/USD, AUD/NZD, AUD/JPY,” published August 29.

EUR/AUD 240-Minute Chart

image2.png

EUR/AUD: Consolidation within a broadly bullish phase

The failure of EUR/AUD to resume its uptrend last week could be a sign that the consolidation that started last month isn’t over. EUR/AUD retreated from near a tough hurdle at the end-August highs of around 1.6880, coinciding with the upper edge of the Ichimoku cloud on the 240-minute charts.The cross is now testing a vital floor area: the 200-period moving average, slightly above a horizontal trendline since August (at about 1.6635). Any break below 1.6635 could raise the odds of further losses, initially toward 1.6450.

GBP/AUD 240-Minute Chart

image3.png

GBP/AUD: Testing a crucial cushion

GBP/AUD is testing a crucial converged cushion: the 200-period moving average, coinciding with a horizontal trendline from the end of August (at about 1.9450), not too far from an uptrend line from June. A hold above the support area is key for the uptrend to resume. To be sure, a break below isn’t imminent, but any break below would point to an extended consolidation with a slightly weak bias. On the upside, GBP/AUD would need to break above last week’s high of 1.9750 for the bullish bias to resume.

US Dollar on the Ropes with Yen Leading the Way. AUD, NZD and GBP Piled In

US Dollar on the Ropes with Yen Leading the Way. AUD, NZD and GBP Piled In

The US Dollar has taken a battering across the board to start Monday with the DXY (USD) index giving up a large portion of last week’s gains.

The Japanese Yen scored the largest gains in the aftermath of comments by the Bank of Japan (BoJ) Governor.

In an interview with the Yomiuri Shimbun newspaper, Governor Kazuo Ueda said, “We have a variety of options if economic and price conditions turn upward.”

However, he clarified that “There is still some way to go before the price target can be realized. We will continue our persistent monetary easing policy.”

USD/JPY initially traded near the recent peak of 147.87 at the open before collapsing toward 146.00 throughout the Asian session. 10-year Japanese Government Bond yields traded above 0.70% today for the first time since early 2014.

Elsewhere, the G-20 summit concluded in India, with a joint communique that has been viewed as a positive for India, indicating a possible shift in global geo-political and economic dynamics.

China’s credit data exceeded expectations, leading to a dip in the USD/CNH (US Dollar/Chinese Yuan) after the fix. New Yuan loans were CNY 1.36 billion in August, above forecasts of CNY 1.25 billion.

This news could be a positive signal for traders, as a healthier credit environment in China can potentially lead to increased economic activity and investment opportunities.

The growth linked Aussie and Kiwi Dollars notched sizable gains, as did Sterling do a lesser extent.

APAC equity indices are mixed with Australia’s ASX 200 and mainland China’s CSI 300 seeing small gains while Hong Kong’s Hang Seng index dipped.

In Japan, bank shares experienced noticeable gains with the prospect of higher interest rates. The Nikkei 500 banking index rose by over 3%, while the broader Nikkei 225 index fell by approximately 0.5%.

This divergence highlights the potential for sector-specific trading strategies, as different industries can react differently to the same macroeconomic indicators.

In commodities markets, iron ore futures traded higher on the Dalian and Singaporean exchanges. Gold and silver have seen small gains on the weaker USD.

Crude oil is mostly steady with the West Texas Intermediate (WTI) futures contract slipping slightly toward US$ 87 while the Brent contract is trading near Friday’s close just above US$ 90.50.

Looking ahead, the highlight this week will be the US Consumer Price Index (CPI) data release on Wednesday. This key economic indicator can significantly influence the Federal Reserve’s monetary policy, and thus impact the USD and other correlated assets.

DXY (USD) INDEX TECHNICAL ANALYSIS SNAPSHOT

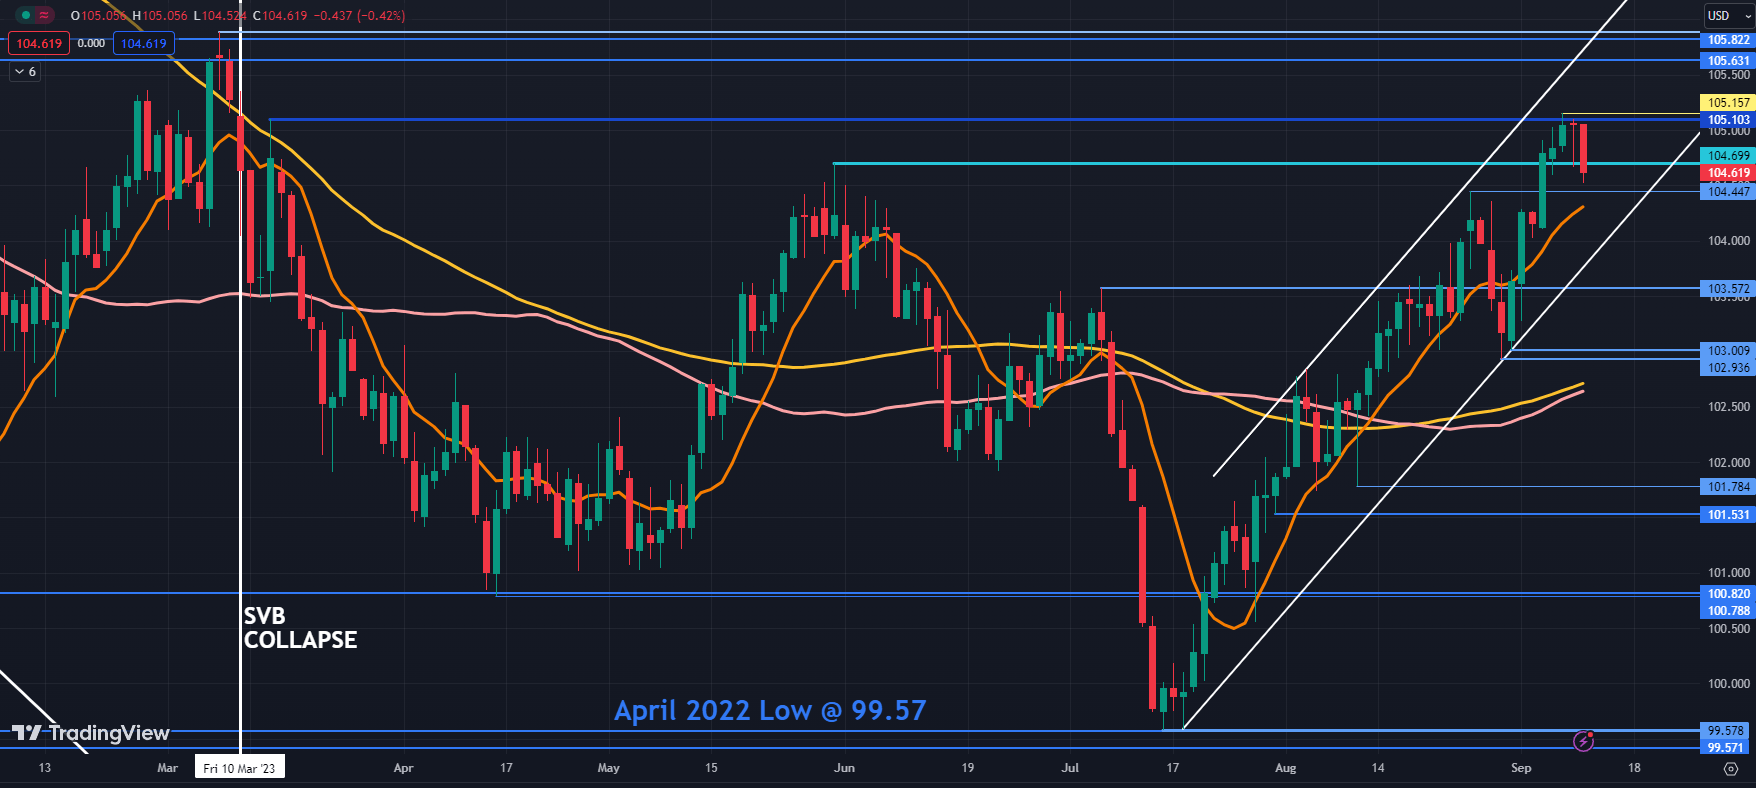
The DXY Index broke below a breakpoint near 104.70 and that level may offer resistance ahead of another breakpoint and prior peak in the 105.10 – 105.15 area.

The index remains in an ascending trend channel and support might be found at the breakpoints near 104.45 and 103.57 or further below at the previous lows in the 102.90 – 103.00 area.

image1.png


Oil Prices Forecast: China’s Economy, Strong US Dollar Fueling Profit-Taking

Oil Prices Forecast: China’s Economy, Strong US Dollar Fueling Profit-Taking

Oil Price Dynamics Amid Geopolitical and Economic Factors

Oil prices retraced this week, moving away from 10-month highs achieved earlier. This retreat was mainly due to worries about China’s economic health and an ascendant U.S. dollar. Despite cuts from major producers like Saudi Arabia and Russia, both Brent and WTI benchmarks dipped nearly 0.6% and 0.7%, respectively, but maintained a weekly gain close to 1%.

Saudi Arabia and Russia’s voluntary supply cuts, extended through the end of the year, had initially pushed benchmarks to their 10-month highs. However, according to Priyanka Sachdeva, a senior market analyst from Phillip Nova, the resurgence of the U.S. dollar and China’s uneven recovery have curtailed this bullish momentum. A robust U.S. dollar, bolstered by expectations of sustained high U.S. interest rates, makes crude purchases pricier in other currencies. Moreover, investors have largely priced in the extended supply cuts, seeking signs of increased global demand, particularly from China, before boosting investments.

Trading Derivatives carries a high level of risk to your capital and you should only trade with money you can afford to lose. Trading Derivatives may not be suitable for all investors, so please ensure that you fully understand the risks involved, and seek independent advice if necessary. A Product Disclosure Statement (PDS) can be obtained either from this website or on request from our offices and should be considered before entering into a transaction with us. Raw Spread accounts offer spreads from 0.0 pips with a commission charge of USD $3.50 per 100k traded. Standard account offer spreads from 1 pips with no additional commission charges. Spreads on CFD indices start at 0.4 points. The information on this site is not directed at residents in any country or jurisdiction where such distribution or use would be contrary to local law or regulation.

China’s Economic Indicators

Despite concerns about China’s economy, its crude imports saw a 30.9% surge last month. Refiners increased processing rates to take advantage of better profit margins from exported fuel. Nonetheless, August data revealed a contraction in China’s exports and imports, reflecting the global economic pressures and muted domestic consumer spending.

U.S. Inventory and Demand Dynamics

The U.S. experienced a larger-than-anticipated draw in crude oil inventories, which provided subdued support to oil prices. For the fourth consecutive week, U.S. crude stockpiles diminished. A reduction of 6.3 million barrels was noted, tripling analyst expectations. This depletion signifies that U.S. refiners are ramping up operations to meet the global energy demand.

Short-term Forecast

While the extended supply cuts and the recent U.S. inventory draw provide some bullish sentiments, the evolving economic landscape, especially in China, and possible Russian export boosts due to seasonal refinery maintenance, present a mixed short-term outlook. It remains cautiously bearish until clear signs of sustained global demand emerge.

Technical Analysis

4-Hour Light Crude Oil FuturesThe current 4-hour price of Light Crude Oil Futures is $86.35, slightly above both the 200-4H moving average of $81.78 and the 50-4H moving average of $84.52, indicating bullish momentum. The 14-4H RSI reading sits at 52.85, presenting a neutral to slightly bullish sentiment.

Price-wise, it’s nestled above the main support zone (from $84.89 to $83.81) and is edging towards the primary resistance area (from $88.68 to $90.10). Based on the data, the market sentiment for Light Crude Oil Futures on the 4-hour chart is predominantly bullish.