blog-eurusd-14-01-25

US Dollar Index drops below 99.00 due to tariff threats, ISM Manufacturing PMI awaited

The US Dollar Index (DXY), which measures the value of the US Dollar (USD) against six major currencies, is depreciating by more than 0.50% and trading near 98.80 during the European hours on Monday. Traders seek fresh cues from the release of the US ISM Manufacturing Purchasing Managers’ Index (PMI) for May, which is due later in the North American session.

US President Donald Trump, on Friday, accused China of breaching a truce on tariffs reached earlier this month. Washington and Beijing agreed to temporarily lower tit-for-tat tariffs in a meeting in Geneva. Trump said that China had “totally violated its agreement with us”. US Trade Representative Jamieson Greer also said that China had failed to remove non-tariff barriers as agreed. In response, a spokesperson from China’s Ministry of Commerce said on Monday that China had complied with the agreement by cancelling or suspending relevant tariff and non-tariff measures aimed at US “reciprocal tariffs.”

The Greenback faces challenges due to growing concerns regarding slow growth and renewed inflation in the United States (US). US President Donald Trump said at a rally in Pennsylvania on Friday that he planned to double import tariffs on steel and aluminum to build up pressure on global steel producers and intensify the trade war. “We are going to be imposing a 25% increase. We’re going to bring it from 25% to 50% – the tariffs on steel into the United States of America, which will even further secure the steel industry in the United States,” he said, per Reuters.

On Thursday, the US Court of Appeals for the Federal Circuit in Washington temporarily put a hold on a federal’s court ruling and allowing President Trump’s tariffs to take effect. On Wednesday, a three-judge panel at the Court of International Trade in Manhattan halted Trump from imposing “Liberation Day” tariffs from taking effect. The federal court found that Trump exceeded his authority in imposing broad import tariffs and declared the executive orders issued on April 2 unlawful.

House Republicans passed a Trump’s “Big Beautiful Bill,” a multitrillion-dollar tax and spending package, which could increase the US fiscal deficit, along with the risk of bond yields staying higher for longer. This scenario raises concerns over US economy and prompts traders to sell American assets under “Sell America” trend. Policy experts anticipate for Senate changes as GOP lawmakers aim to finalize the “big bill” by the July 4.


Untitled

USD/CAD explores Year-to-Date lows below 1.3700 amid broad-based Dollar weakness

Strong Canadian GDP raises expectations of a hawkish BoC on Wednesday.

The US Dollar is dropping across the board, hammered by a mix of risk aversion amid Trump’s erratic trade policies, concerns about fresh tariffs, and looming fears of US debt that have revived the “sell America” trade.

The US President rattled markets on Friday, threatening to increase Steel and Aluminium levies from 25% to 50%, with the US Dollar taking the worst part. The announcement opened a new chapter on the chaotic trade policy and raised concerns that it will constrain economic growth and increase inflation.

Beyond that, an accusation that China has violated the trade agreement on minerals has received an energetic reaction from Beijing, which puts further pressure on the already deteriorated relationship between the world’s two major economies.

A weak Dollar and strong Canadian data keep the pair on its back foot

The market has reacted by selling the US Dollar. The Canadian Dollar is trading highest levels since last October, as the pair moves below the 1.3700, despite the fact that Canada is one of the main Steel exporters to the US.

The market seems to have prioritised the uncertainty about the US trade agenda above the potential impact on the Canadian economy, in case Trump’s threat finally comes to effect, which is another matter.

Macroeconomic data released on Friday revealed that US inflation keeps trending lower, at least for now, which gives leeway for the Fed to ease interest rates further. Fed’s Waller endorsed this view earlier today, and added pressure on the US Dollar.

In Canada, on the other hand, GDP numbers seen on Friday posted a positive surprise, with an unexpected acceleration in the first quarter. These figures have boosted expectations that the Bank of Canada might keep rates on Hold on Wednesday, which is providing additional support to the loonie.
Trade uncertainty and debt woes are weighing on the USD.

Untitled

According to the daily chart, the bullish outlook of EUR/USD remains intact, characterized by the price holding above the key 100-day Exponential Moving Average (EMA). The upward momentum is supported by the 14-day Relative Strength Index (RSI), which stands above the midline near 57.25, suggesting the path of least resistance is to the upside. The immediate resistance level emerges at 1.1445, the upper boundary of the Bollinger Band. Further north, the next hurdle is located at 1.1574, the high of April 21, followed by the 1.1600 psychological mark. The low of May 28 at 1.1283 acts as an initial support level for a major pair. The next downside target to watch is 1.1110, the lower limit of the Bollinger Band. A breach of this level could see a drop to the key contention level at 1.1000, representing the round figure and the 100-day EMA.

Gold price (XAU/USD) builds on its intraday positive move and advances to over a one-week high, around the $3,359 area during the first half of the European session on Monday. Concerns about the worsening US fiscal situation, along with the growing acceptance that the Federal Reserve (Fed) will lower borrowing costs again in 2025, drag the US Dollar (USD) back closer to the monthly low. This, in turn, is seen as a key factor acting as a tailwind for the non-yielding yellow metal.

Meanwhile, investors remain on edge amid persistent trade-related uncertainties and rising geopolitical tensions. This is evident from a generally weaker tone around the equity markets and contributes to driving flows toward the safe-haven Gold price. Apart from this, the momentum could further be attributed to some technical buying above the $3,325-3,326 barrier, which seems to have set the stage for further gains. Traders now look to the US ISM Manufacturing PMI for a fresh impetus.

Gold price seems poised to appreciate further and aim towards reclaiming the $3,400 round-figure mark

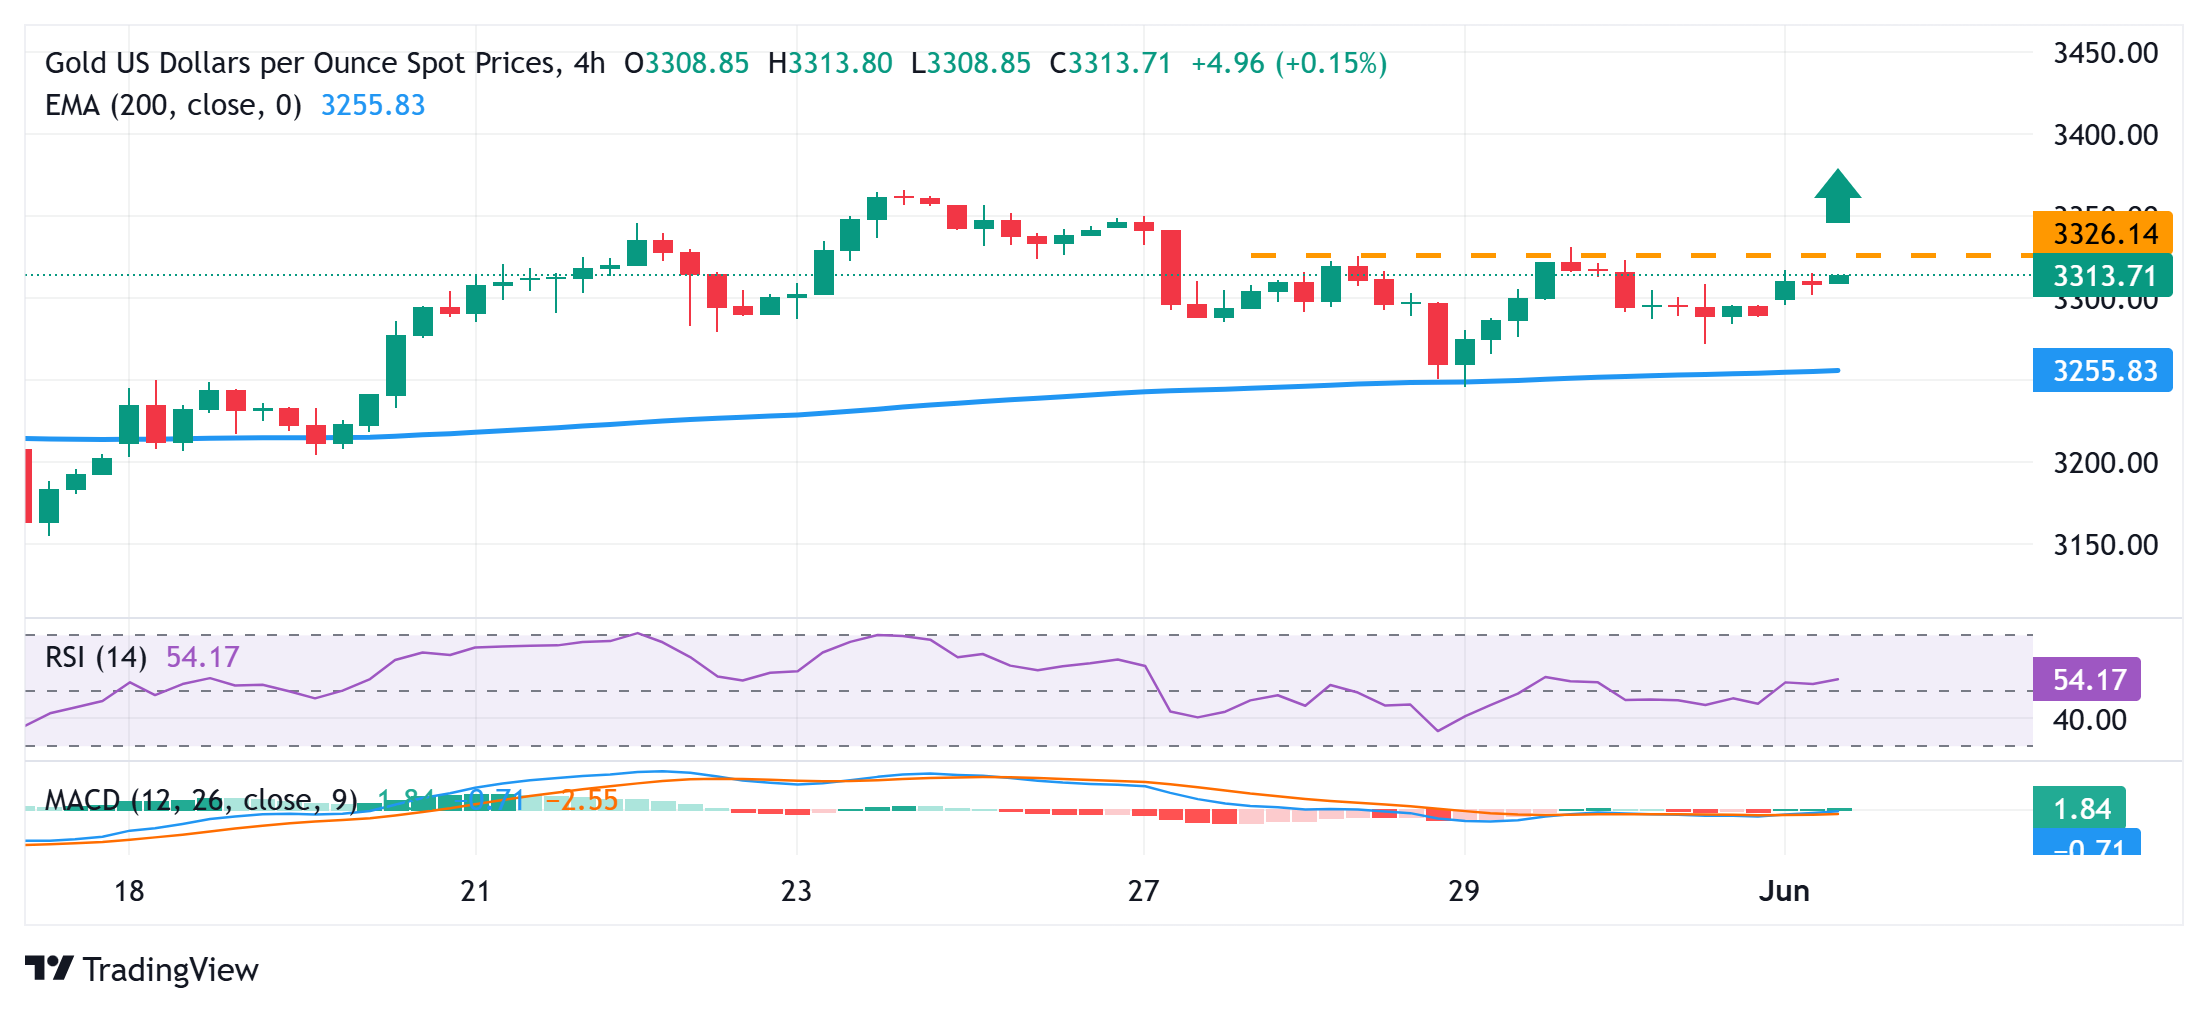
From a technical perspective, a sustained strength beyond the $3,326-3,328 supply zone could be seen as a fresh trigger for the XAU/USD bulls against the backdrop of last week’s bounce from the 200-period Exponential Moving Average (EMA) pivotal support on the 4-hour chart, The subsequent move up beyond the $3,345-3,350 intermediate resistance might now allow the Gold price to reclaim the $3,400 mark. The momentum could extend further towards the next relevant barrier near the $3,432-3,434 region.

On the flip side, weakness below the $3,300 round figure could find some support near the $3,280-3,278 zone. Any further slide could be seen as a buying opportunity and remain limited near the $3,258-3,257 region. The latter represents the 200-period EMA on the 4-hour chart, which if broken decisively could make the Gold price vulnerable to accelerate the fall further towards the $3,200 mark.

mmm

EUR/USD climbs above 1.1400 on renewed USD weakness

EUR/USD starts the month of June on a bullish note and trades above 1.1400. The broad-based US Dollar weakness on re-escalating US-China trade tensions allows the pair to push higher as market focus shifts to the May ISM Manufacturing PMI data for May.

According to the daily chart, the bullish outlook of EUR/USD remains intact, characterized by the price holding above the key 100-day Exponential Moving Average (EMA). The upward momentum is supported by the 14-day Relative Strength Index (RSI), which stands above the midline near 57.25, suggesting the path of least resistance is to the upside.

The immediate resistance level emerges at 1.1445, the upper boundary of the Bollinger Band. Further north, the next hurdle is located at 1.1574, the high of April 21, followed by the 1.1600 psychological mark.

The low of May 28 at 1.1283 acts as an initial support level for a major pair. The next downside target to watch is 1.1110, the lower limit of the Bollinger Band. A breach of this level could see a drop to the key contention level at 1.1000, representing the round figure and the 100-day EMA.