Untitled

The GBPUSD is surrounded by positive pressures

The (GBPUSD) price rose in its last intraday trading, taking advantage of its stability above its EMA50, which provided dynamic support that assisted it to achieve its last gains, with the continuation of its trading alongside a minor bullish bias on the short-term basis.

The (RSI) reinforces the bullish trend, after the appearance of clear positive signals due to surpassing oversold levels, showing the improvement of the bullish momentum, and supports the possibility for the continuation of the rise in its upcoming moves.

The (USDJPY) price declined in its last intraday trading, affected by the stability of the current resistance at 144.40, amid the domination of the bearish correctional trend on the short-term basis and its trading alongside a bias line.

Noticing the beginning of negative overlapping signals appearance on the (RSI), after reaching overbought levels, exaggeratedly compared to the price move, which suggests the formation of a negative divergence, which might increase the negative pressures.

The (USDCAD) price declined in its last intraday trading, with the price readiness to break the critical support level at 1.3690, amid the dominance of the main bearish trend and its trading below its EMA50, besides the emergence of the negative signals on the (RSI), after the price success in offloading its oversold conditions.

The (AUDUSD) price rose in its last intraday trading, due to its lean on the support of its EMA50, providing positive momentum that assisted it to achieve these last gains, amid the dominance of the main bullish trend and its trading within a minor bullish channel’s range that limits its previous trading on the short-term basis, besides the emergence of the positive signals on the (RSI).


eur_456

EURUSD is attempting to recover-Analysis

The (EURUSD) rose in its last intraday trading, taking advantage of its lean on the support level of 1.1360, accompanied by its lean on the support of the EMA50, which provided some positive momentum that assisted it in recording these early gains.

This rise results from the formation of a positive divergence on the (RSI), after reaching exaggerated oversold levels, and the emergence of positive overlapping signals, which supports the possibility of extending the bullish wave in the short-term basis, unless breaking the mentioned support level.

The (BTCUSD) rose in its last intraday trading, hitting the resistance of its EMA50, amid the dominance of the bearish correctional trend on the short-term basis and its moves alongside bias line, with the stability of its trading below the critical resistance level at $106,550, besides the emergence of the negative signals on the (RSI) after reaching overbought levels.

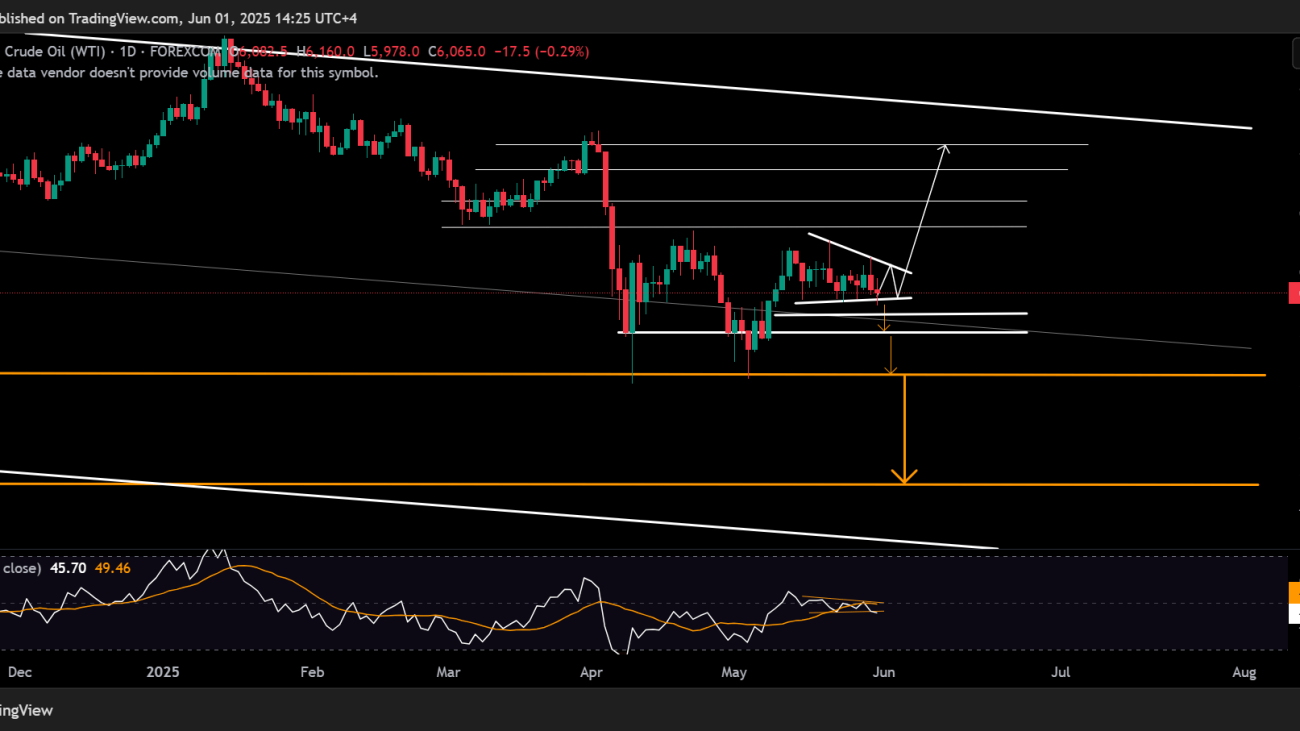
The (crude oil) rose in its last intraday trading, preparing to attack its current resistance at $63.50, amid the domination of the bullish trend on the short-term basis, with the continuation of the dynamic support that is represented by its trading above its EMA50, we notice the return of the bullish signals on the (RSI), after the price success in offloading its overbought condition.

The (Gold) rose in its last intraday trading, attempting to recover amid its trading within a minor bullish channel’s range on the short-term basis, supported by its trading above its EMA50, and we notice the reach of the (RSI) to oversold levels, which suggest the formation of a positive divergence, which will increase the bullish pressure.

USOIL_2025-06-01_14-25-27

Crude oil gathers its positive strength

The (crude oil) declined slightly in its last intraday trading, in a natural correctional move to gain some positive momentum, that might allow it to resume its rise and attempt to breach the critical resistance at $63.50, this decline comes amid the continuation of the bullish trend on the short-term basis, supported by its trading alongside a bullish bias line.

The price gets positive support from its stability above EMA50, reinforcing the chances for the continuation of the bullish trend, especially with the emergence of the positive signals on the (RSI), after its approach from neutral areas that provide more flexibility in resuming the rise in the upcoming session.

Gold is getting ready for a sharp rise -Analysis-04-06-2025

The (Gold) price declined in its last intraday trading, attempting to gain a positive momentum that might assist it to rise and attacking the key resistance at $3,365, amid the continuation of the dynamic support that is represented by its trading above its EMA50.

Gold moves within a minor bullish channel’s range that limited its previous trading on the short-term trading on the short-term on the short-term, accompanied by the gaining of a positive divergence on the (RSI), after reaching exaggerated oversold levels, with the beginning of the positive signals.

EURUSD is attempting to recover-Analysis-04-06-2025

The (EURUSD) rose in its last intraday trading, taking advantage of its lean on the support level of 1.1360, accompanied by its lean on the support of the EMA50, which provided some positive momentum that assisted it in recording these early gains.

This rise results from the formation of a positive divergence on the (RSI), after reaching exaggerated oversold levels, and the emergence of positive overlapping signals, which supports the possibility of extending the bullish wave in the short-term basis, unless breaking the mentioned support level.

Evening update for Bitcoin -03-06-2025

The (BTCUSD) rose in its last intraday trading, hitting the resistance of its EMA50, amid the dominance of the bearish correctional trend on the short-term basis and its moves alongside bias line, with the stability of its trading below the critical resistance level at $106,550, besides the emergence of the negative signals on the (RSI) after reaching overbought levels.


Untitled

Gold is getting ready for a sharp rise

The (Gold) price declined in its last intraday trading, attempting to gain a positive momentum that might assist it to rise and attacking the key resistance at $3,365, amid the continuation of the dynamic support that is represented by its trading above its EMA50.

Gold moves within a minor bullish channel’s range that limited its previous trading on the short-term trading on the short-term on the short-term, accompanied by the gaining of a positive divergence on the (RSI), after reaching exaggerated oversold levels, with the beginning of the positive signals.

EURUSD is attempting to recover-Analysis-04-06-2025

The (EURUSD) rose in its last intraday trading, taking advantage of its lean on the support level of 1.1360, accompanied by its lean on the support of the EMA50, which provided some positive momentum that assisted it in recording these early gains.

This rise results from the formation of a positive divergence on the (RSI), after reaching exaggerated oversold levels, and the emergence of positive overlapping signals, which supports the possibility of extending the bullish wave in the short-term basis, unless breaking the mentioned support level.

Evening update for Bitcoin -03-06-2025

The (BTCUSD) rose in its last intraday trading, hitting the resistance of its EMA50, amid the dominance of the bearish correctional trend on the short-term basis and its moves alongside bias line, with the stability of its trading below the critical resistance level at $106,550, besides the emergence of the negative signals on the (RSI) after reaching overbought levels.

Evening update for crude oil -03-06-2025

The (crude oil) rose in its last intraday trading, preparing to attack its current resistance at $63.50, amid the domination of the bullish trend on the short-term basis, with the continuation of the dynamic support that is represented by its trading above its EMA50, we notice the return of the bullish signals on the (RSI), after the price success in offloading its overbought condition.

how-to-trade-eur-usd-5

EUR/USD hovers below 1.1400 as US Dollar steadies ahead of key data

EUR/USD keeps its range below 1.1400 in the European trading hours on Wednesday. The pair trades with caution as the US Dollar looks to stabilize amid optimism over likely Trump-Xi talks and the US-Cananda trade deal. All eyes now remain on the key US data, trade updates and Fedspeak.

Still well-supported above its 200-day simple moving average (SMA) at 1.0816, the near-term outlook for the pair appears constructive.

The YTD high at 1.1572 (April 21) marks immediate resistance, followed by the 1.1600 milestone, and the October 2021 top comes at 1.1692 (October 28).

On the downside, temporary support emerges at the 55-day SMA at 1.1183, then the May low at 1.1064 (May 12), while further south appears the psychological 1.1000 level. A break below the latter would activate a potential move to the crucial 200-day SMA.

Momentum indices provide a mixed picture. Though the Average Directional Index (ADX) at 19 indicates the trend may be losing some steam, the Relative Strength Index (RSI) around 56 indicates a developing bullish momentum.

Job Openings and Labor Turnover Survey (JOLTS) Job Openings posted 7.39 million new positions in April, higher than March’s 7.2 million openings. This figure surprisingly came in above the market expectation of 7.1 million.

Traders await the US Nonfarm Payrolls (NFP) report for May, which is expected to show 130K job additions. If the report showed a stronger-than-expected outcome, this might lift the Greenback and put downward pressure on the EUR/USD pair.

US Treasury Secretary Scott Bessent said on Sunday that Trump and Xi Jinping were expected to meet soon to resolve trade disputes. China’s Ministry of Commerce said on Monday that China had complied with the agreement by cancelling or suspending relevant tariff and non-tariff measures aimed at the US “reciprocal tariffs.” Last week, US President Donald Trump accused China of breaching a truce on tariffs reached earlier this month.

The Eurozone Harmonized Index of Consumer Prices (HICP) fell by 1.9% year-over-year in May, below the ECB’s 2% target for the first time in eight months. Core HICP, excluding volatile items, declined by 2.3% YoY, down from 2.7% in the previous month.

As the HICP May’s inflation falling below the European Central Bank’s (ECB) target, it reinforces expectations that the central bank might cut rates this week. Financial markets had fully priced in the odds of the ECB reducing its Deposit Facility Rate by 25 basis points (bps) to 2% at the upcoming monetary policy meeting.

Untitled

Crypto Today: Bitcoin’s downside risks escalate as BTC spot ETF outflows extend

The cryptocurrency market is consolidating losses after starting the week amid high volatility. Bitcoin (BTC) attempted to steady the uptrend above $106,000 but lost steam, resulting in a reversal to $105,204 at the time of writing on Tuesday.

The drop in sentiment due to uncertainty in the global macroeconomic environment, as tariff tensions rattle investors, could be a major catalyst, escalating sell-side pressure on cryptos. Bitcoin spot Exchange Traded Funds (ETFs) registered their third consecutive day of outflows on Monday after breaking a persistent 10-day inflow trend last week.

Market overview: Profit taking and global trade uncertainty subdue crypto prices

Bitcoin’s reversal from new all-time highs of around $111,980 spread uncertainty in the crypto market, putting more brakes on the much-awaited altcoin season. Furthermore, trade tensions due to United States (US) tariff uncertainty have caused investors to become jittery or even quick to take profits, which hinders price recovery.

However, Crypto Finance’s outlook on Bitcoin suggests that this correction is healthy behavior and is often synonymous with price discovery phases.

“This price behavior is entirely logical—we are in a new phase of price discovery, and it is natural to see both profit-taking and hesitancy to chase the rally despite supportive headlines,” Crypto Finance said in Tuesday’s market outlook. “This dynamic is visible across both spot and derivatives markets,” the analysts added.

Meanwhile, Ethereum (ETH) paints a more stable technical structure compared to Bitcoin, supported by steady spot ETF inflows. CoinShares’ weekly digital asset report, released every Monday, highlighted that Ethereum led inflows, marking the strongest run since 2024.

“Ethereum Surges, Bitcoin Pauses: Ethereum led with US$321m in inflows — its best 6-week run since December 2024 — while Bitcoin saw a reversal mid-week, ending with US$8m in outflows,” CoinShares weekly report states.
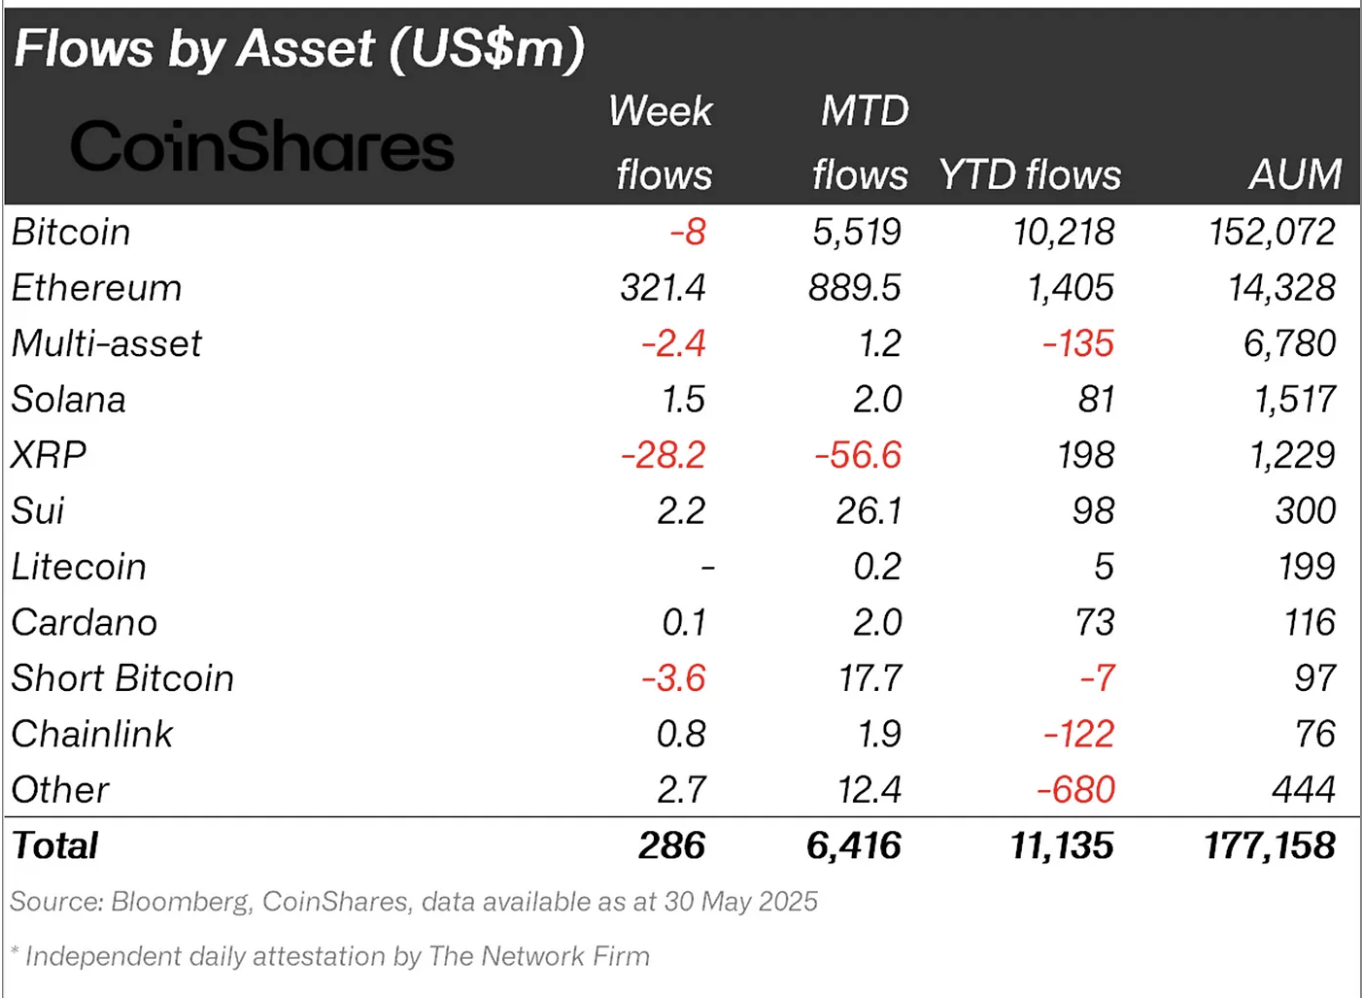
Digital asset fund flows | Source CoinShares

Data spotlight: BTC spot ETF outflows surge

Bitcoin spot ETFs saw approximately $268 million in net outflow volume on Monday, marking the third consecutive day of outflows in a row. As of May 29, BTC spot ETFs had sustained an impressive 10-day net inflow trend, as shown in the chart below. Apart from Bitwise’s BITB ETF, the rest of the ETF products licensed to operate in the US posted either net inflows or zero flows on Monday.
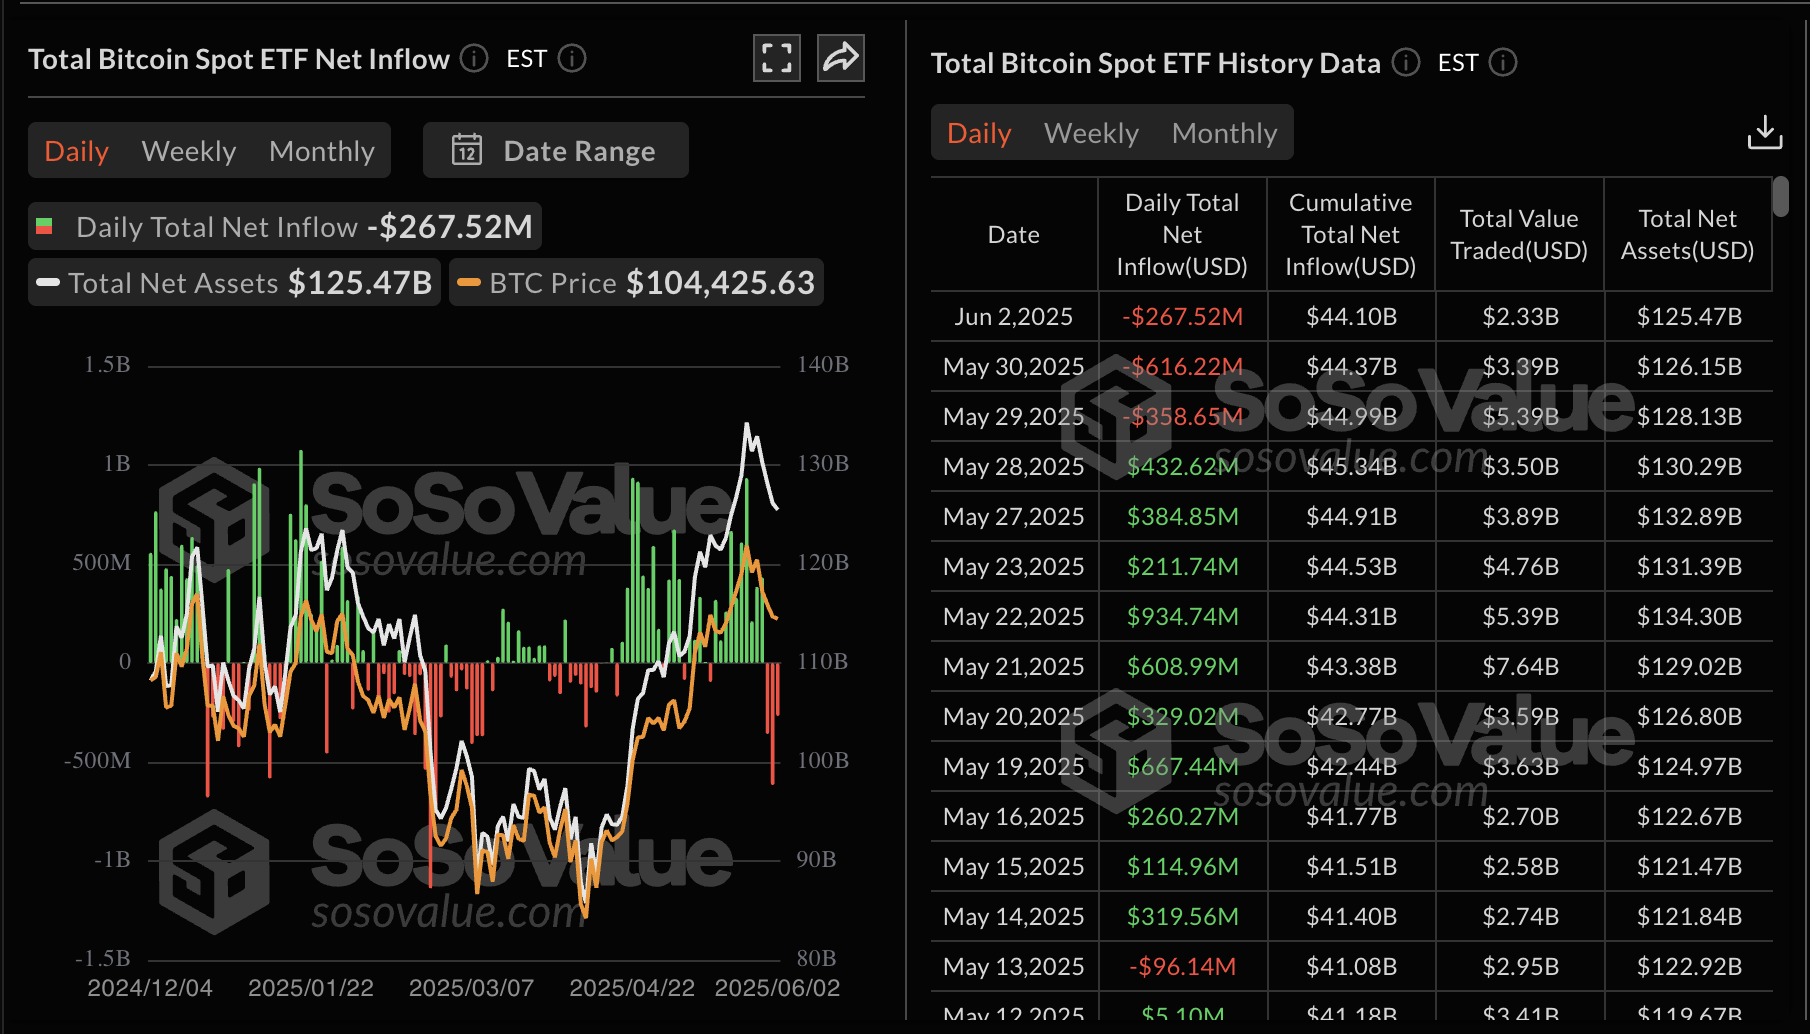
Bitcoin spot ETF stats | Source: SoSoValue 

Ethereum spot ETFs steady the inflow trend this week, recording over $78 million in net inflows on Monday. The 11-day net inflow trend has pushed the cumulative total net inflow to $3.12 billion. Interest in the largest smart contracts token has been on the rise since the Pectra upgrade in May, boosting sentiment while keeping the price elevated around the $2,600 support level.

“Ethereum led the pack this week, with another week of inflows totalling US$321m, bringing this 6 consecutive week run of inflows to US$1.19bn, its strongest run since December 2024, marking a decisive improvement in sentiment,” CoinShares weekly digital asset flows report highlights.
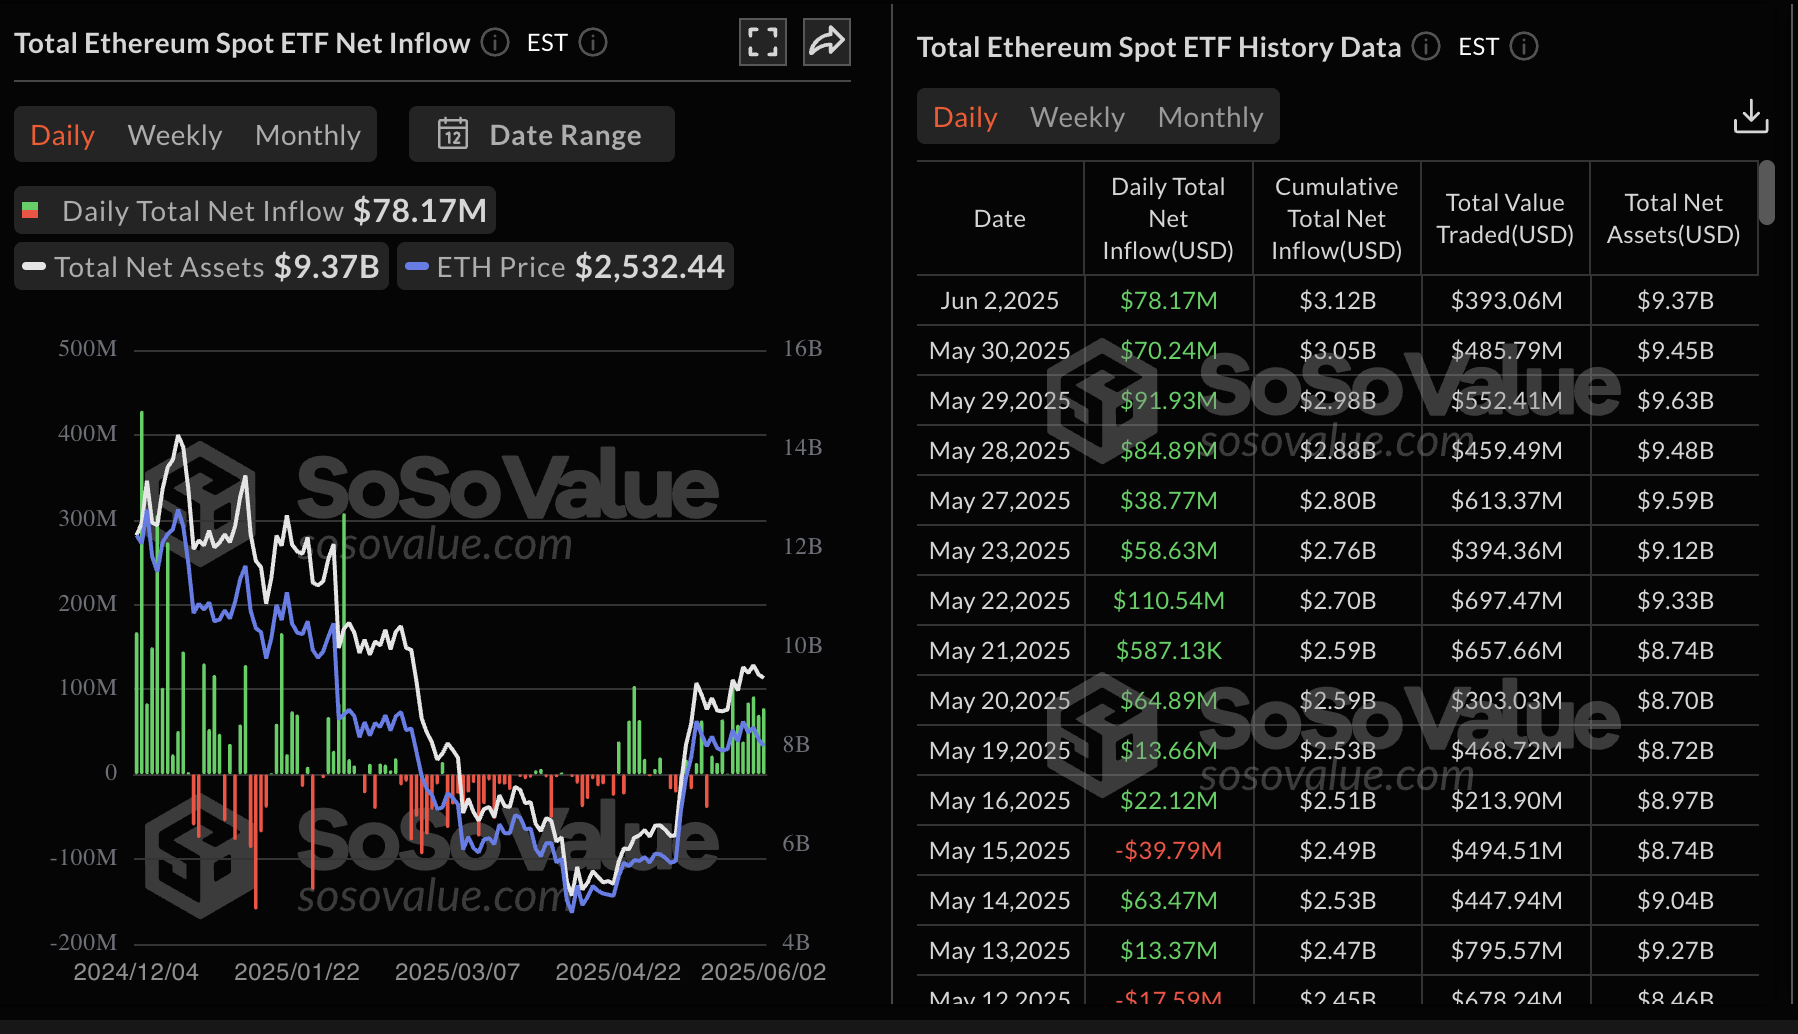
Ethereum spot ETF stats | Source: SoSoValue 

Chart of the day: Bitcoin faces growing downside risks

Bitcoin’s price hovers around $105,204 at the time of writing, down slightly on the day. The general outlook remains bearish, underpinned by the Moving Average Convergence Divergence (MACD) indicator, which has been maintaining a sell signal since May 25. This signal occurs when the blue MACD line crosses below the red signal line, making shorts attractive to traders. The expanding red histogram bars beneath the zero line (0.00) on the daily chart below suggest that sellers have the upper hand, at least for now.

Beyond the immediate support at the $105,000 round level, traders may want to pay attention to the area around $103,100, which was tested on Saturday. Other key levels to monitor for potential support include the 50-day Exponential Moving Average (EMA) at 100,633, the 100-day EMA at $96,366 and the 200-day EMA at $91,106.
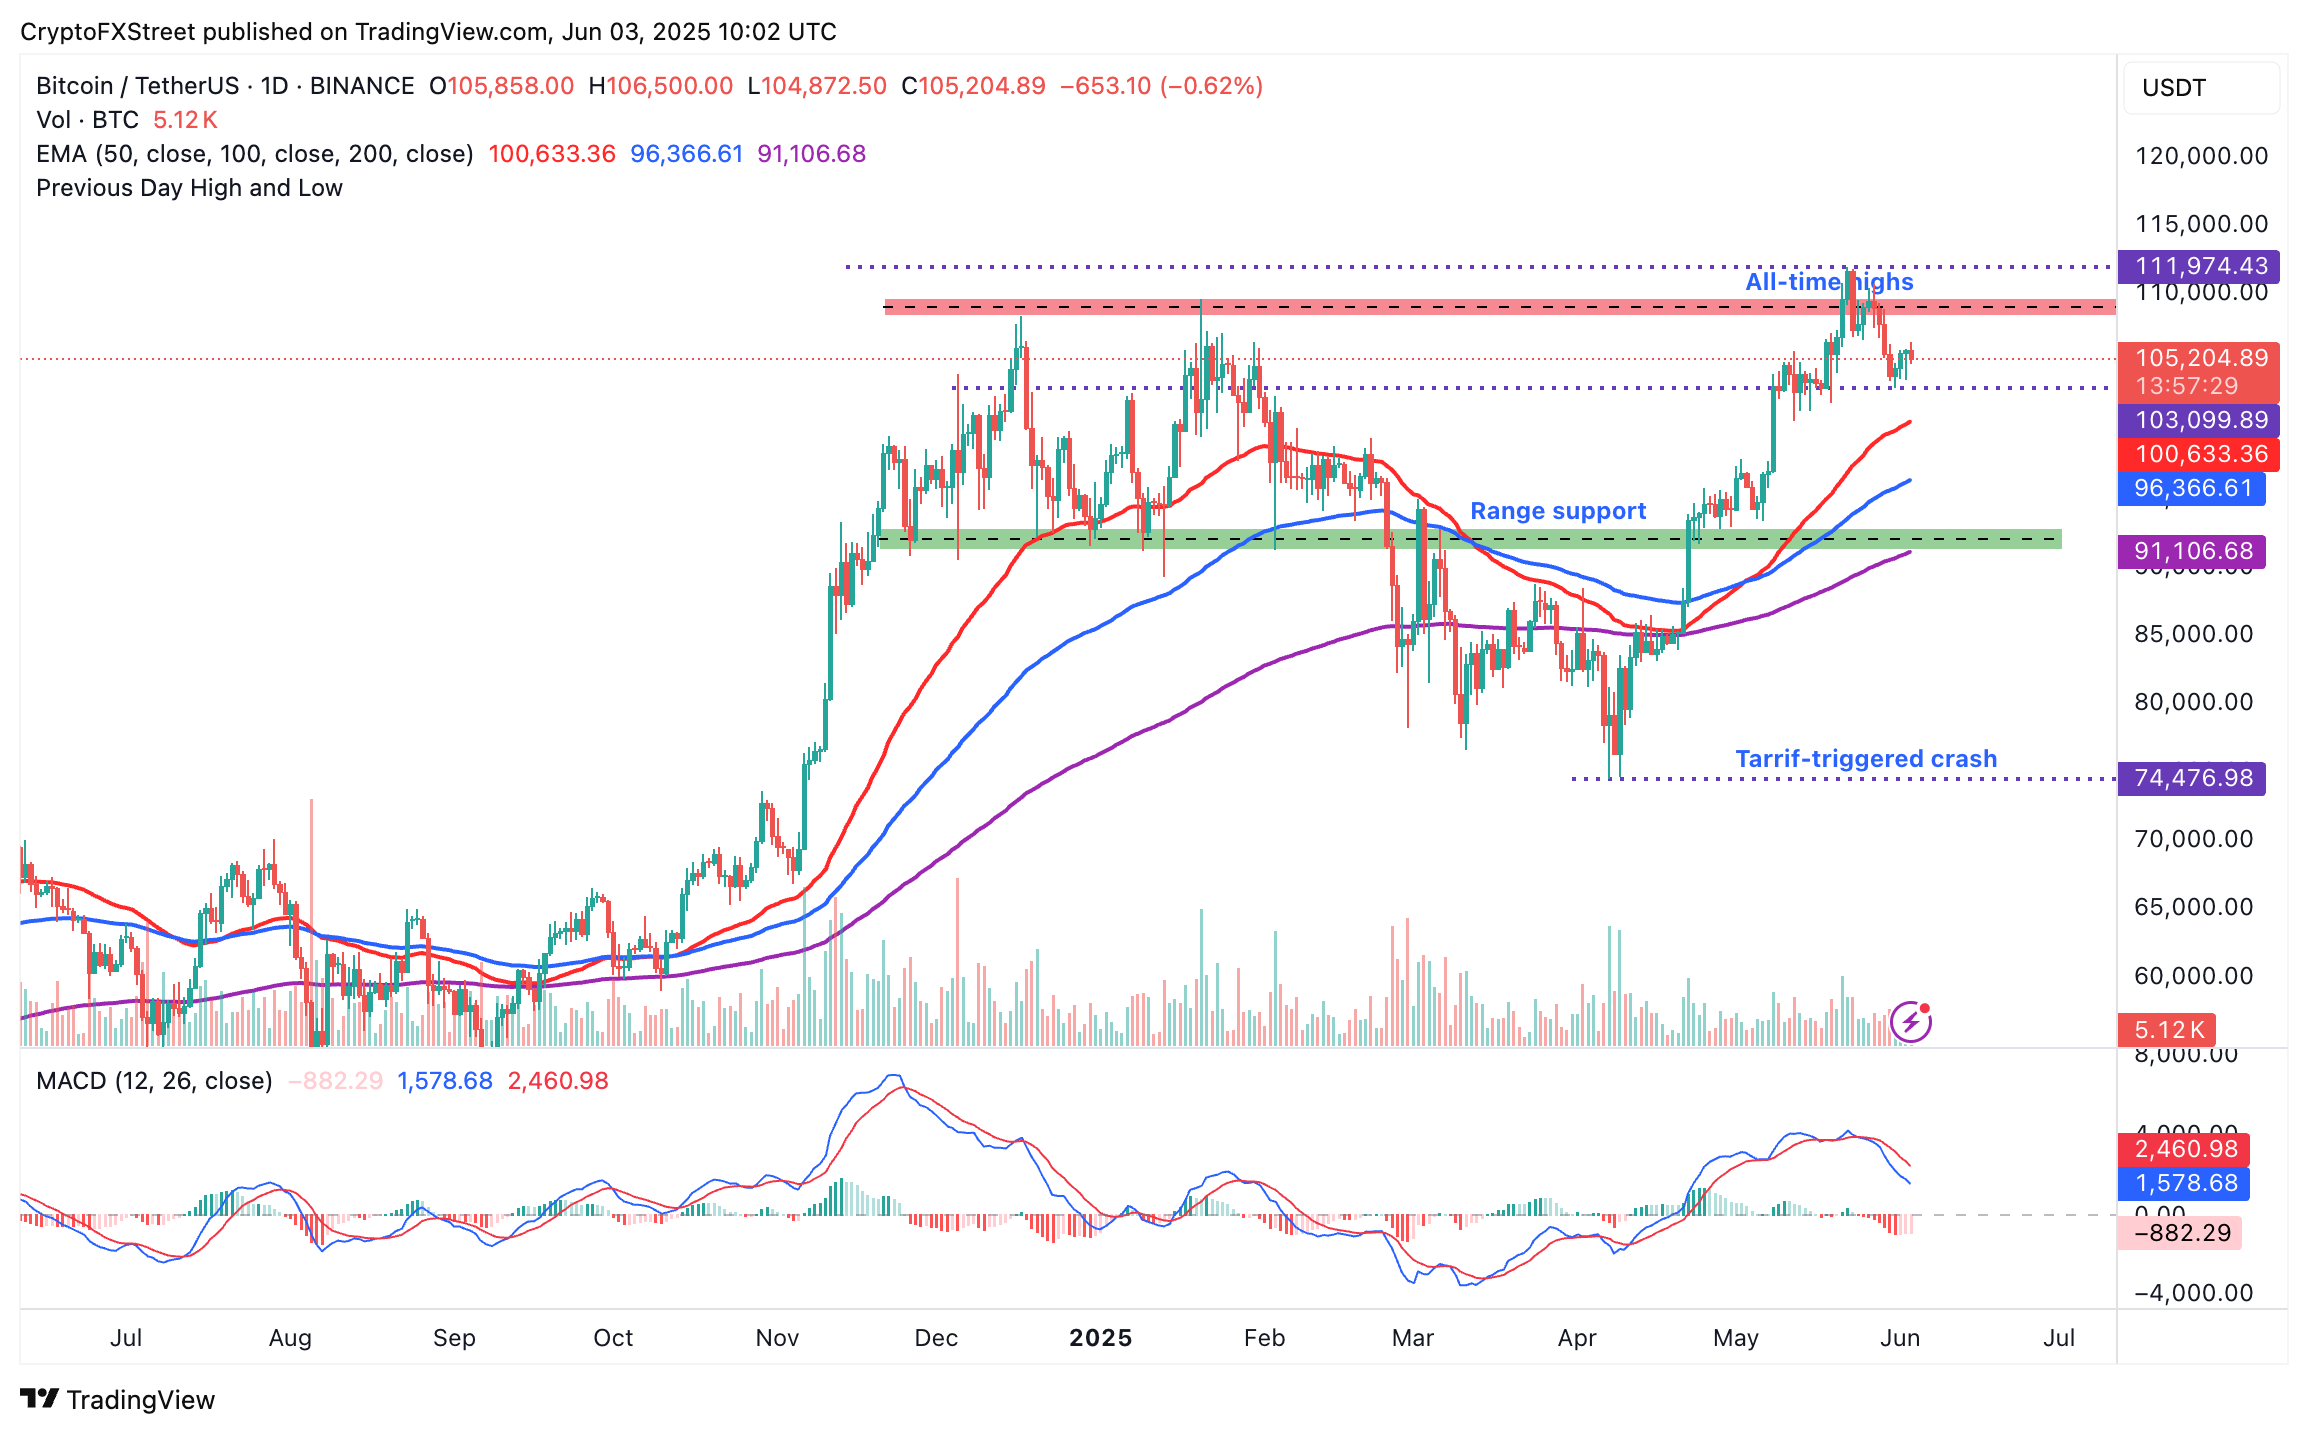
BTC/USDT daily chart

On the other hand, Ethereum is consolidating above the pivotal support level at $2,600, currently trading at $2,617 at the time of writing. The 200-day EMA reinforces the short-term range support at $2,459, which, if respected in upcoming sessions, could increase the probability of a breakout toward the coveted $3,000 target.
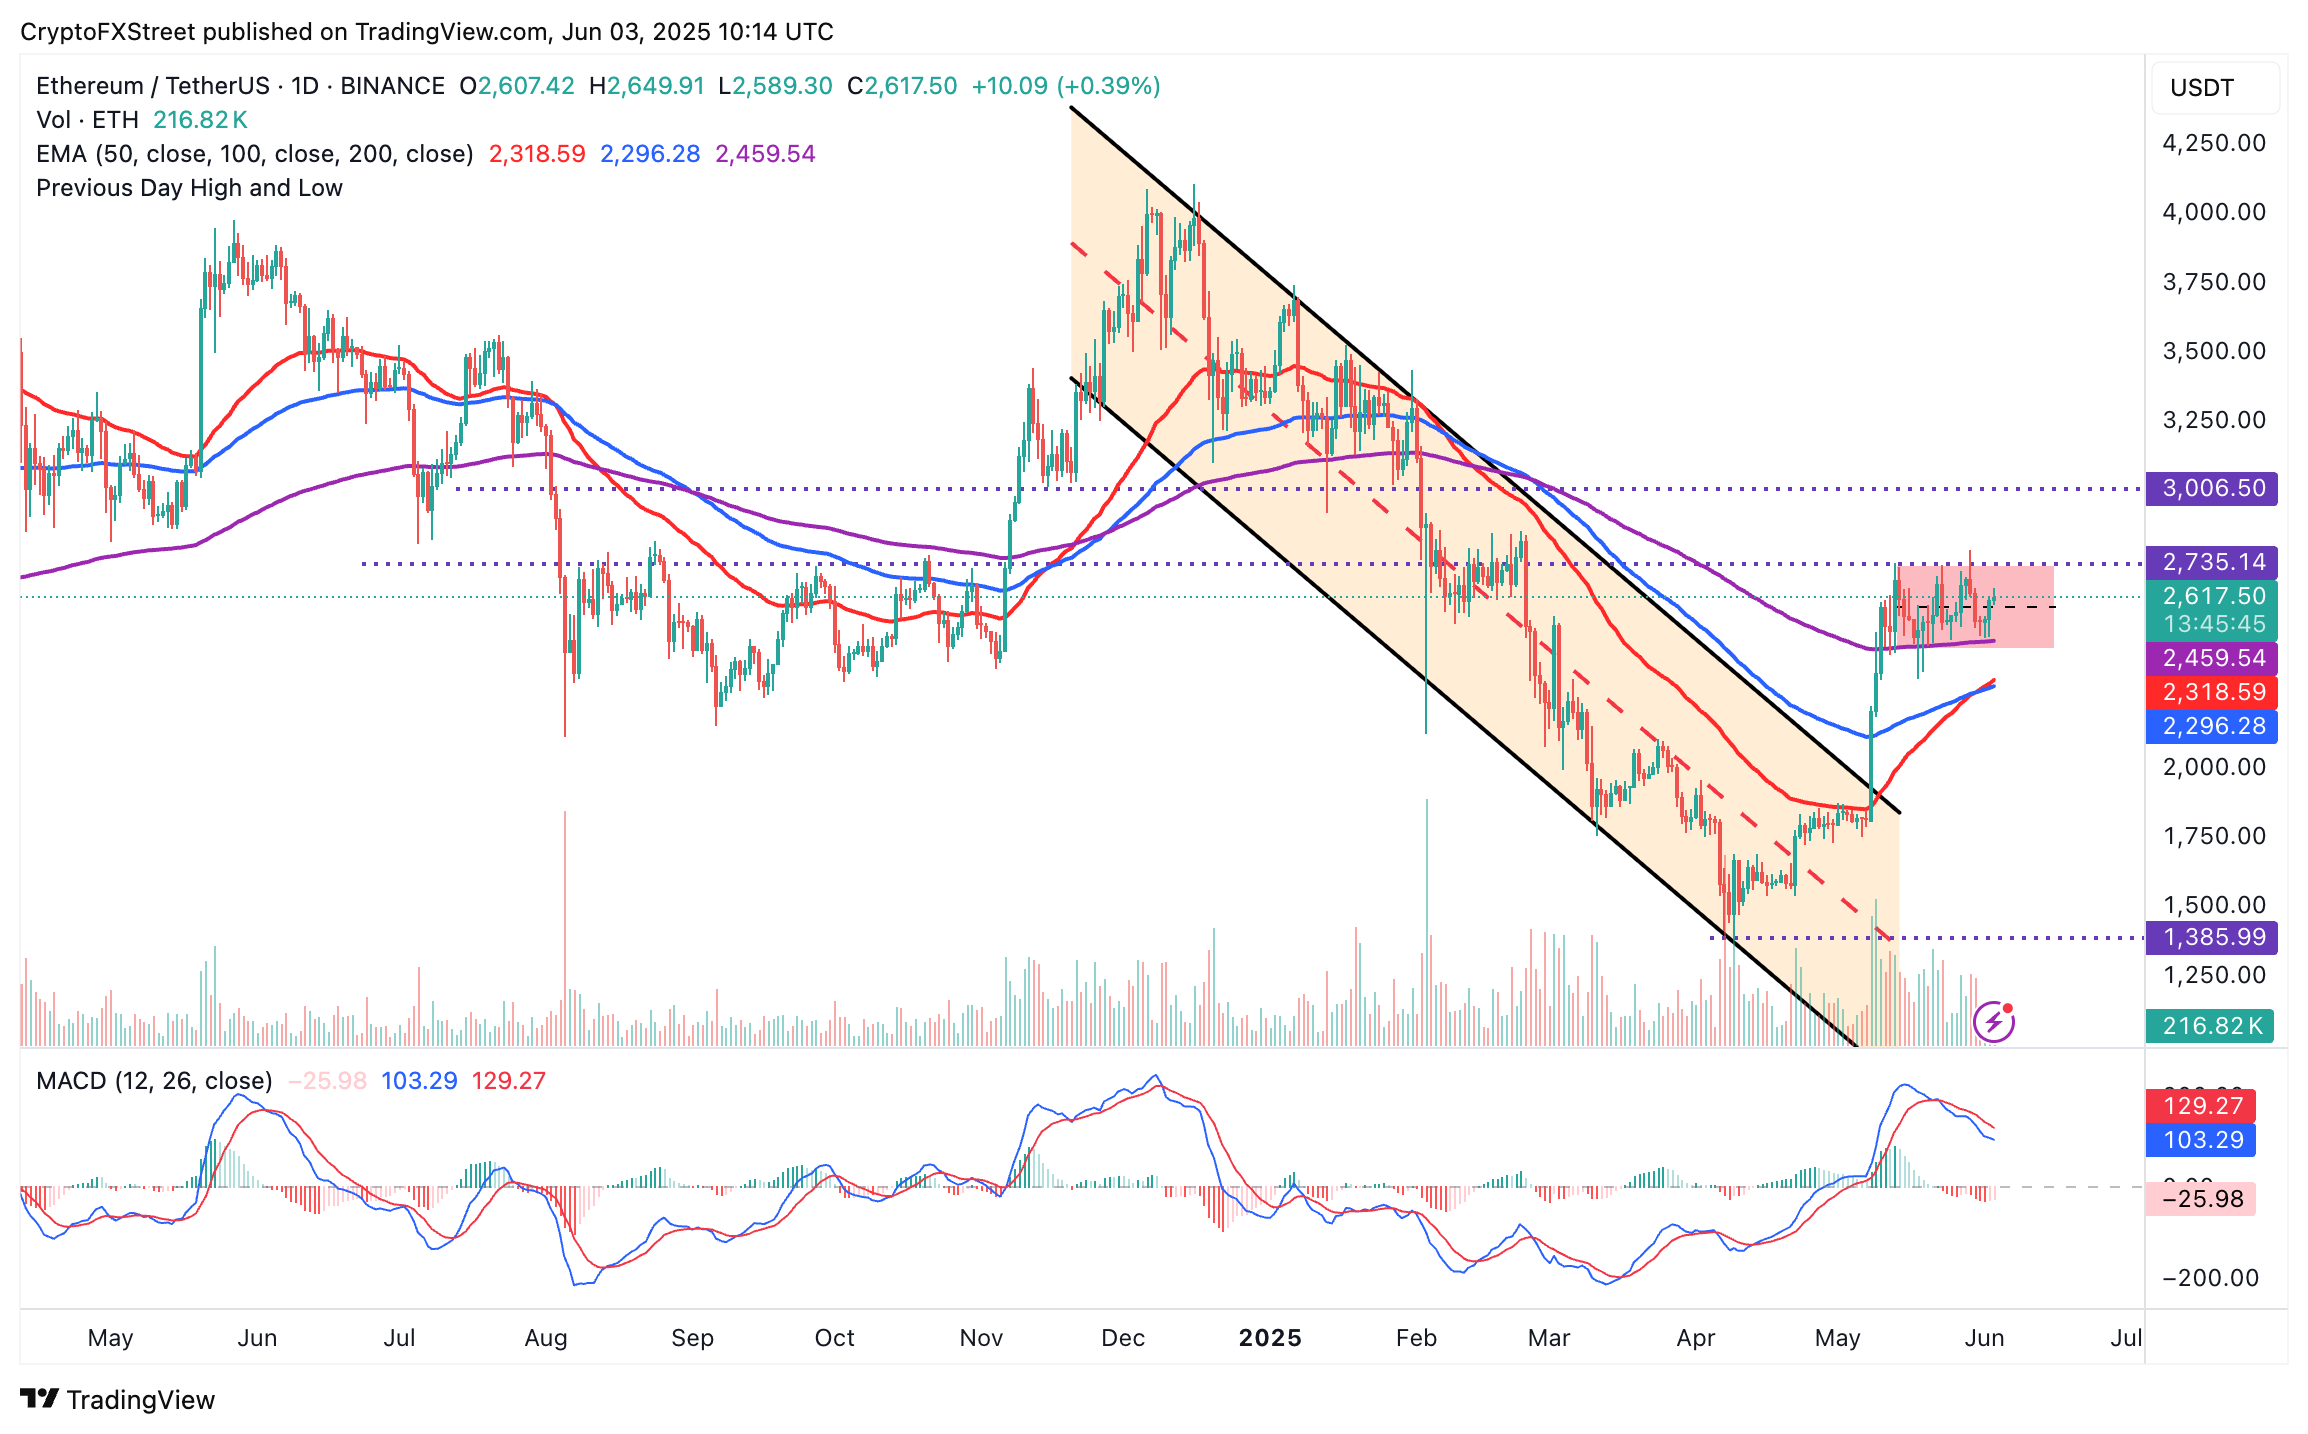
ETH/USD daily chart 

The 50-day EMA recently crossed above the 100-day EMA, validating a golden cross. This bullish outlook, alongside consistent inflows into Ethereum-based products, suggests strong bullish momentum. However, the downward-sloping MACD indicator, which signals a sell, calls for caution among traders this week.


Untitled

Gold eases from almost one-month high ahead of US JOLTS data, more Fed speak

Gold prices are experiencing a mild pullback after testing their highest levels since May 8 on Monday, as investors continue to digest trade-related headlines, including US President Donald Trump’s request that countries submit their trade offers by Wednesday and the possibility of a call between Trump and Chinese President Xi Jinping.

Looking at the US economic calendar, the JOLTS (Job Openings and Labor Turnover Survey) data report, scheduled for release at 14:00 GMT, will mark the start of a critical week of labor-related economic data.

This report is expected to provide further insight into labor market conditions. Expectations are for the number of job openings in April to decrease to 7.1 million from 7.192 million in March.

The release of the JOLTs data will be closely watched as it provides crucial signals regarding labor demand, which could influence the Fed’s decision-making on interest rates. Job openings and labor turnover are key indicators for the Fed as it assesses whether economic conditions warrant a shift in its monetary policy stance.

Additionally, Chicago Fed President Austin Goolsbee and Fed Governor Lisa Cook will speak during the US session, offering further insights into the economic and interest rate outlook for the United States. Participants are eagerly awaiting any hints regarding when the Federal Reserve might begin to reduce interest rates again after keeping them unchanged for many months.

According to the CME FedWatch Tool, market participants are currently pricing in a 57% chance of a rate cut in September. For June and July meetings, the expectation is that the Fed will maintain its benchmark rate at the current range of 4.25%-4.50%.

This data and commentary are crucial in shaping expectations for future monetary policy moves, especially as the Fed navigates the delicate balance between combating inflation and supporting employment growth.

Gold technical analysis: Finding support above $3,350

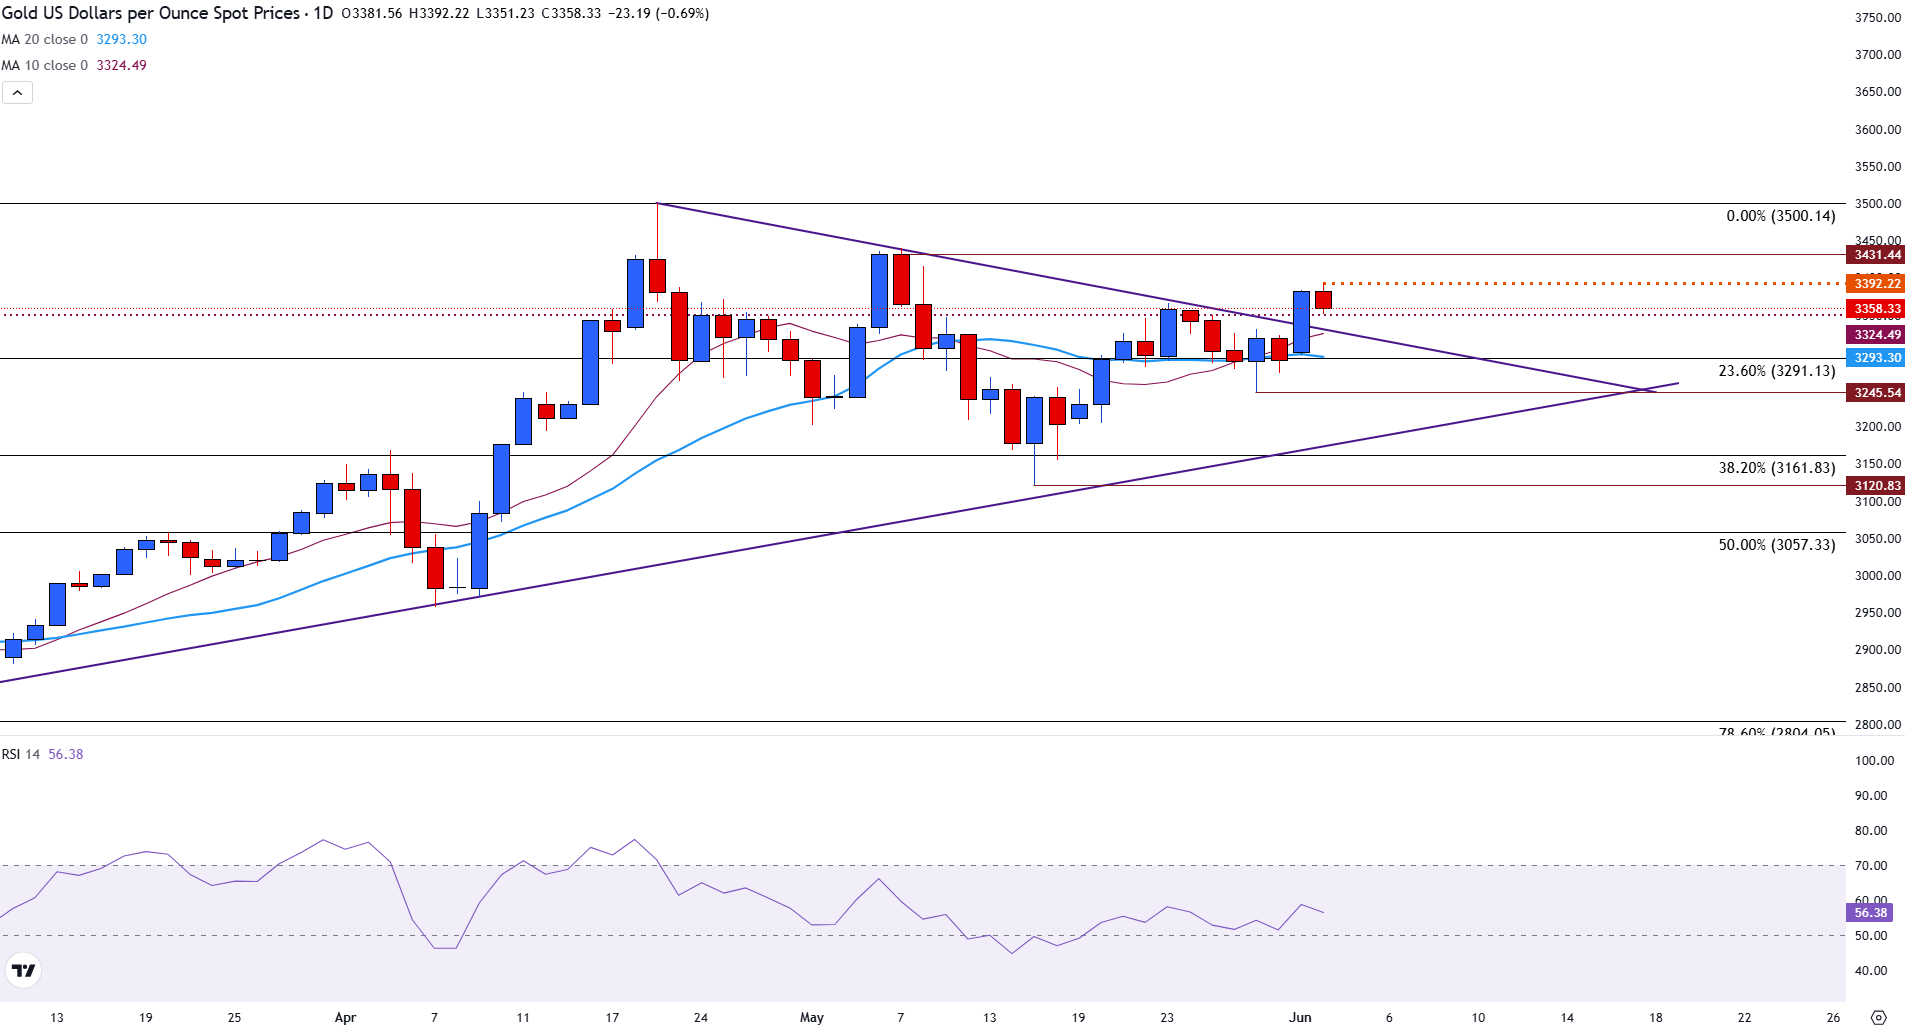
Gold prices are currently trading above the psychological level of $3,350, which is providing near-term support for the precious metal.

Following a 2.80% gain on Monday, prices broke above the upper-bound of the symmetrical triangle on the daily chart, supporting a surge in bullish momentum.

However, failure to retest $3,400, the next significant level of resistance required for a potential retest of the April $3,500 all-time high (ATH), limited the upside move.

With the Relative Strength Index (RSI) at 56, the momentum of the trend remains above the 50 neutral level, but is far from technically overbought.

With prices still exhibiting signs of strength, the near-term trajectory may be further influenced by technical levels.

For the upside potential, a break of $3,400 is crucial to reignite the momentum of the uptrend.

On the downside, the upper bound of the triangle aligns with the 10-day Simple Moving Average (SMA) at $3,324, with the $3,300 psychological level just below. At $3,293, the 20-day Simple Moving Average (SMA) is providing an additional layer of support, a break of which could bring the 23.6% Fibonacci retracement level of the January-April move near $3,291.

Gold daily chart


Silver price today: Silver rises, according to FXStreet data

Silver prices (XAG/USD) rose on Monday, according to FXStreet data. Silver trades at $33.37 per troy ounce, up 1.15% from the $32.99 it cost on Friday.

Silver prices have increased by 15.48% since the beginning of the year.

Unit measure Silver Price Today in USD
Troy Ounce 33.37
1 Gram 1.07

The Gold/Silver ratio, which shows the number of ounces of Silver needed to equal the value of one ounce of Gold, stood at 100.34 on Monday, up from 99.71 on Friday.

12

Bitcoin Price Forecast: BTC bears aim for $100k as escalation in Russia-Ukraine war sparks risk-off sentiment

Bitcoin (BTC) is extending its decline on Monday, trading below $105,000 at the time of writing after falling over 3% last week. The largest cryptocurrency by market capitalization weakens as geopolitical tensions escalate, with the Russia-Ukraine conflict intensifying and driving investors toward safe-haven assets. Moreover, Bitcoin spot Exchange Traded Funds (ETFs) recorded a modest outflow last week, while MetaPlanet adds 1,088 BTC to its treasury.

Risk-on sentiment fades as geopolitical uncertainty increases

BBC reports on Monday that Ukraine completed its biggest long-range attack of the war with Russia on Sunday, targeting four airbases and damaging 40 Russian warplanes.

The covert operation, the so-called “Spider’s Web,” used 117 drones, striking 34% of Russia’s strategic cruise missile carriers, said Ukraine’s President Volodymyr Zelensky.

Russia confirmed these attacks in five regions, calling them a “terrorist act,” reports BBC.

The peace talks between the two countries are set to resume in Istanbul on Monday, but the likelihood of negotiations yielding meaningful progress toward ending the Russia-Ukraine war is slim.

These rising war tensions and geopolitical uncertainties are driving investors toward safe-haven assets, such as Gold (XAU), which brings a risk-off sentiment to the market, not boding well for the Bitcoin price.

Institutional flow raises some early signs of concern 

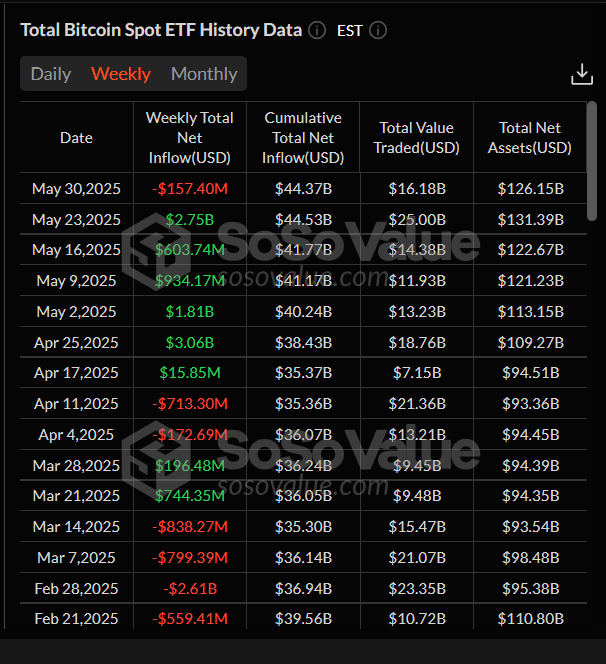
Institutional demand for Bitcoin weakened last week. According to SoSoValue data, Bitcoin spot ETFs experienced a mild outflow of $157.40 million last week, marking a break in their long-standing weekly streak of inflows since mid-April. This outflow is weak as compared to the flow seen during Feburary. However, if this outflow intensifies, then the Bitcoin price could see a sharp decline in the upcoming days.

Total Bitcoin Spot ETFs weekly chart. Source: SoSoValue

Total Bitcoin Spot ETFs weekly chart. Source: SoSoValue

Despite signs of weakness in Bitcoin ETFs, Japanese investment firm Metaplanet announced on Monday that it had purchased an additional 1,088 BTC. The firm currently holds a total of 8,888 BTC. If the corporate companies’ demand for BTC continues, it could act as a cushion for any price dips in Bitcoin prices.

What is there for Bitcoin in June?

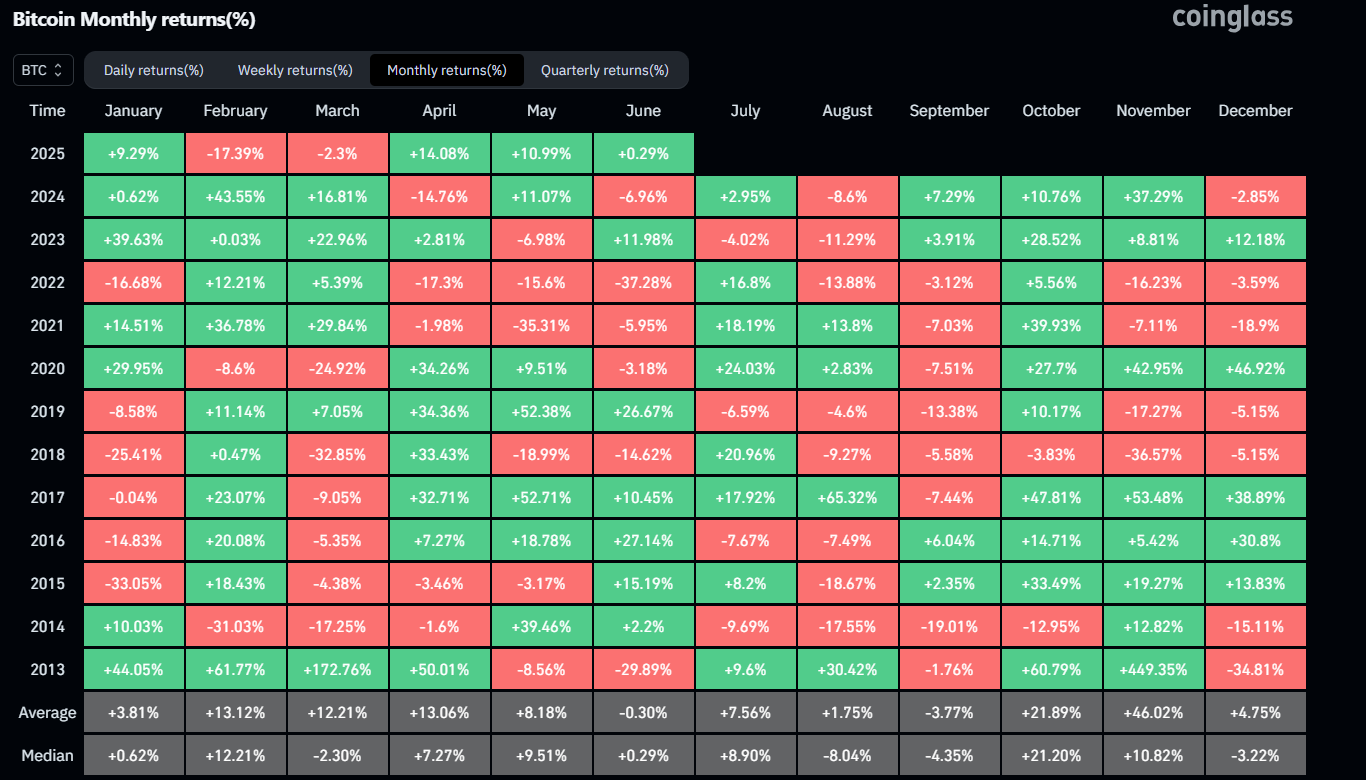
Bitcoin reached a new all-time high of $111,980 in May, marking a return of nearly 11% for the month. According to Bitcoin’s historical data, BTC generally yielded the second-lowest return for traders in June, averaging a loss of 0.30%. If the ETFs’ demand continues to weaken, holders realize profits (increasing selling pressure), and tariffs and geopolitical uncertainty gain momentum, traders should be cautious of a correction in June.

Bitcoin historical monthly returns chart. Source: Coinglass

Bitcoin historical monthly returns chart. Source: Coinglass

Bitcoin Price Forecast: BTC bears target $100k mark

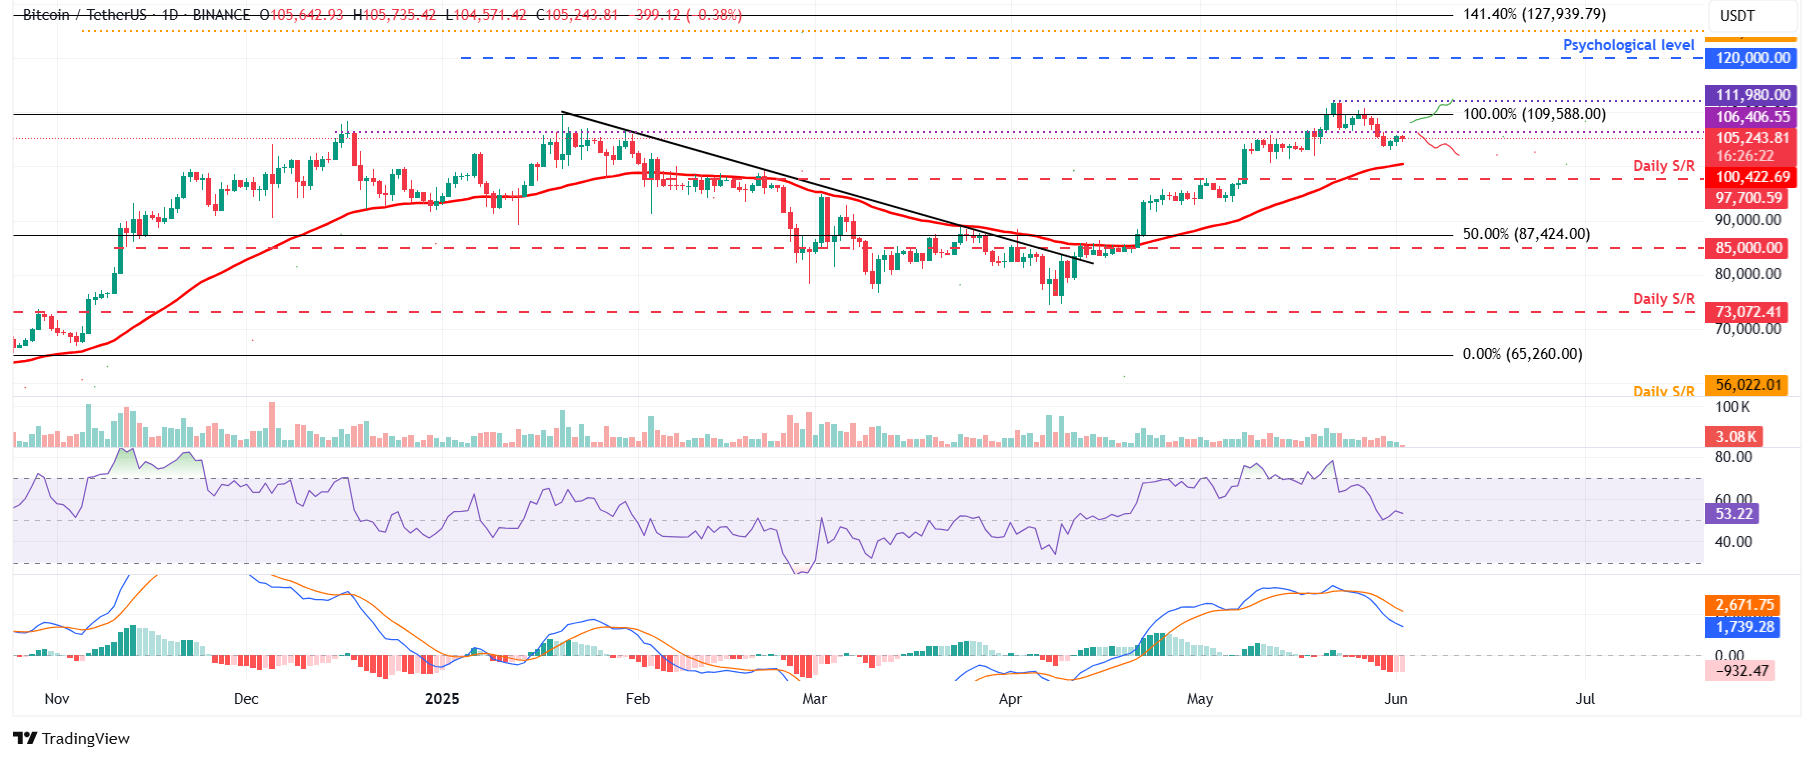
Bitcoin price closed below the daily support level of $106,406 on Thursday and declined by 1.50% the following day. However, it recovered slightly during the weekend. At the time of writing on Monday, BTC trades below $105,500.

Suppose BTC faces resistance around the $106,406 daily level and continues its correction. It could extend the decline to revisit the psychologically important level of $100,000.

The Relative Strength Index (RSI) on the daily chart reads 53, pointing downward toward its neutral level of 50, indicating fading bullish momentum. The Moving Average Convergence Divergence (MACD) also showed a bearish crossover last week. It also shows rising red histogram bars below its neutral level, indicating a correction ahead.

BTC/USDT daily chart


SUI Price Forecast: Fallout from triangle pattern could lead to further losses toward $2.70

SUI Price Forecast: Fallout from triangle pattern could lead to further losses toward $2.70

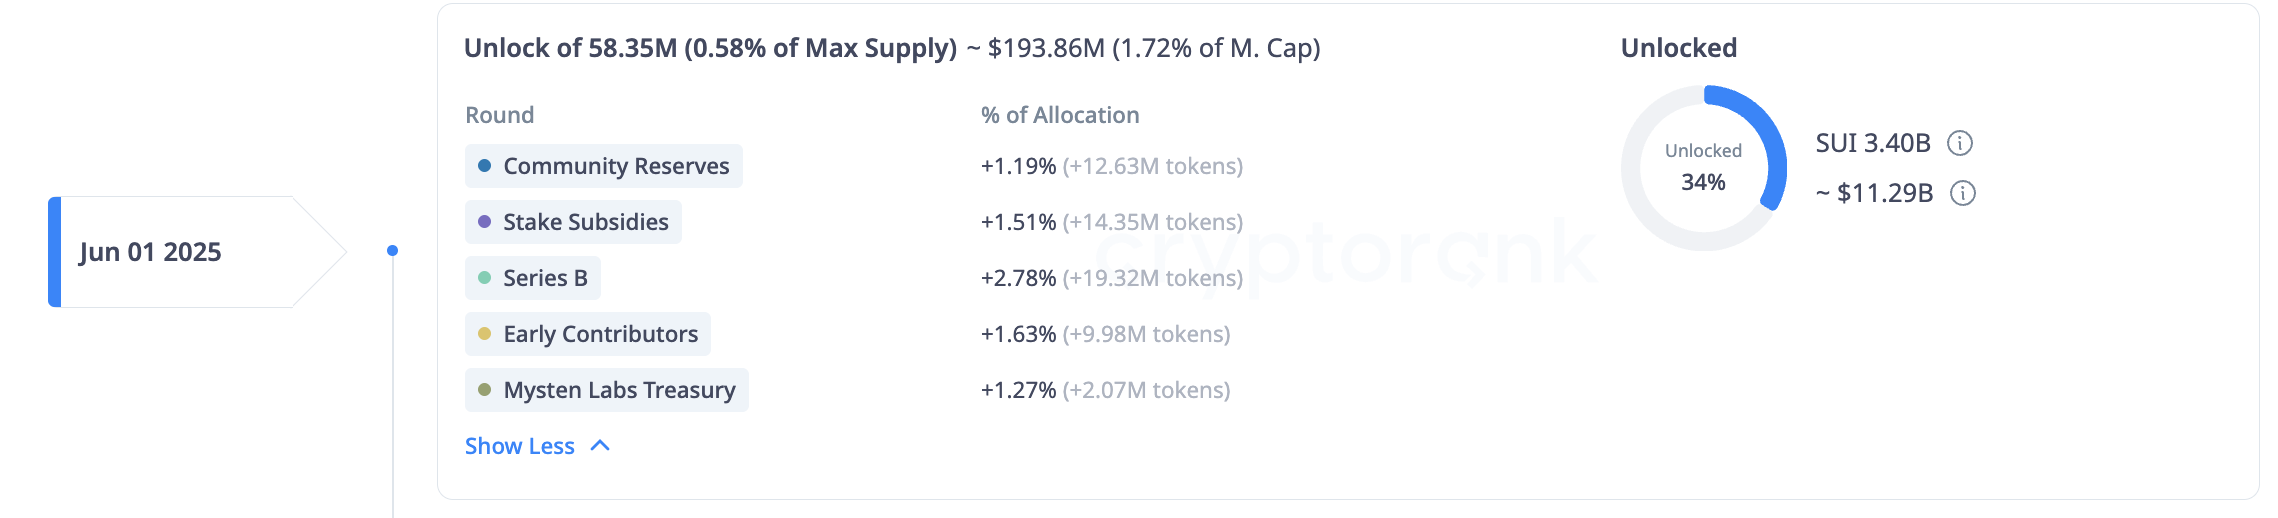
Sui (SUI) is down over 1.50% at press time on Monday after three consecutive weekly closings on a bearish note. As Sui survives the 58.35 million tokens unlocked on Sunday, avoiding a panic sell-off, a potential fallout from a triangle pattern could extend the losses to $2.71.

Sui price holds above $3 within a triangle pattern

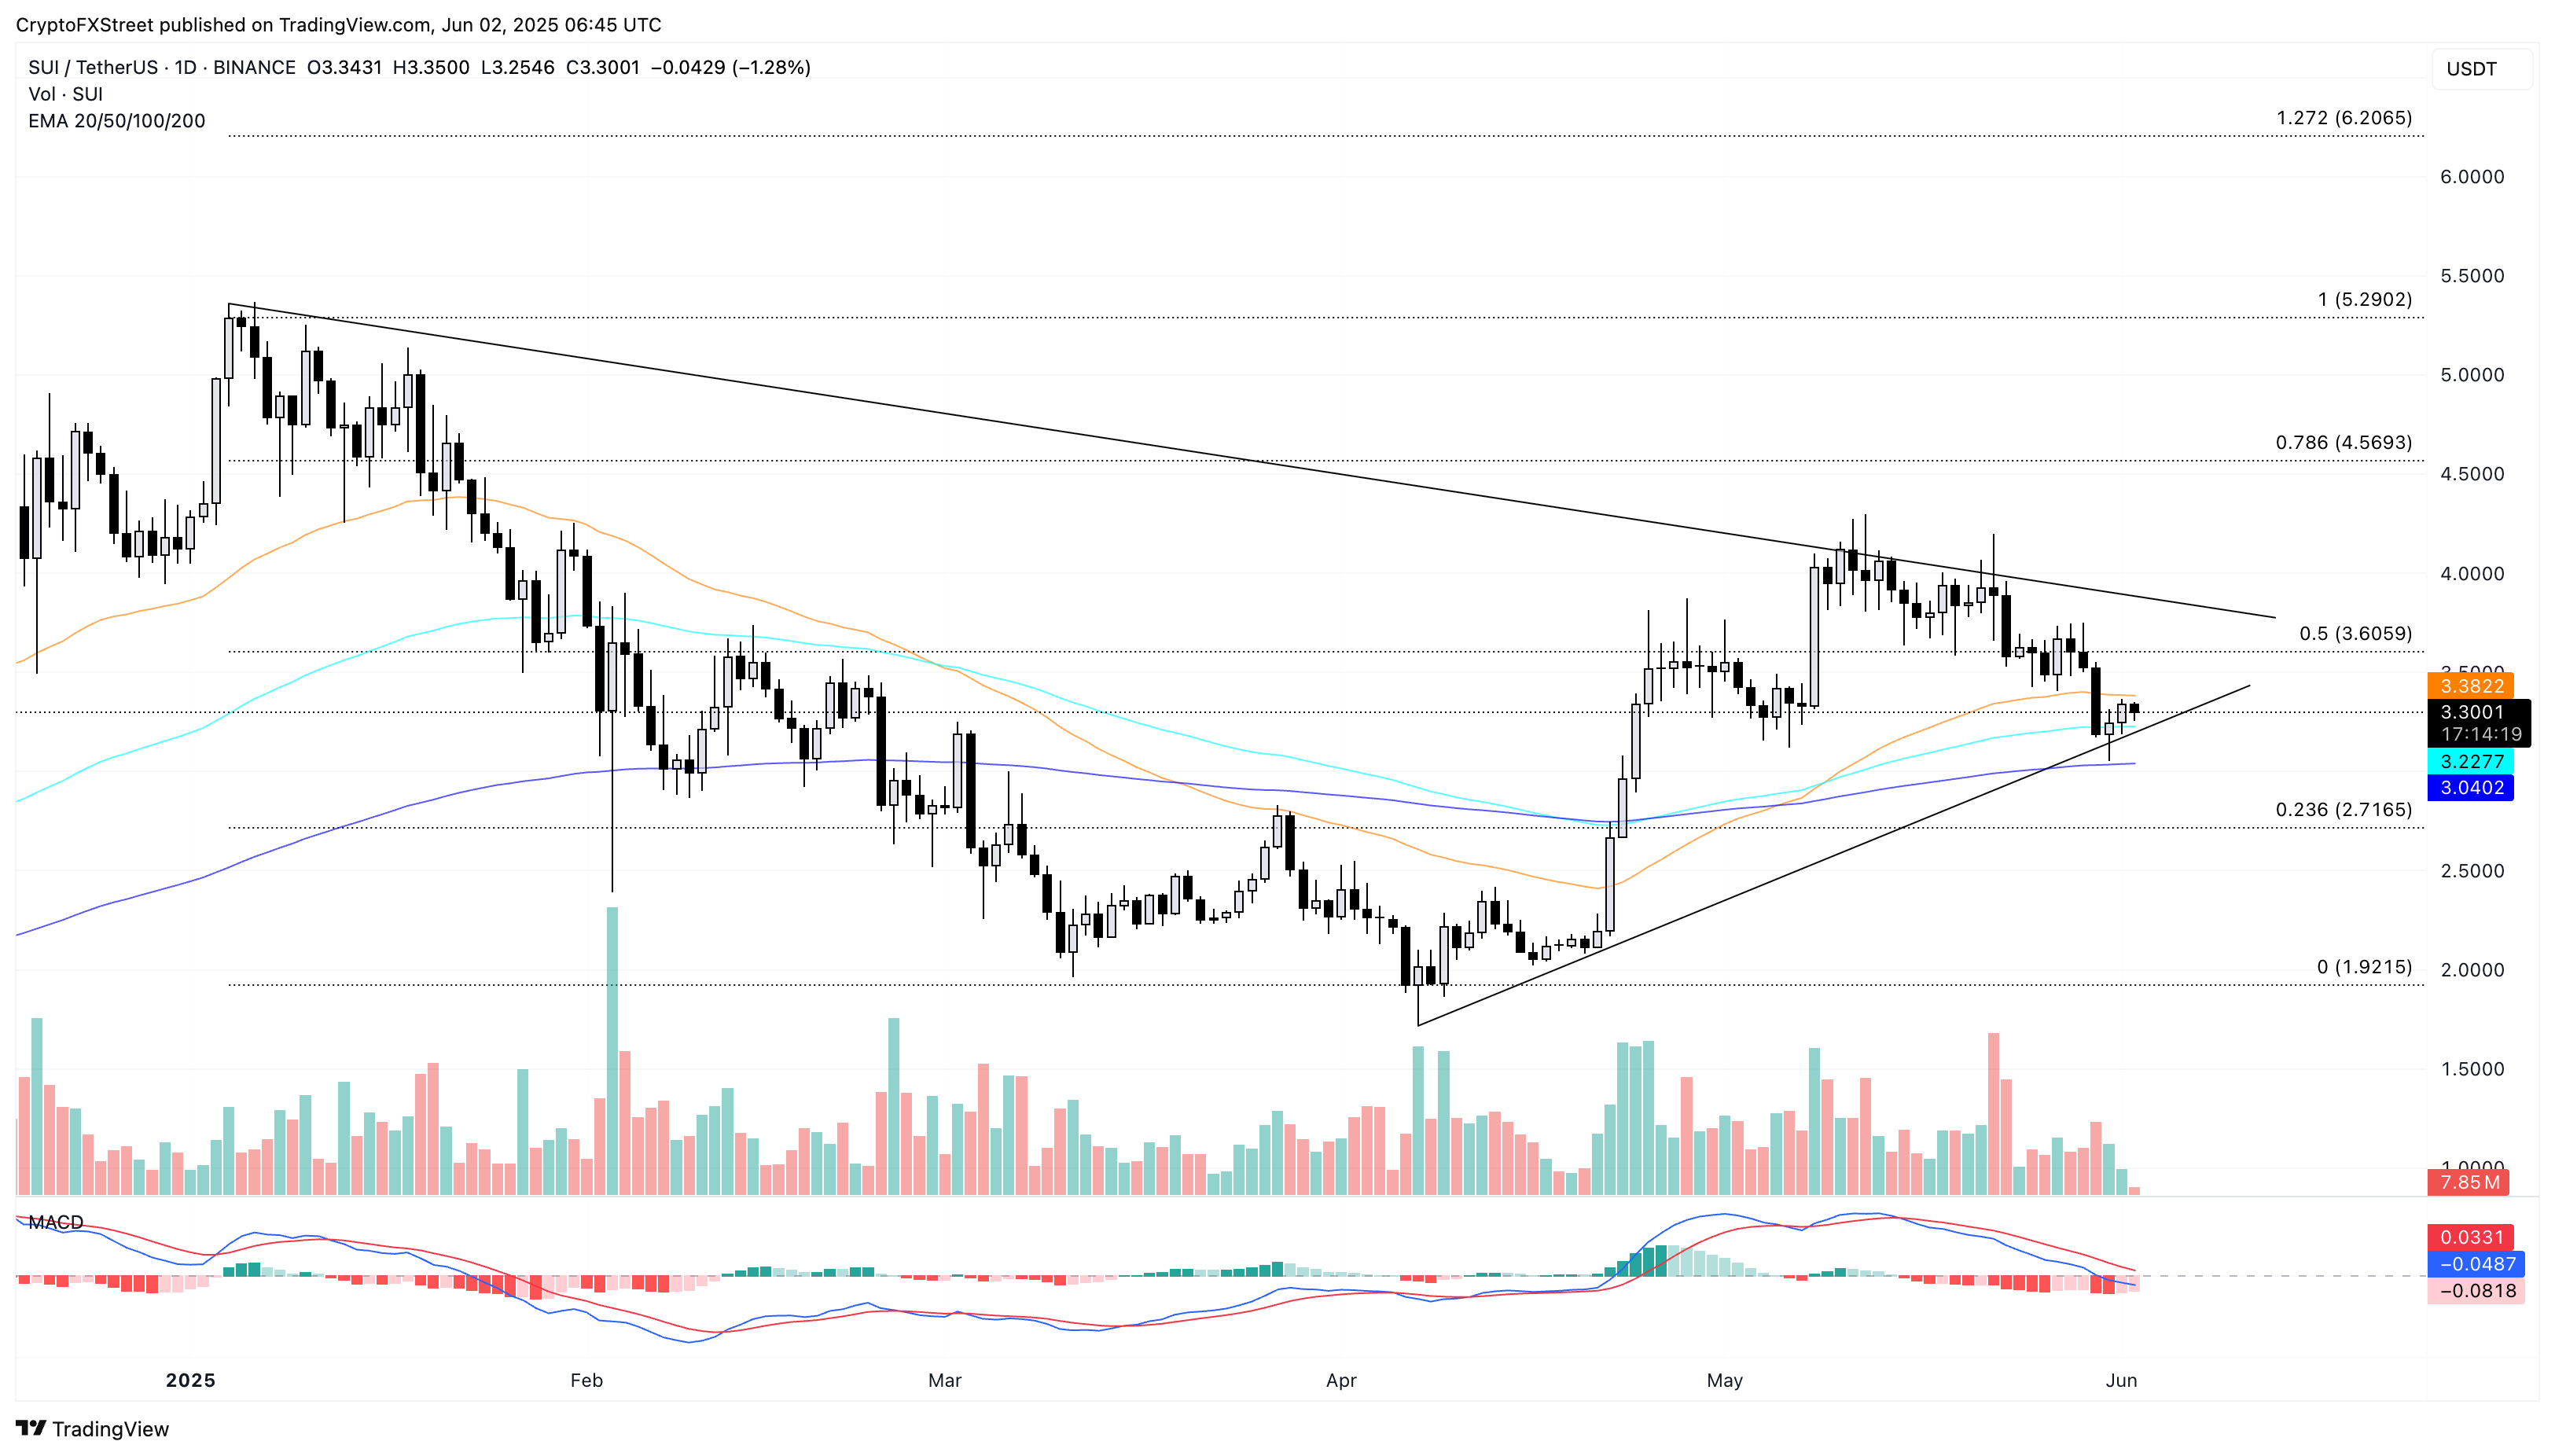
Sui trades at $3.30 at the time of writing on Monday, projecting a weak start to the week with an intraday pullback. However, the nearly 5% rise over the weekend helps Sui bounce back from a rising support trendline formed by the lows of April 7 and April 20.

The price action also lights a sloping resistance trendline with lower highs on January 4, May 10, and May 22. With the converging trendline, Sui’s daily price chart develops a symmetrical triangle pattern.

Despite the short-term surge on weekends, the altcoin is down by 16% over the last three weeks as it reverses south within the triangle pattern. Holding above the lower trendline, Sui takes an early reversal from the 200-day Exponential Moving Average (EMA) at $3.04 and resurfaces above the 100-day EMA at $3.22.

With bulls holding grounds near the $3 mark, the minor recovery pushes the Moving Average Convergence/Divergence (MACD) line closer to its signal line, hinting at a bullish crossover. A potential crossover will help the indicator lines sustain in the positive territory and stage a revival in bullish momentum.

If the prevailing downfall continues, a clean push in Sui closing below the 100-day EMA at $3.22 could result in the triangle pattern’s fallout. In such a case, the 200-day EMA at $3.00 acts as the immediate support, followed by $2.71, the 23.6% Fibonacci retracement level from $5.29 on January 4 to $1.92 on April 7.

On the other hand, Sui could face headwinds at the $3.60 resistance, aligning with the 50% Fibonacci retracement level if it continues its bullish cycle within the pattern. A potential cloning above that level could challenge the resistance trendline near $3.80.

Upcoming token unlocks warn of excessive supply

On Sunday, the Sui Foundation unlocked 58.35 million SUI tokens worth $194.09 million, liquidating the market with 0.58% of the maximum SUI supply. The recent unlock is part of a linear unlock process, which has been releasing more SUI supply over the preceding months. On July 1, the upcoming unlock will release another batch of 58.35 million tokens, followed by monthly unlocks of 56.91 million SUI till October 1.

Currently, Sui holds a circulating supply of 3.396 billion SUI or 33.96% of the maximum 10 billion supply. With the incoming unlocks, Sui could crumble under excessive supply, leading to potentially steeper corrections.