gbp

GBPUSD Succumbs to Negative Pressures

The GBPUSD price declined in its recent intraday trading after the stability of the current resistance level at 1.3280, alongside the formation of a bearish divergence on the relative strength indicators after reaching deeply overbought levels and beginning to produce negative signals, which has intensified the negative pressures.


This comes amid continued negative pressure resulting from trading below EMA50, which is acting as dynamic resistance and reinforcing the dominance and stability of the main short-term downtrend.

jpy

EURUSD Declines Along a Bearish Trend Line

The EURUSD price declined in its recent intraday trading, amid continued negative pressure resulting from its trading below EMA50, which acts as dynamic resistance and reinforces the dominance of the main short-term bearish trend, as the price moves along a descending trend line supporting this path, increasing the selling pressure surrounding it.


On the other hand, positive signals are emerging from the relative strength indicators, but they have yet to be reflected in the price performance, signaling that the negative pressures remain strong and continue to dominate its intraday movements.

OIL_15

Crude Oil Price Posts Limited and Cautious Gains

The crude oil price rose in its recent intraday trading, attempting to recover, but it continues to move along a short-term corrective descending trend line, which limits the chances of a full recovery in the near term, especially with continued negative pressure resulting from trading below EMA50, intensifying the bearish pressures.


In addition, these movements come amid negative signals from the relative strength indicators after reaching deeply overbought levels, increasing the likelihood of a decline in the coming period.

images

Gold Price Under Downtrend Pressure Despite Oversold Conditions

The gold price continues to record consecutive losses in its recent intraday trading, amid continued negative pressure resulting from trading below EMA50, which acts as dynamic resistance and reinforces the dominance of the short-term corrective downtrend, especially as the price moves along a descending trend line supporting this path.


On the other hand, the relative strength indicators have started to show positive signals after reaching deeply oversold levels, which may curb the pace of the decline as the price needs to unwind some of these oversold conditions. This could help it attempt to recover part of its previous losses.

how-to-identify-and-trade-the-rejection-candle-pattern1

Fed vs BoJ: Both hiked. The market only believes one of them – and the chart shows which

The Federal Reserve (Fed) and the Bank of Japan (BoJ) have just done something remarkably similar. Both central banks raised interest rates by 25 basis points (bps) last week, both are confronting inflation risks, and both signal that future decisions will depend on incoming economic data.

On paper, the two decisions appear to tell the same story: Monetary policy is becoming tighter on both sides of the Pacific. Markets, however, rarely trade on the headline alone.

What investors believe will happen next can matter much more than what a central bank has just done. And once the market reaction following the two decisions is brought into the picture, the apparent similarity between the Fed and the BoJ begins to disappear.

The USD/JPY chart makes that divergence difficult to miss.

The USD/JPY chart reveals which rate hike markets believe

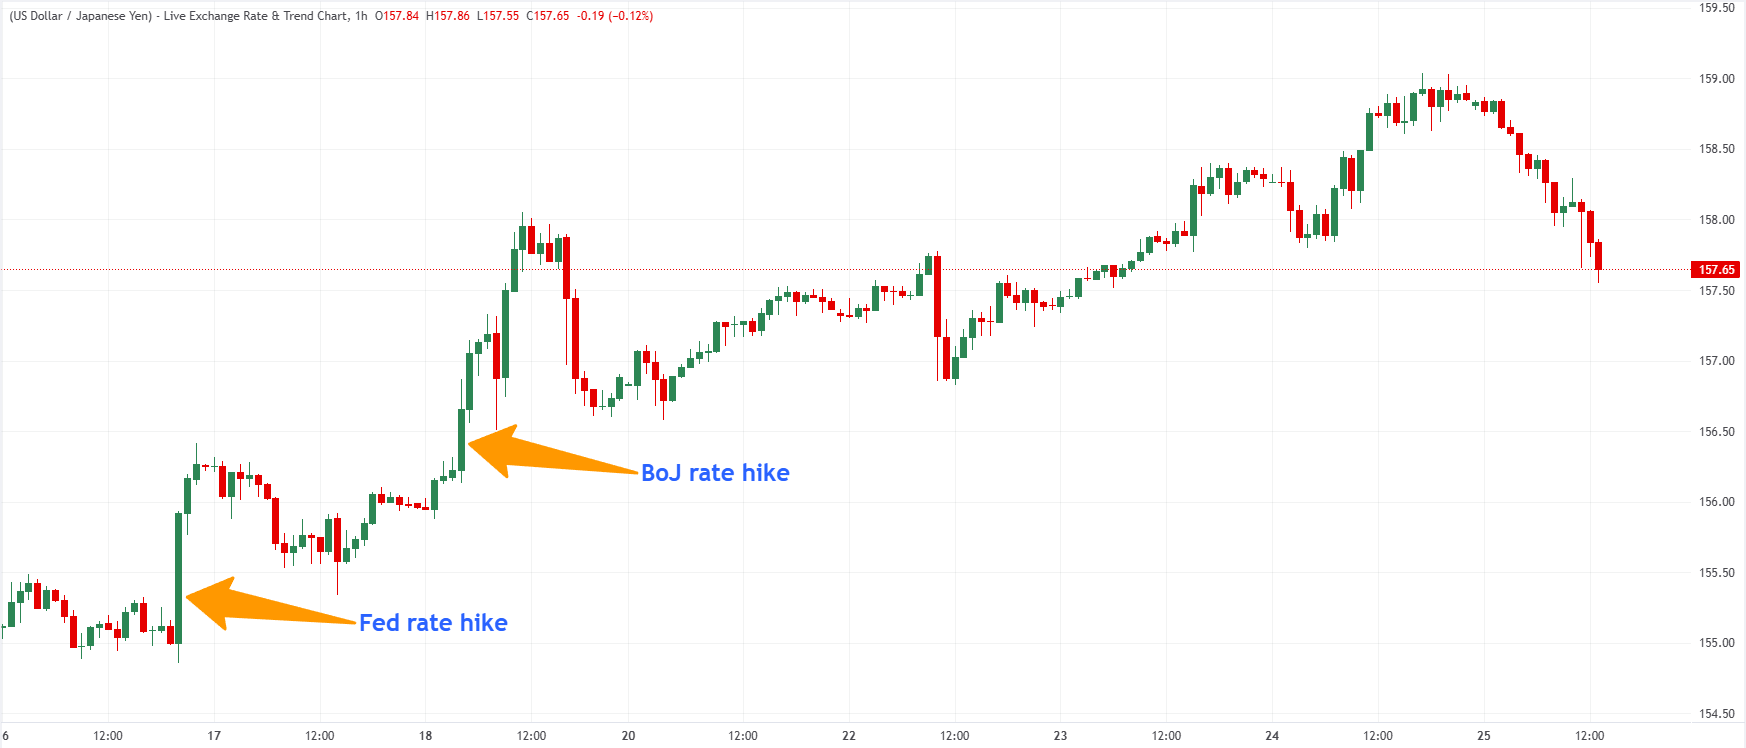
The Fed raised interest rates by 25 bps on Wednesday, September 16, taking its target range to 3.75%-4.00%. Two days later, on Friday, September 18, the BoJ followed with its own 25-basis-point increase, lifting its policy rate to 1.25%, the highest level in 31 years.

However, USD/JPY rose after the two central-bank decisions, clearly indicating how investors interpreted them.

USD/JPY hourly chart. Source: FXStreet

A rising USD/JPY means that the US Dollar (USD) is appreciating against the Japanese Yen (JPY), and that the JPY is weakening. In other words, even though both central banks tightened policy by the same 25 bps, the currency market treated the two decisions very differently.

That reaction is particularly striking on the Japanese side. The BoJ raised its policy rate to 1.25%, its highest level in 31 years. Higher interest rates would normally be expected to make a currency more attractive by increasing returns on assets denominated in that currency. Yet the Japanese Yen weakened after the decision.

The explanation lies less in the rate hike itself than in what accompanied it.

The BoJ approved the increase by a 7-2 vote, with board members Toichiro Asada and Ayano Sato opposing the move. Governor Kazuo Ueda also provided no clear timetable for another increase, leaving investors uncertain about how quickly the central bank is prepared to continue normalizing monetary policy.

Ray Attrill, head of FX strategy at National Australia Bank, told Reuters that the BoJ had “clearly underwhelmed versus expectations,” noting that the two dissenting votes raised additional questions about the strength of the central bank’s tightening consensus.

The market, therefore, received a rate hike, but not necessarily the promise of a forceful hiking cycle.

The Fed delivered the same hike but a very different signal

The Fed also raised interest rates by 25 bps, taking the fed funds rate target range to 3.75%-4.00%. The size of the move was identical to the BoJ’s. The message surrounding it was not.

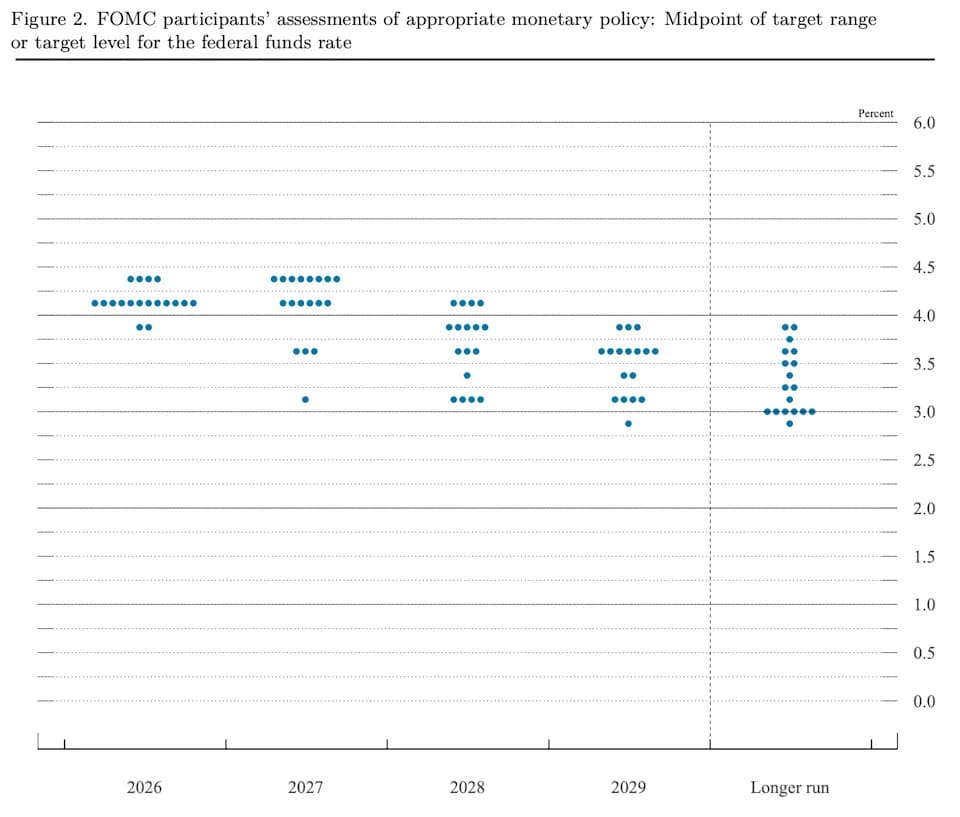
Sixteen of the Fed’s 18 policymakers expect at least one additional 25 bps increase before the end of the year. Updated projections put the policy rate at 4.10% at the end of 2026, compared with 3.80% in the previous projections. For investors, that changed the meaning of the hike.

Fed dot plot. Source: Federal Reserve

images

Euro consolidates losses below 1.1400 amid higher Oil prices, risk-off markets

The Euro (EUR) shows marginal losses against the US Dollar (USD) on Monday, as the rejection of the latest peace proposal in the Middle East lifted Oil prices, while the high US Treasury yields amid bets of upcoming Federal Reserve (Fed) rate hikes keep supporting the Greenback. Against this background, the EUR/USD wavers between one-month lows at 1.1360 and the 1.1400 level.

Investors’ appetite for risk remains subdued at the start of the week as US President Donald Trump rejected Tehran’s latest proposal to pause the hostilities in the Middle East and reopen the Strait of Hormuz, which leaves the region in a highly uncertain scenario.

Oil prices have picked up following the news, with the barrel of Brent Crude climbing above the psychological $100.00 barrier, boosting inflationary pressures and posing additional pressure on already strained Eurozone economies.

Strong data, Fed hiking hopes are supporting the US Dollar

The US Dollar, on the contrary, remains supported by strong US macroeconomic data and rising Treasury yields, as the return of the 10- and 30-year notes crawls higher within multi-decade highs. This has prompted central bankers to consider higher neutral rates, recalling those in the last decade of the XX century.

Analysts at Societe Generale assess that “The short-term outlook for the Dollar is certainly not negative.” In their view, “energy importers remain under pressure: the Yen has yet to benefit from tighter monetary policy, and the Euro has been unable to gain support from upgrades to growth expectations.”

The longer-term outlook, however, is becoming less dollar-friendly, according to Societe Generale Experts. In a two- to ten-year period, the bank expects that “US politics and evolving global savings patterns start to bite. They note that the “midterm elections may make it difficult for President Trump to maintain the accommodative fiscal policies that have supported both the economy and the Dollar,” while “the world’s major savings economies are saving less than they once did, while the US is having to pay more to attract the investment it needs.”

6bf9b8e9-2ae4-4786-b9d2-5d642e06ff53

Gold Price Forecast: XAU/USD remains vulnerable as sellers target $4,000

Gold (XAU/USD) remains under heavy selling pressure at the start of the week, weighed down by rising expectations of further monetary tightening from the Federal Reserve (Fed). Higher Oil prices are fueling inflation concerns and keeping US Treasury yields elevated, reducing the appeal of the non-yielding precious metal.

In the daily chart, XAU/USD keeps a bearish near-term tone as price holds below the 100-day simple moving average (SMA) and the Bollinger middle band. The metal is clinging just above the lower Bollinger band support, while the Relative Strength Index (RSI) at 39.9 leans lower, suggesting fading bullish momentum rather than outright oversold conditions.

On the topside, initial resistance appears at the 100-day SMA near $4,300, followed by the Bollinger middle band around $4,340, with the upper Bollinger band at $4,462 acting as a stronger cap if a rebound extends. On the downside, immediate support is defined by the lower Bollinger band at roughly $4,218; a sustained break beneath this floor would open the way for a deeper pullback, keeping the bearish bias intact while the price remains under the clustered moving-average and volatility-band resistance overhead.

Meanwhile, persistent tensions between the United States (US) and Iran are supporting safe-haven demand for the US Dollar (USD), adding further pressure on Gold. Markets are now pricing in around a 68% chance of another Fed rate hike in October, while upcoming comments from Fed officials and key US economic data are likely to remain important drivers for XAU/USD.
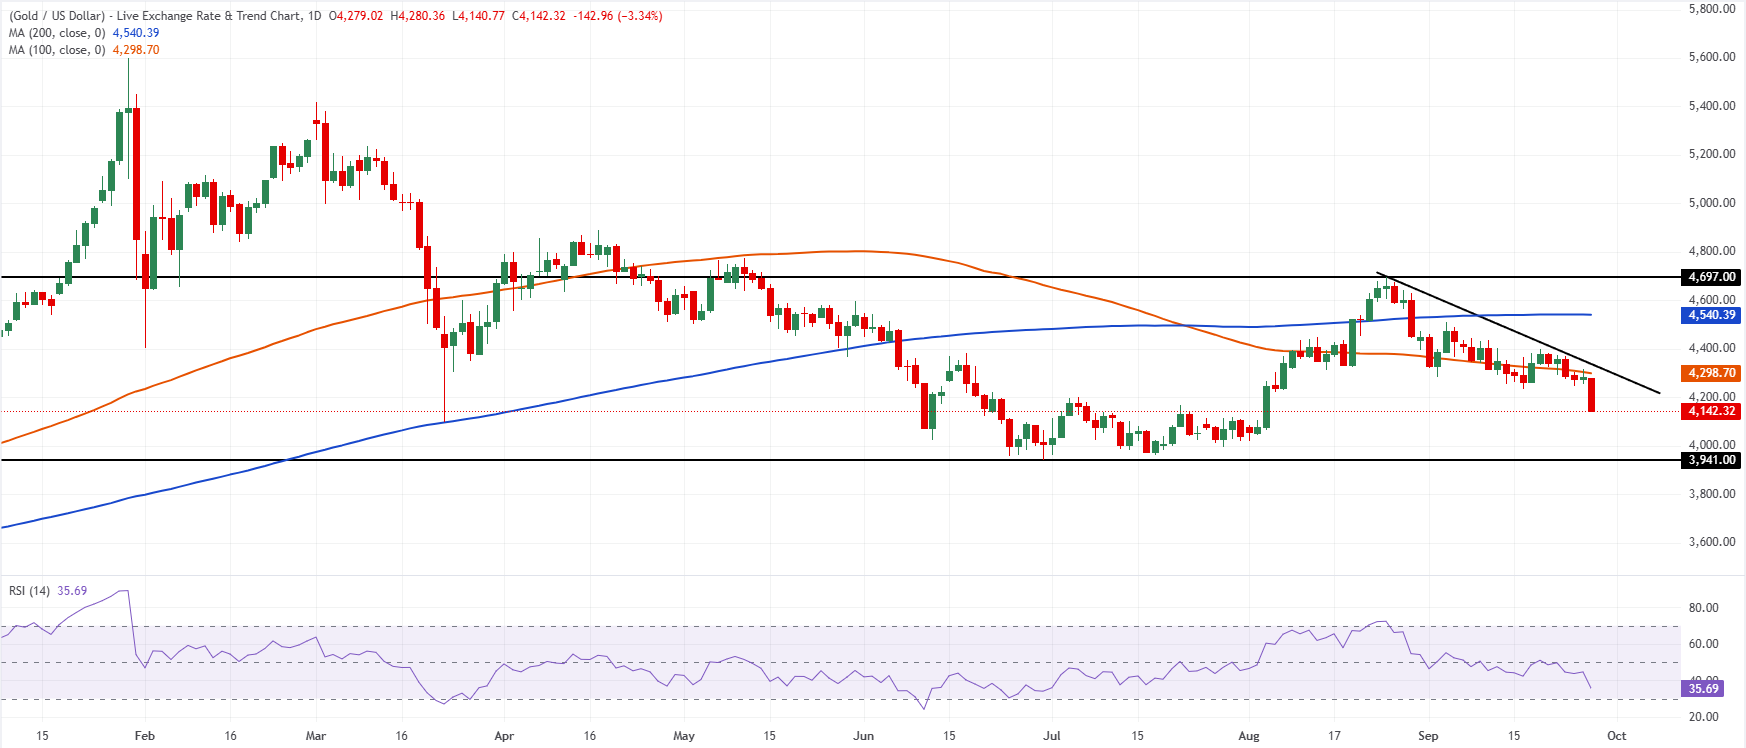
Chart Analysis XAU/USD

In the daily chart above, XAU/USD trades at $4,142.32, keeping a bearish near-term bias as it holds below the 100-day simple moving average (SMA) at $4,298.70 and the 200-day SMA at $4,540.39. The pair also remains under the descending trend-line reference near $4,305.00, suggesting that recent rebounds are still capped within a broader corrective phase. The Relative Strength Index (14) at 35.69 hovers just above oversold territory, hinting that downside momentum is softening but not yet reversed.

On the topside, immediate resistance is clustered around the 100-day SMA at $4,298.70 and the trend-line at $4,305.00, with a stronger barrier at the 200-day SMA near $4,540.39 before the horizontal resistance at $4,697.00. On the downside, the next notable support stands at the horizontal level of $3,941.00, where buyers would be expected to emerge to defend the broader uptrend, while a sustained break below the current area would likely extend the corrective slide toward that floor.
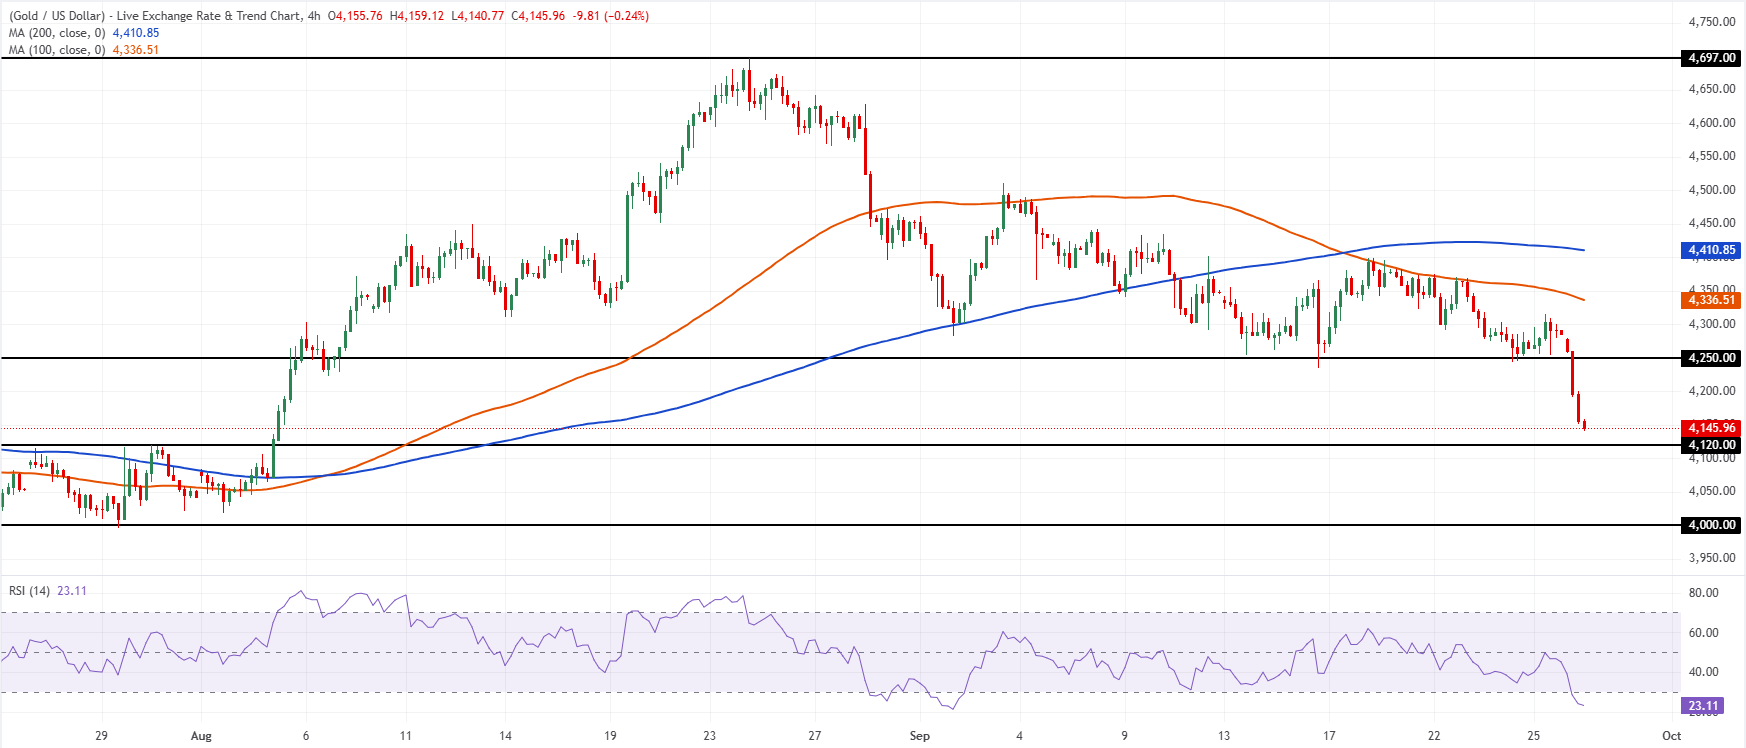
Chart Analysis XAU/USD

In the four-hour chart above, XAU/USD is extending its slide below the key simple moving averages and preserving a bearish near-term bias. The 100-period simple moving average (SMA) at $4,336.51 and the 200-period SMA at $4,410.85 both sit well above spot, suggesting the metal remains in a corrective phase under substantial overhead supply. The Relative Strength Index (14) has slipped to around 23, hinting at oversold conditions, but this momentum backdrop alone is not yet sufficient to overcome the prevailing downside pressure while price holds beneath the clustered moving-average barriers.

On the topside, initial resistance appears at the horizontal level near $4,250.00, ahead of the 100-period SMA at $4,336.51 and the 200-period SMA at $4,410.85, with a higher resistance marker seen at $4,697.00. On the downside, immediate support is aligned at $4,120.00, followed by a more robust structural floor around $4,000.00, where a stronger reaction could emerge if the current oversold readings start to attract dip-buying interest.


CANADIAN_2_L

Canadian dollar holds near recent lows as stronger US dollar keeps pressure on currency

The Canadian dollar was little changed in early trading on Friday but remained under pressure near a multi-week low as broad US dollar strength and rising US Treasury yields continued to weigh on the Canadian currency.

At around 8:54 a.m. Eastern Time, USD/CAD traded near C$1.4149, up about 0.08% on the day. The pair opened at around C$1.4147 and traded in a range of roughly C$1.4140 to C$1.4150 during the session.

The move extends a recent trend of Canadian dollar weakness. The currency has remained under pressure throughout the week after touching a two-month low, with broad US dollar strength and weak Canadian retail sales weighing on sentiment.

The latest pressure has largely come from the US interest rate market. The US dollar was heading for a second consecutive weekly gain as Treasury yields rose sharply and expectations for further Federal Reserve interest rate hikes increased, boosting demand for the US currency.

Fresh market commentary on Friday morning focused on the continued strength of the US dollar and expectations for a relatively more hawkish Federal Reserve policy path. That has kept the US yield advantage over Canada at the center of foreign exchange trading.

The Canadian dollar has also struggled despite higher oil prices, suggesting that the currency’s traditional support from Canada’s energy exports is being overshadowed by interest rate differentials and US dollar dynamics.

silver

Euro hovers near two-month low ahead of Christine Lagarde testimony

The euro fell against a basket of global currencies in European trading on Monday, resuming losses against the US dollar after a temporary rebound on Friday and moving back toward a two-month low, as investors focused on buying the US currency as the most attractive alternative investment amid escalating tensions between the United States and Iran.

To reassess expectations for the European interest rate outlook, investors are awaiting testimony from European Central Bank President Christine Lagarde before the European Parliament in Brussels later today.

The Price

• EUR/USD fell 0.15% to $1.1373, from the day’s opening level of $1.1390, with a high of $1.1391.

• The euro ended Friday up 0.1% against the dollar, its first gain in five sessions, recovering from a two-month low of $1.1359.

• The euro lost 0.85% against the dollar last week, its third consecutive weekly decline, amid concerns over a widening interest rate gap between Europe and the United States.

US dollar

The US Dollar Index rose nearly 0.2% on Monday, resuming gains that paused on Friday and moving back toward a two-month high, reflecting renewed strength in the US currency against a basket of major and minor currencies.

The advance came as investors bought the dollar as the most attractive alternative investment amid growing concerns over escalating political tensions between the United States and Iran and renewed risks of military confrontation between the two sides.

US-Iran talks

• US President Donald Trump rejected an Iranian proposal that included reopening the Strait of Hormuz and resuming nuclear talks in exchange for lifting the US naval blockade, easing oil sanctions and restoring a regional ceasefire.

• Trump said he expects further talks with Iran this week, while Qatar continues its indirect mediation between Washington and Tehran.

• Reports indicate that significant differences remain, particularly over the Strait of Hormuz, Iran’s nuclear program and economic sanctions.

• Iranian Foreign Minister Abbas Araghchi said Tehran still wants a diplomatic solution, while Iran’s military leadership said the armed forces are prepared for any new US attack.

European interest rates

• Money markets currently price the probability of a 25-basis-point interest rate hike by the European Central Bank in October at below 50%.

• Investors are awaiting key European inflation data for September this week to reassess those expectations.

Christine Lagarde

Investors are awaiting testimony from European Central Bank President Christine Lagarde before the European Parliament’s Committee on Economic and Monetary Affairs in Brussels later today at 14:30 GMT.

Lagarde is expected to address the latest inflation developments in the eurozone and assess the risks of increasing price pressures, particularly amid the impact of energy shocks and geopolitical developments.

Her remarks could provide clearer signals on the appropriate monetary policy response to these developments and whether further tightening is needed or interest rates should remain at their current levels.

Euro outlook

We expect that if Lagarde’s comments are more hawkish than markets currently anticipate, expectations for an ECB interest rate hike in October will increase, potentially helping the euro recover against a basket of global currencies.

jpy

USDJPY Receives a Positive Boost

The USDJPY price posted promising gains in its latest intraday trading after finding support at its EMA50, which provided positive momentum and confirmed the dominance and stability of the short-term corrective bullish path. This comes alongside the beginning of a bullish divergence on the relative strength indicators after reaching extremely oversold levels, excessively so compared with the price movement, with positive signals beginning to emerge from them. This intensifies the positive pressure surrounding the pair and increases the chances of extending these gains in the near term.