US Dollar Is Down, But Not Out, as Fed Prepares for More Rate Hikes

Bloomberg) — The three-day selloff in the US dollar on the back of a global stock rally and just the possibility — yet to materialize — of an end to China’s Covid-zero policy, has caught market players’ attention.

But betting against the greenback at this juncture, they warn, is a bit too soon and a bit too risky.

If anything, they say, it’s hard to see the currency weakening much further from here in the short term after the US Federal Reserve last week stuck to its hawkish stance and signaled that the ultimate level for rates would be higher than previously expected. That, on top of a global slowdown in growth, raises the possibility of other central banks being forced to slow their own pace of rate increases, which in turn may contribute to the weakening of their currencies.

“It’s a doom loop–the weaker the rest of the world, the better the outlook for the dollar,” Jane Foley, a strategist at Rabobank in London, said. “While the stronger the dollar goes, the harder it is on other countries, especially commodity-importing nations.”

As the greenback surged to its highest level in decades earlier this year, other currencies weakened, the yen has been pushed to 30-year lows, while the pound briefly lost about a fifth of its value. The Bank of Japan is one of the few central banks to maintain rock-bottom rates, making it the worst performing currency among G-10 peers this year.

Other countries have already started tapping the brakes on tightening. Canada surprised investors last month by raising its overnight lending rate 50 basis points instead of 75. Last week, the Bank of England pushed back against market expectations for the scale of future increases, saying they were too high and warning that following that path would induce a two-year recession. It did, though, deliver its biggest interest rate increase in 33 years Thursday.

Chart  Description automatically generated with medium confidence

GBP/USD Surrenders 1.15 Confluence Area, Short-Term Upside Remains a Possibility

GBP/USD Fundamental Backdrop

Cable has started the day on the back foot against the greenback surrendering the key confluence area around 1.1500. This sour start to the day comes on the back of a reported slowdown in sales in the UK as consumers prioritize essential purchases. The figures came courtesy of a report by the British Retail Consortium with the group noting a shift in spending behavior as the busy holiday season approaches.

Cable enjoyed gains of around 3% against the greenback over the previous two sessions yet the slowdown in sales provides further indication of the challenges ahead. Cable is being helped by a weaker dollar to start the week as the greenback struggles to hold on to early session gains.

Bank of England Chief Economist Huw Pill commented that the central bank has been trying to give a more realistic view as to where rates are heading while warning that more rate hikes are needed. Pill stated that risks in the UK are tilted towards higher inflation moving forward while confirming that rate hikes will be driven by the economic outlook.

US Dollar Index, Daily Chart- November 8, 2022

Chart  Description automatically generated with medium confidence

Markets have seen a slight increase in risk appetite since Friday as rumors continue to swirl around a potential re-opening in China. This in part could be the reason for the greenbacks slump. There remains little in the form of major economic releases from the UK this week with the main risk event the US Inflation numbers due out on Thursday.

Given the lack of data there is a real possibility cable could benefit from broad-based dollar weakness heading into Thursday’s CPI release. This could see GBP/USD reclaim the 1.1500 area and make a run for September highs resting at the 1.1750 area.

For all market-moving economic releases and events, see the DailyFX Calendar

GBP/USD Daily Char

Chart, histogram  Description automatically generated


image1.png

Euro (EUR) Latest: Hawkish ECB Talk Boosts the Euro, EUR/USD Parity Being Tested

A number of ECB policymakers have been doubling down on the central bank’s position on interest rates and inflation, saying that higher rates are needed for longer to quell double-digit price pressures. In what looks like a concerted effort to re-assert the central bank’s authority and will on the rates market, the financial wires are full of hawkish ECB speak.

  • ECB’s Martins Kazak recently said that there is no need to halt rate hikes this year and that the central bank should continue raising rates into 2023 as any recession is likely to be shallow and brief and won’t require any rate cuts.
  • Board member and President of the Deutsche Bundesbank Joachim Nagel recently stated that large rate hikes are needed and that the ECB must not let up too early on normalizing.
  • ECB Vice-President Luis De Guindos said that the central bank must continue raising rates to a level that ensures that inflation comes back into line.

The ECB hiked rates by 75 basis points at the end of October to 1.50%, its third consecutive hike and the highest level seen since 2009. The central bank is expected to raise rates by another 50 basis points at the December 15 meeting.

While the Euro has been boosted by expectations of higher rates, the US dollar is under pressure as traders start to look through higher US rate expectations and instead focus on when the Fed may pause its tightening cycle. Although this may be months away, the fact the markets are already looking for a turnaround is weighing on the greenback. Add into the mix this week’s US midterm elections, and which party may control either or both of the House and the Senate, and the US dollar will likely remain volatile in the days and weeks ahead.

EUR/USD is trading on either side of parity at the moment with momentum looking to push the pair higher. A series of short-term higher lows from late September is underpinning the move and a re-test of the late October double top around 1.0093 is the next target. A confirmed break of this level would nullify the medium-term series of lower highs and allow the pair to move back toward 1.0200.

EUR/USD Daily Forex Price Chart November 8, 2022

image1.png


Australia, NZ dollars hold onto gains as risk appetite rebounds on China

SYDNEY: The Australian and New Zealand dollars held onto their recent gains on Tuesday, buoyed by a broad pick-up in risk appetite as markets clung onto hopes that China’s costly zero-COVID policy will eventually ease.

The Aussie was hanging at $0.6467, after rising 0.2% overnight, building on strong gains seen since Friday when speculation that Beijing will loosen anti-pandemic restrictions surfaced.

Resistance is at around 65 cents. The kiwi touched a seven-week high of $0.5951 on Tuesday, having also edged up 0.2% in the previous session.

Resistance is around $0.5988.

The two currencies, which had tumbled on concerns about global growth this year, have been edging higher in recent sessions as markets priced in a slowdown in the global tightening cycle, although near-term downsides remain with the United States expected to report its inflation readings on Thursday.

“The AUD is likely to trade in a wide range in the near term, tracking news on potential policy support out of China and swings in the USD/risk sentiment,” analysts at Barclays said.

“Domestic data is less likely to be driver with the RBA now behind us.” The Aussie did not react much to domestic surveys showing Australian businesses had another strong month for sales and profitability in October, though confidence eased.

In New Zealand, a survey from the Reserve Bank of New Zealand showed the near-term rate of inflation is expected to ease over the coming year but will be higher than previously predicted.

Australian government bond yields jumped following a move in the US Treasures market.

Yields on 10-year bonds jumped 12 basis points to 4.046%, the highest in two weeks. Yields on three-year bonds gained by a similar margin to 3.512%.

The foreign trade figure: Quarterly analysis of the 3rd quarter 2022

On the 3rd quarter of 2022, French exports of goods continue to grow in value (+5.1%), at a rate slightly higher than that of the 2nd quarter (+4.0%). The three quarters of this growth are due to manufactured goods, whose dynamism is driven by sales of mechanical, electronic and computer equipment, those of automobiles, as well as the strong rebound in aeronautical exports – the latter are, however, far from having regained their pre-health crisis level. Exports agriculture, driven by wheat, reached a record level since 2009. Imports continue their strong growth in value, at a rate similar to that from 2 e quarter

image1.png

Crude Oil Forecast: Brent Limited by China’s COVID Policies and Stronger USD

BRENT CRUDE OIL FUNDAMENTAL BACKDROP

Brent crude oil prices have been marginally curtailed this morning after Chinese health officials reiterated this importance of their ‘zero-COVID’ policies, suppressing optimism around a Chinese reopening. This has left commodity prices largely in the red while a stronger USD adds to downside momentum.

 U.S. midterm elections are this main focus for today and much talk has centered around a possible gridlock within the government leaving future policies extremely difficult to pass from either Democrats or Republicans. The importance of this could surface in 2023 should inflation subside and the economy requires fiscal stimulus. Because this is unlikely to pass through congress in a divided government, the responsibility almost has to fall on the Fed to cut interest rates in order to stimulate the economy. In theory this should weaken the greenback giving added support to crude oil prices.

Later this evening, API weekly stock data (see economic calendar below) is due and after last weeks surprise decline, another slip could give brent crude some support.

ECONOMIC CALENDAR

image1.png

TECHNICAL ANALYSIS

BRENT CRUDE (LCOc1) DAILY CHART -UNDATED

image2.png

Daily brent crude price action shows a developing rising wedge chart formation (yellow). The RSI reading suggests slowing bullish momentum but still has room to push higher depending on the upcoming fundamental catalysts discussed above. Traditionally, a rising wedge points to impending downside after a bullish consolidation but confirmation needs to come from a candle break and close below wedge support which is a long way away at this point.

Key resistance levels:

  • 100.00
  • Wedge resistance

Key support levels:

  • 95.00/100-day EMA (yellow)

China’s Long Lockdowns Struggle to Contain Growing Outbreaks

(Bloomberg) — Some of China’s most persistent virus hotspots have been locked down for weeks, and in some cases months, showing the limitations of the country’s contentious Covid Zero policy.

Xinjiang reported the fourth-highest number of new cases nationally for Monday, according to data compiled by Bloomberg, despite some cities in the region in China’s northwest locked down for 90 days. Inner Mongolia, which was sealed off in early October, saw cases jump to almost 1,800 from 1,033 a day earlier, while Henan province’s infections more than doubled in a day to 747.

Explore Bloomberg’s Exclusive China Covid Dashboard on the Terminal

Guangdong province has the biggest outbreak right now, the main driver of China’s national caseload rising to 7,323 new infections, the highest tally since April 30. Most of the cases are in the southern metropolis of Guangzhou, which reported 2,377 infections and has taken a targeted approach to virus containment so far.

While entertainment venues and restaurants are shut in most of the city, just one district, Haizhu, has been locked down. It’s where most of the cases are being found, and the stay-at-home order was extended on Monday night.

Restrictions continue to be imposed at various levels in other Chinese cities, with Shanghai consistently locking down apartment blocks and neighborhoods where cases and close contacts are found since its city-wide lockdown was ended earlier in the year.

The swelling outbreaks show the strain China’s Covid Zero strategy is facing, with even harsh lockdowns and constant mass testing failing to quickly get them under control. Health officials over the weekend reaffirmed the country’s unswerving commitment to the policy, even as it hammers the economy, dashing hopes that authorities will soon move toward easing some of their strictest rules.

What We Know About China’s Covid Plans After Week of Turmoil

China’s absolutist approach to Covid almost three years in to the pandemic is leading to rising tensions on the ground.

A clash between residents and virus prevention staff — known locally as Dabai, or “Big Whites” for their full-body PPE — in Shandong province led to seven arrests on Monday, police in the city of Linyi said on Weibo.

A video posted online purporting to be of the fight showed groups of Dabai surrounding a man on the street, then dragging him by his clothes before punching and kicking him on the road, joined by what appears to be police officers. Onlookers scream and yell. Bloomberg News was unable to verify the the footage, posted across Weibo and also on Twitter.

China quarantines all Covid cases and their close contacts in makeshift hospitals, a policy that has led to frictions in the past as people object to being taken away.

Incidences of pushback and protest are increasing in China the longer Covid Zero drags on. In the lead-up to the all-important Communist Party congress in Beijing last month, a protester hung banners from a bridge criticizing the lockdowns in a rare, high-profile show of defiance in the capital. Videos of protests during Shanghai’s lockdown earlier this year were censored online.

China’s Tolerance for Xi’s Unyielding Covid Fight Is Cracking

MACD indicator

What the MACD Indicator is and How it Works

What is MACD?

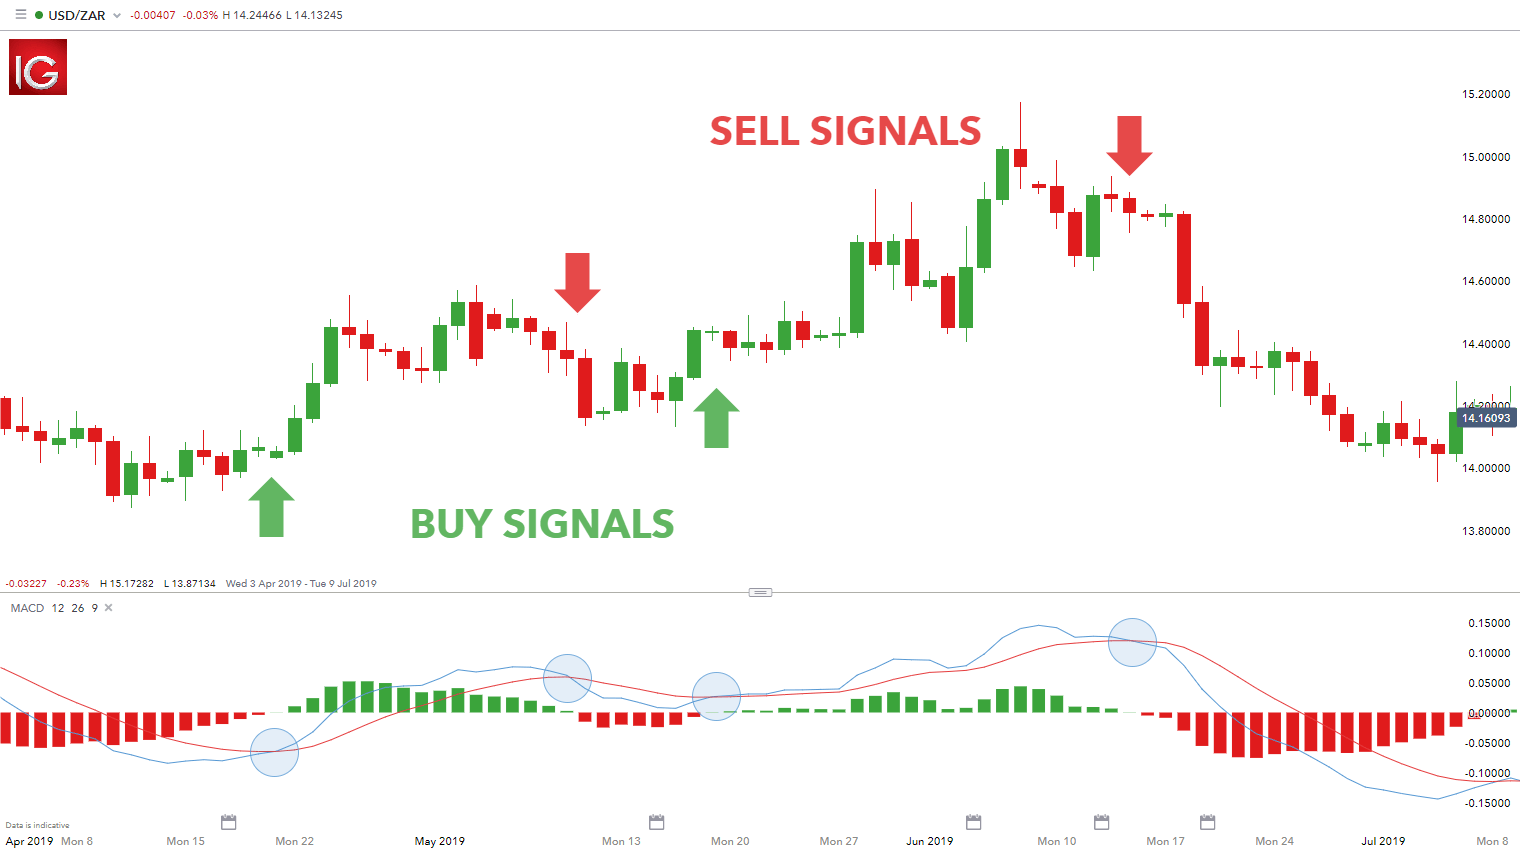
The Moving Average Convergence Divergence (MACD) is a technical indicator which simply measures the relationship of exponential moving averages (EMA).The MACD displays a MACD line (blue), signal line (red) and a histogram (green) – showing the difference between the MACD line and the signal line.

MACD indicator

The MACD line is the difference between two exponentially levelled moving averages – usually 12 and 26-periods, whilst the signal line is generally a 9-period exponentially smoothed average of the MACD line.

These MACD lines waver in and around the zero line. This gives the MACD the characteristics of an oscillator giving overbought and oversold signals above and below the zero-line respectively.

What does MACD measure?

The MACD measures momentum or trend strength by using the MACD line and zero line as reference points:

  • When the MACD line crosses ABOVE the zero line, this signals an UPTREND
  • When the MACD line crosses BELOW the zero line, this signals an DOWNTREND

In addition, the MACD signals buy or sell orders which are given when the two MACD lines cross over as outlined below:

  • When the MACD line crosses ABOVE the signal line, traders use this as a BUY indication
  • When the MACD line crosses BELOW the signal line, traders use this as a SELL indication

USD/ZAR MACD trading signals

How is MACD calculated?

Most charting platforms offer the MACD indicator, and implement this calculation using the aforementioned default periods. The formula below breaks down the varying components of the MACD to make it comfortable for traders to apply.

MACD formula calculation

As mentioned previously, the MACD histogram plots the difference between the two moving average lines. The histogram fluctuates in and around the zero designation on the MACD indicator. When the MACD line is above the signal line, then the histogram will be positive. The opposite is true when the MACD line sits below the signal, whereby the histogram will plot below the zero as a negative value. A zero value on the histogram indicates a crossing over of the two moving average lines thus marking buy/sell signals.

Limitations of MACD

The MACD indicator is considered to work best in trending markets. This limits its use for traders depending on their trading strategies. For example, range bound/consolidating markets will generally give flawed signals when using the MACD. Traders will need to truly understand the MACD as well as when to employ the indicator for optimal use. Novice traders may find this indicator difficult to use initially, which is why going through basic moving average and EMA fundamentals will benefit traders who are looking to make use of the MACD indicator.

The variations that can be implemented with the MACD indicator is almost infinite which makes it very personal to the trader. This subjective nature of the MACD will mean that results differ from trader to trader which take away any consistency. Traders will need to follow a basic outline when using the MACD:

  • Selecting EMA parameters
  • Using an appropriate time frame, as MACD may function differently across time frames

MACD Indicator: A Summary

The MACD is unique in that it serves as an oscillator as well as MACD crossover indicator. This dual purpose gives two signals in one indicator allowing for a less cluttered chart. Traders may find this useful which makes understanding the MACD worthwhile.

Become a Better Trader with Our Trading Tips

  • Learn about other oscillators and indicators to enhance your trading for both beginner and experienced traders:
  1. Relative Strength Index (RSI)
  2. Exponential Moving Average (EMA)
  3. Simple Moving Average (SMA)

image1.png

Bitcoin and Ethereum Technical Outlook: Have They Run Their Course?

BITCOIN SHORT-TERM TECHNICAL OUTLOOK – NEUTRAL

Bitcoin’s rebound has run into tough resistance, raising the risk of a retreat, or possibly a retest of the June low.

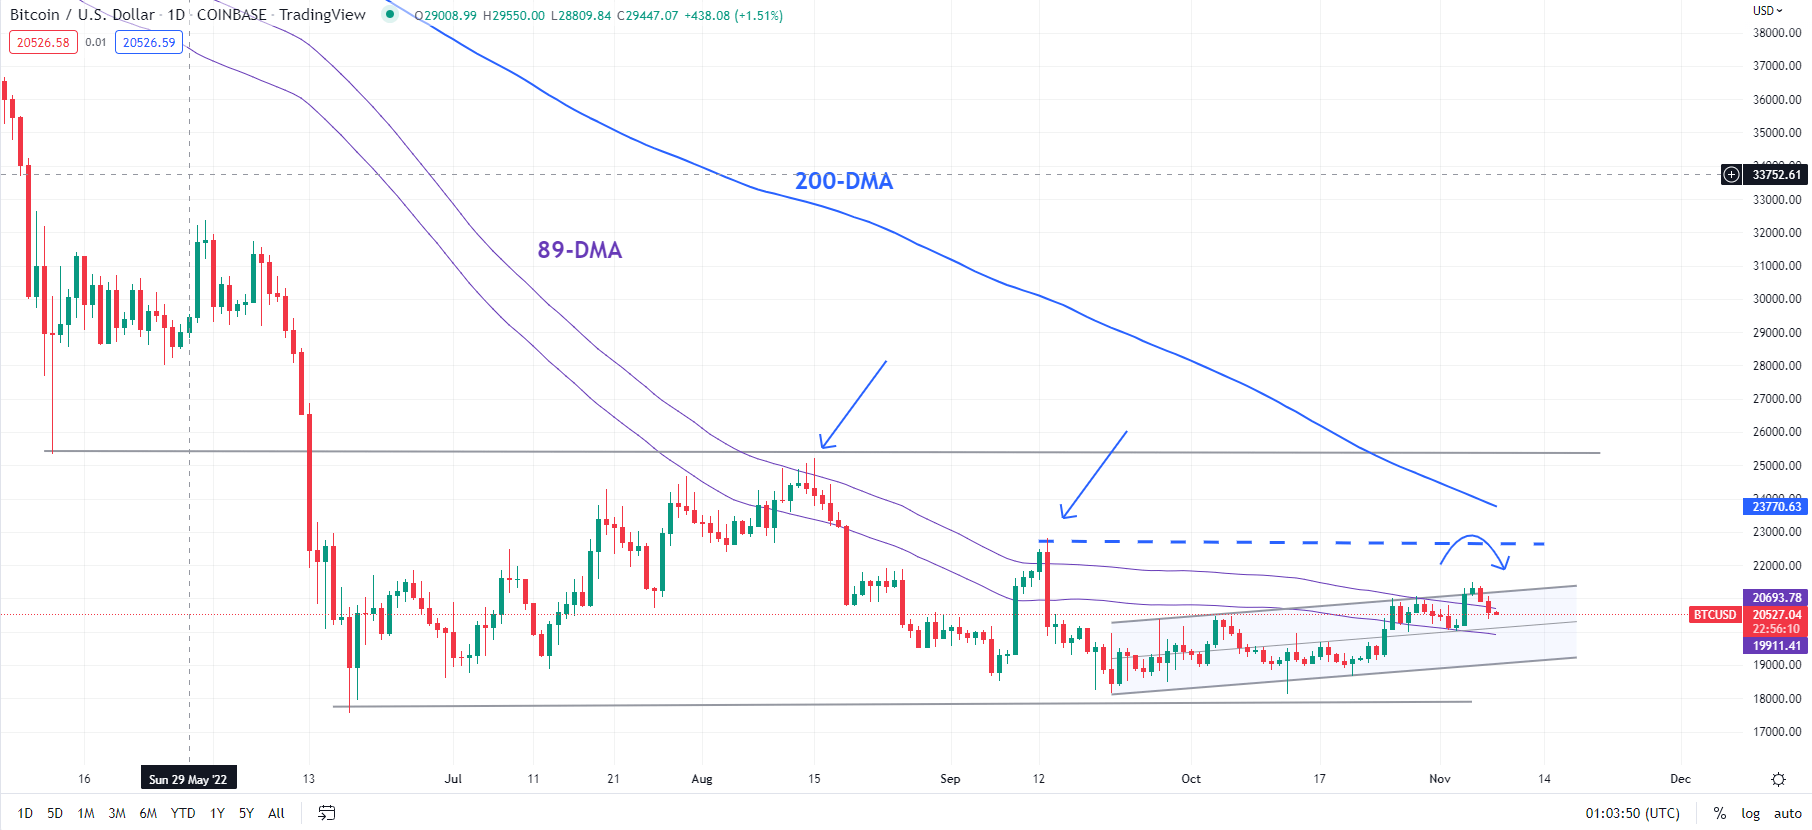
BTC/USD has maintained a gradual drift higher in recent weeks, nicely guided by an upward-sloping channel from September. The top end of the channel is an uptrend line (now at 21250) while the lower edge of the channel is another uptrend line (now at 18950). The top end also coincides with the 89-day moving average – the rebounds in August and September were capped by the moving average.

The two-steps-forward-one-step-back kind of recovery, similar to the corrections since mid-2022, means the current rebound is not any different from the previous dead-cat bounces. That is, those minor rallies were corrective, rather than a start of a new uptrend.

BTC/USD Daily Chart

image1.png

For the downward pressure to fade, BTC/USD would need to rise above key converged resistance on the 200-day moving average (now at about 23770) and the August high of 25201. Until then, the path of least resistance is sideways to down. Interim resistance is at the September high of 22774.

From a half-glass-full perspective, the rise since September could well be part of the broader base-building process, typically classified by retests of the lows and fragile/choppy rebounds. In this regard, BTC/USD needs to hold above the June low of 17590 for the base-building view to remain intact. Immediate support is at Thursday’s low of 20040. Any break below the support would indicate that the short-term upward pressure had eased.

ETHEREUM SHORT-TERM TECHNICAL OUTLOOK – NEUTRAL

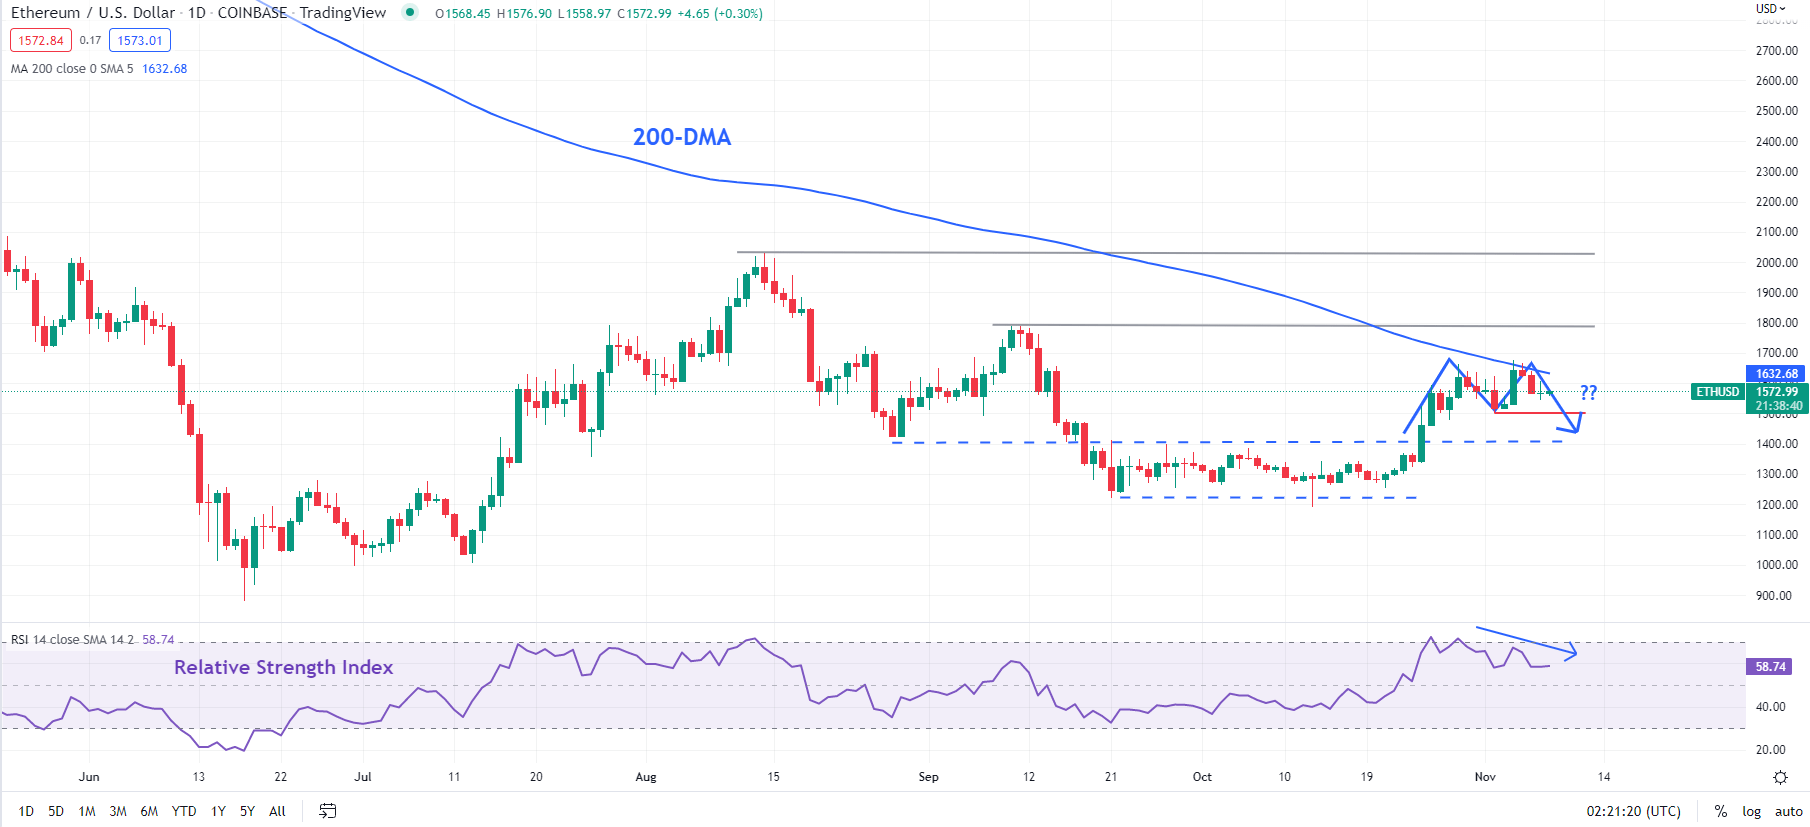
A negative momentum divergence (rising price associated with declining momentum) on the daily charts raises the odds that Ethereum’s recent rally may have run its course.

ETH/USD’s three-week-long rally is testing quite strong resistance on the 200-day moving average, not too far from another ceiling at the September high of 1790. Also, as noted in the previous update, ETH/USD has achieved the price objective of the horizontal channel that got triggered at the end of October.

ETH/USD Daily Chart

image2.png

Any break below last week’s low of 1502 would trigger a minor double top (the October 29 and the November 6 highs), implying a potential fall towards 1350. However, there is strong support at the September-October lows of around 1193-1220.

image1.png

Euro Holds High Ground as US Dollar Sidelined Ahead of Mid-Terms. Higher EUR/USD?

The Euro has held onto gains against the US Dollar made since last Friday after favourable data yesterday and ahead of today’s mid-term elections.

Swiss jobs data and German industrial production figures helped to underpin EUR/USD into the New York close, and the uplift has been maintained through the Asian session so far.

US mid-term elections are to be held today and the market is poised for headlines that may emanate out from early results.

The US Dollar remains under the pump despite Treasury yields adding a few basis points in the North American trade and followed by a couple more in Asia today. The benchmark 10-year note is again yielding over 4.20%.

Gold has eased off Monday’s peak and is trading below US$ 1,670. Crude oil has similarly pulled back from yesterday’s high with both the WTI and Brent futures contracts easing around a third of a percent at the time of going to print.

APAC equities were mixed with Australia’s ASX 200 and Japan’s Nikkei 225 in the green while Hong Kong’s Hang Seng index and mainland China’s CSI 300 lost ground. Further Covid-19-related lockdowns in China have been sighted for the weakness in their bourses.

The Reserve Bank of New Zealand’s Adrian Orr was re-appointed for another 5-years as Governor of the bank. The RBNZ was the first mover among global central banks in the current tightening cycle.

The RBNZ survey of 2-year inflation expectations hit its highest level since 1991 today, coming in at 3.62%. The market is leaning toward a 75 basis-point hike to the RBNZ’s target rate at their meeting later this month.

Looking ahead, EU retail sales are due out and there will be several central bankers crossing the wires. The Swiss National Bank’s Thomas Jordan is the most senior banker to be speaking.

The US mid-terms will be watched but the market will be eagerly awaiting Thursday’s US CPI data.

The full economic calendar can be viewed here.

EUR/USD TECHNICAL ANALYSIS

The Euro has stalled on its recent run higher today, with possible resistance further up at the breakpoint of 1.0090 which is just below a recent peak of 1.0094.

The recent rally has seen the price move above the 10-, 21-, 34- and 55- day simple moving averages (SMA). A period of consolidation above these SMAs might see all the gradients on them turn positive, which could indicate evolving bullish momentum.

Support could be at the previous lows at 0.9730, 0.9705, 0.9632 and 0.9536.

image1.png