image1.png

GBP/USD Technical Outlook: Has the British Pound Bottomed?

GBP/USD SHORT-TERM TECHNICAL FORECAST – NEUTRAL

This is a follow-up to the article published on October 3.

In a nutshell, there is not much evidence yet to conclude that the worst is over for GBP/USD. That’s because in recent weeks GBP/USD has remained confined within the September open-close range. While this can be interpreted as ‘wait-and-watch’, it could also imply a lack of conviction amongst market participants with regard to the future trend.

GBP/USD Monthly Chart

image1.png

In this regard, at a minimum, a decisive break above a horizontal trendline from 2016 (at about 1.1450) would be an early sign that the medium-term downward pressure is fading. A stronger signal would be a rise above the August high of 1.2295, roughly coinciding with the 200-day moving average, which would confirm that the worst is over for GBP/USD.

Most immediately, the pair will need to crack the barrier on the 89-day moving average – it was last below the average in 2021. While GBP/USD stays below the 89-day moving average, a retest of the September low of 1.0385 (or below) can’t be ruled out completely. There are a few signposts to watch.

GBP/USD Daily Chart

image2.png

A fall below the lower edge of a minor ascending channel from early October, around Friday’s low of 1.1145 would confirm that the short-term upward pressure had faded, risking a drop toward a vital cushion at the October low of 1.0925. The cable needs to hold above 1.0925 for the recovery trend to remain intact as a decisive break below 1.0925 could expose downside risks toward the end-September low of 1.0385.

UK house prices fall as market continues to cool

“Average house prices fell in October, the third such decrease in the past four months. The drop of -0.4% is the sharpest we have seen since February 2021, taking the typical property price to a five-month low of £292,598. While the pace of annual growth also continued to ease, to +8.3% compared to +9.8% in September, average prices remain near record highs. Average house price £292,598 Monthly change -0.4% Quarterly change +0.4% Annual change +8.3% “Though the recent period of rapid house price inflation may now be at an end, it’s important to keep this is context, with average property prices rising more.

Digital economy becomes China’s major growth engine: white paper

BEIJING — China’s digital economy, ranking second worldwide for many years, has become a major growth engine for the country, according to a white paper published on Nov 7.

The white paper titled “Jointly Build a Community with a Shared Future in Cyberspace” was released by the State Council Information Office.

By 2021, the value of China’s digital economy had reached 45.5 trillion yuan, accounting for 39.8 percent of its GDP, said the white paper.

By June 2022, there were 1.05 billion internet users in China, and the internet penetration rate had reached 74.4 percent, read the white paper, adding that the country hosts the world’s largest 5G network and becomes one of the global leaders in 5G standards and technology, with 1.85 million 5G cell towers and 455 million 5G cell phone subscribers.

With the BeiDou-3 global navigation satellite system now operational, and beginning to provide global services in July 2020, the BeiDou industrial system is in place and provides notable economic and social benefits, the white paper said, adding that China’s satellite navigation and positioning services generated 469 billion yuan of industrial output in 2021.

According to the white paper, China vigorously cultivates new technologies and applications such as artificial intelligence (AI), Internet of Things (IoT) and next-generation communication networks to accelerate the transformation from digitalization and network-based service to artificial intelligence in various economic and social sectors. Innovation has become a defining feature in the country.

Noting China’s industrial internet has grown rapidly, and the digital transformation of manufacturing industry continues, the white paper said that 55.3 percent of the key processes of large industrial enterprises had become digitally controlled, and the application of digital R&D tools was as high as 74.7 percent by February 2022.

China’s digital transformation of agriculture is making steady progress. 5G, the IoT, big data and AI have been applied in agricultural production and management, and key technological development and innovative application research for intelligent agriculture and farming machinery have been strengthened, according to the white paper.

Digitalization and the provision of digital capacity continue to grow. E-commerce is flourishing, said the white paper.

In 2021, China’s online retail sales of consumer goods stood at 10.8 trillion yuan, up 12 percent year-on-year. The turnover in China’s cross-border e-commerce reached 1.92 trillion yuan, up 18.6 percent year-on-year. The scale of third-party payment transactions continues to expand.

New methods have been introduced to upgrade commercial models of the service industry, and internet-based medical services, online education, and remote working have accelerated the digitalization of the service industry, the white paper added.

aud-usd chart

Australian Dollar Forecast: China Trade Balance in Focus After Iron Ore Prices Rebound

surged. Asia-Pacific stocks put in healthy gains, with China’s tech-heavy CSI-300 Index rising 6.38% and Hong Kong’s Hang Seng Index (HSI) closing 8.73% higher. The China-sensitive Australian Dollar rose for the third week, supported by higher iron ore prices.

China’s October trade balance is on tap today. Analysts expect the country’s trade balance to grow from $84.7 billion to $95.9 billion. That would bode well for China’s economic outlook after October PMI data showed a contraction in the country’s manufacturing sector. The Chinese Yuan rose over 1% against the Greenback. A Reuters report suggests that China may soon ease its “Zero-Covid” policies, which are among the strictest in the world.

Later this week, traders will digest China’s inflation rate and credit growth data for October. The CPI gauge is expected to post a 0.4% month-over-month increase, and new Yuan loans (a measure of bank-issued credit growth) are slated to cross the wires at 800 billion Yuan, according to estimates. Those events may shift sentiment across the APAC region. The US CPI data on Thursday offers this week’s main event.

An earnings report from Coal India—the world’s largest coal miner—should show healthy growth after thermal coal prices surged during the company’s reporting period. Elsewhere, ANZ will announce Australian job advertisements for October, and Indonesia’s third-quarter growth rate will cross the wires at 02:00 UTC.

Australian Dollar Technical Outlook

A Cup and Handle breakout occurred after prices pierced above resistance. The falling 50-day Simple Moving Average (SMA) is in focus as a potential point of resistance. A break above the SMA would likely encourage additional upside in a possible reversal of the pattern’s preceding downtrend.

AUD/USD 6-Hour Chart

aud-usd chart


‘The old UK growth model is dead’: What a long-term weak pound means for Britain

LONDON — The British pound’s exchange rate against the U.S. dollar

has been on a rollercoaster ride in recent months.

After a year of steady decline, it plunged to an all-time low beneath $1.10 after the U.K. government’s infamous “mini budget” in late September. It then recovered to $1.16 after the country swapped its finance and prime ministers in late October; and sank to $1.11 after the Bank of England downplayed rate hike expectations and warned the U.K. had already begun its longest-ever recession on Nov. 3.

The recent highs and lows have all played out within a range that sterling has not traded at against the greenback since 1984. In mid-2007, at the precipice of the financial crisis, it was possible to get two dollars for a pound. In April 2015, it was still worth $1.5; and at the start of 2022, $1.3.

Almost all currencies have declined against the dollar

this year, and sterling’s depreciation against the euro has not been as severe given the European Union’s own challenges with economic slowing and energy supply.

But the euro is still much stronger than it was against the pound in the 1990s and for most of the 2000s; and the pound’s global importance has evaporated since the days when it was the world’s reserve currency in the early 20th century.

A historically weaker pound on a medium- to long-term basis has a variety of impacts on the U.K. more broadly, economists told CNBC.

The most basic one is that imports get more expensive, while exports theoretically get more competitive.

“The problem is that the UK is very import dependent, almost two thirds of food is imported, so a ten percent decline in the real effective exchange rate really translates quickly into higher food prices,” said Mark Blyth, professor of economics and public affairs at Brown University.

“The UK is a low wage economy. That will hurt.”

Long-run situation

Richard Portes, professor of economics at the London Business School, also noted the U.K.’s reliance on foreign trade, which means a “significant” impact on prices from a weaker currency, though he said there was not yet evidence of a significant effect on U.K. demand for foreign goods — but nor was there on exports, which theoretically become more competitive.

He also noted currency depreciation had a level effect on prices rather than being inflationary.

“It’s a one-off effect. It’s not necessarily giving us inflation in terms of a continuous rise in the price level,” he said. “If it contributes to a wage price spiral then that is inflationary, and that’s what we’re all concerned about now. We don’t what to see these price increases which have come about partly because of Ukraine and so on, we don’t want to see wage rises that will trigger price rises and spiral.”

Sterling’s depreciation is a long-term trend since it was allowed to float freely in 1971, he said, telling CNBC: “I think it’s reasonable to expect that to continue. And that’s partly because productivity and therefore competitiveness has not been very good relative to our trading partners. So that’s the long-run situation.”

The U.K.’s current account deficit (which is where a country is importing more goods and services than it is exporting, and stands at £32.5 billion for Britain) is financed by capital inflows, he noted. Former Bank of England Governor Mark Carney has said the U.K. is dependent on the “kindness of strangers.” But Portes said “it’s not their kindness, it’s them wanting to invest because they find their projections and possible yields, investors find U.K. assets sufficiently attractive to bring in capital.”

“If they find it less attractive, U.K. assets would fall in value to induce people to invest more, so the exchange rate will fall further. That depends on confidence in the British economy, fiscal policy and all those things.”

But, Portes said, the weaker pound is not in itself an issue for the fiscal planning the government is currently doing, with a much-anticipated budget due Nov. 17.

“If a lot of our debt were denominated in foreign currencies it would, but it’s not. Our public debt is denominated almost entirely in sterling. And so unlike some countries, we don’t find it a problem. I don’t think the depreciation we’ve seen or that is likely over the next few years will make much difference to fiscal positions.”

‘Growth model is dead’

According to Blyth, beyond the pain suffered by households, the higher prices caused by a weaker currency will have deeper and longer-lasting effects.

“The U.K. is a heavily consumption-based economy, and such a shift is equivalent to a tax on consumption. That means less fuel in the economic engine. The U.K. already has low growth and even lower productivity growth.”

The potential upside to exports was negated by Brexit, he said, pointing out that the U.K. economy had declined from 90% to 70% of the size of Germany’s since the 2016 vote.

“So what does this mean long term? It means that the old U.K. growth model is dead,” Blyth continued.

“Financing your consumption from other peoples’ savings (capital imports) and swapping overpriced houses had a shelf life. It’s passed. The combination of a structural fall in the exchange rate plus positive inflation ends it.”

The appeal of cheap British assets only held if they were going to be revalued, he said, and “GBP is not the USD. Period.”

Adjusting to this new reality will be painful but necessary for the long term, Blyth believes.

“A U.K. that is not dependent upon greater London generating 34% of GDP, with the north and west living-off transfers, is a better U.K. It will just take time, imagination, and investment to get there.”

image1.png

Gold Price Forecast: XAU/USD Pares Back, Focus on Fed Speakers Ahead of CPI

XAU/USD FUNDAMENTAL BACKDROP

Gold is trading lower on Monday after Friday’s response to U.S. Non-Farm Payroll (NFP) data had markets pricing in a less aggressive Federal Reserve. Despite the fact that money markets show an increase in the terminal rate to 5.1% in June of 2023 (up from 5%), the path to get there has been restrained following guidance from Fed Chair Jerome Powell.

FED INTEREST RATE PROBABILITIES

image1.png

Leading up to the U.S. inflation print on Wednesday, Fed speakers dominate headlines beginning with the Fed’s Collins who last Friday, mentioned the need to curb inflation despite promising signs in certain areas.

ECONOMIC CALENDAR

image2.png

Looking at 10-year real rates (see below), they are showing signs of slowing around the 4.15% mark. The traditional inverse relationship between gold and real rates may give hope to some gold bulls but much relies on the inflation read later this week. While headline has been declining, core inflation (the Fed’s preferred measure) has pushed higher in the last two months. Both releases are expected to coming in softer for October and could provide gold with upside support should this hold true.

U.S. 10-YEAR REAL YIELD

image3.png

TECHNICAL ANALYSIS

GOLD PRICE WEEKLY CHART

image4.png

Price action on the long-term weekly chart keeps gold trading within the down trending channel (blue) but below the 200-day SMA (grey). This week’s candle close is key for forward guidance with a close above the 1682.29 (38.2% Fibonacci) resistance handle opening up subsequent resistance zones. The Relative Strength Index (RSI) remains near oversold territory suggesting limited upside for the yellow metal.

Resistance levels:

  • 1700.00
  • 200-day SMA
  • 1682.29 (38.2% Fibonacci)

Support levels:

  • 1611.52
image1.png

USD/CNH Technical Outlook: An Extended Pause in the Rally?

USD/CNH SHORT-TERM TECHNICAL FORECAST – NEUTRAL

The sharp fall in USD/CNH on Friday suggests that the Chinese Yuan’s (CNH) seven-month slide against the US Dollar is running out of steam, at least in the short term.

In the past two weeks, each time USD/CNH has risen above 7.35, it was sold off quite quickly — and sharply on two occasions (on Friday and on October 26). The peak at 7.35 marks major resistance, near the 2019 and 2020 highs at 7.1965, and coinciding with the upper edge of a slightly upward-sloping channel from 2018. This follows a negative divergence (rising price associated with stalling or weakening momentum) on the monthly, weekly, and daily charts indicating that the seven-month rally is showing signs of fatigue (see chart).

USD/CNH Monthly Chart

image1.png

The retreat has brought USD/CNH toward a quite-strong cushion at the October 27 low of 7.17, near the 200-period moving average on the 240-minute charts. This support is strong and may not be broken so easily – the pair could consolidate a bit above the floor and below the mid-point of a slightly downward-sloping channel from the end of October (now at about 7.25).

USD/CNH 240-minutes Chart

image2.png


USD/SGD Daily Chart

US Dollar Appears Increasingly Vulnerable: USD/SGD, USD/THB, USD/IDR, USD/PHP

Singapore Dollar Technical Outlook – Slightly Bullish

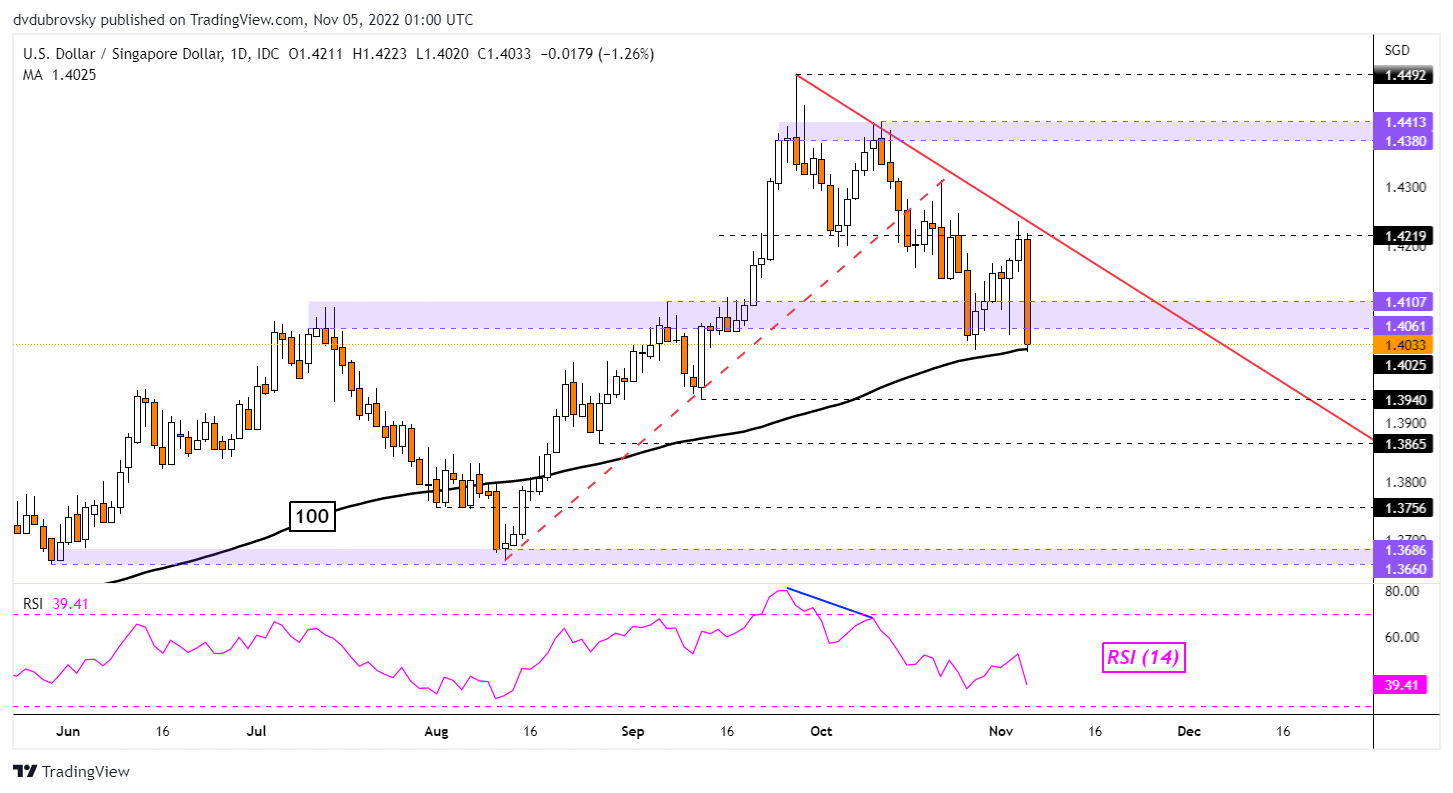
The Singapore Dollar gained 1.26% against the US Dollar last Friday, the best single-day performance since June 2016. That has left USD/SGD once again trying to break under the 1.4107 – 1.4061 former resistance zone. Prices are testing the 100-day Simple Moving Average (SMA). It remains in play as key support. Confirming a breakout opens the door to downtrend extension and an increasingly bullish perspective for the Singapore Dollar.

USD/SGD Daily Chart

USD/SGD Daily Chart

Thai Baht Technical Outlook – Slightly Bullish

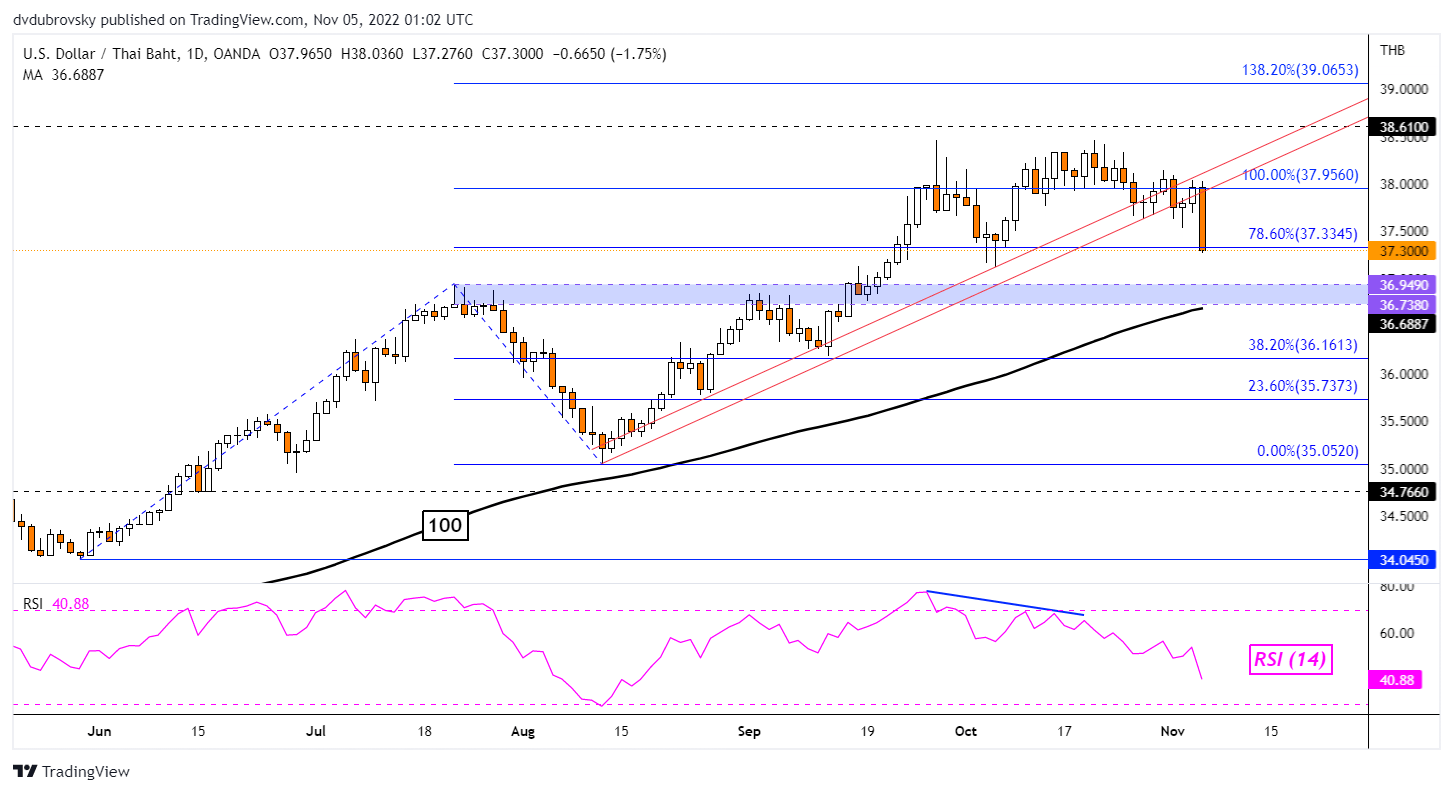
The Thai Baht gained an impressive 1.71% against the US Dollar last Friday. That was the best day for the currency since August 2007! Moreover, USD/THB has broken under the near-term rising trendline from August, offering an increasingly bullish outlook. Key support is the 36.949 – 36.738 former resistance zone, as well as the 100-day SMA. These could hold, pivoting prices higher. In the event of a turn higher, the August trendline could hold as new resistance.

USD/THB Daily Chart

Thai Baht Technical Outlook – Slightly Bullish

Indonesian Rupiah Technical Outlook – Bearish

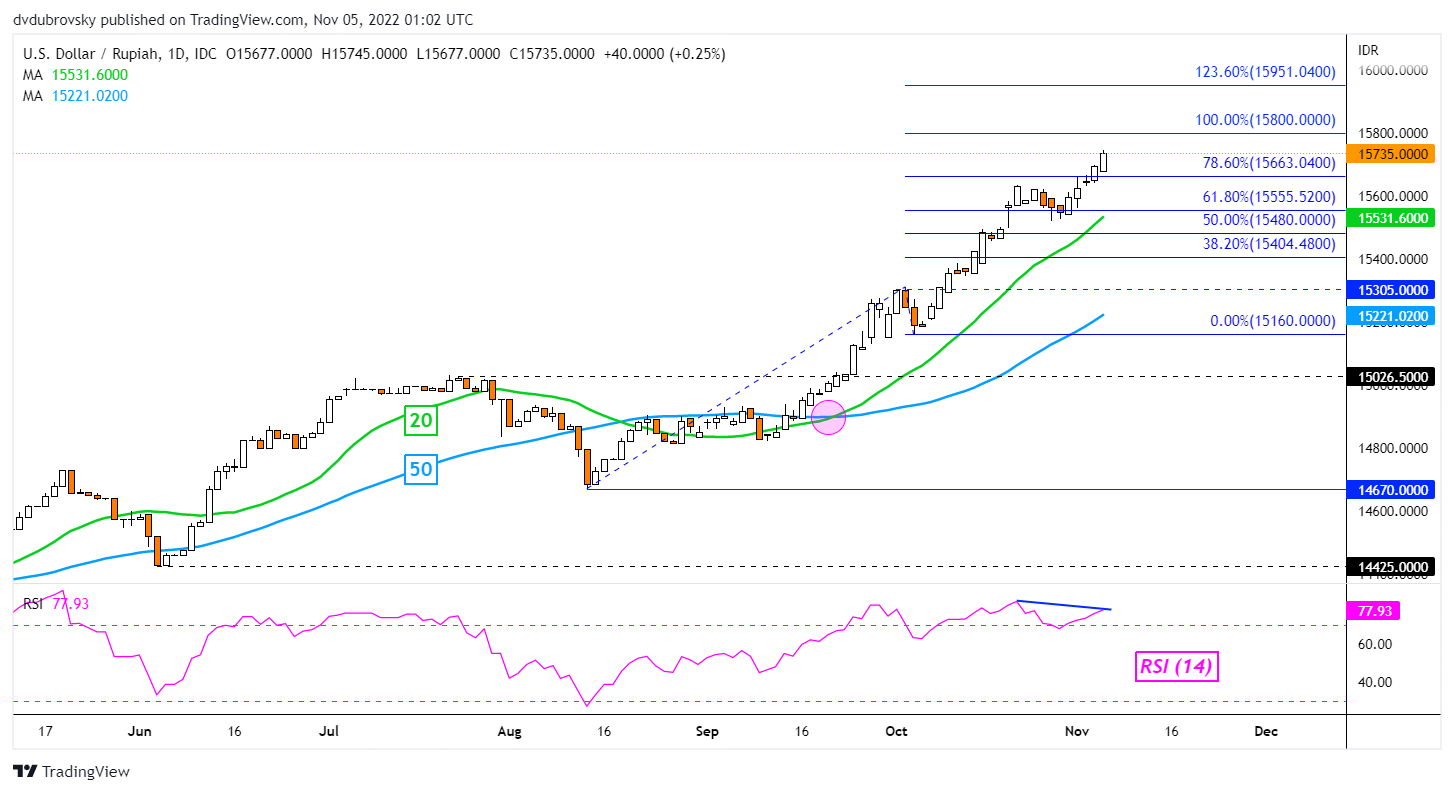
Meanwhile, the US Dollar continued to make progress against the Indonesian Rupiah. USD/IDR confirmed a breakout above the 78.6% Fibonacci extension at 15663, exposing the 100% level at 15800. Keep a close eye on RSI. Negative divergence is present. This could hint at a reversal. A turn lower would place the focus on the 20-day SMA, which may reinstate the broader upside bias. Otherwise, below that is the 50-day SMA.

USD/IDR Daily Chart

Indonesian Rupiah Technical Outlook – Bearish

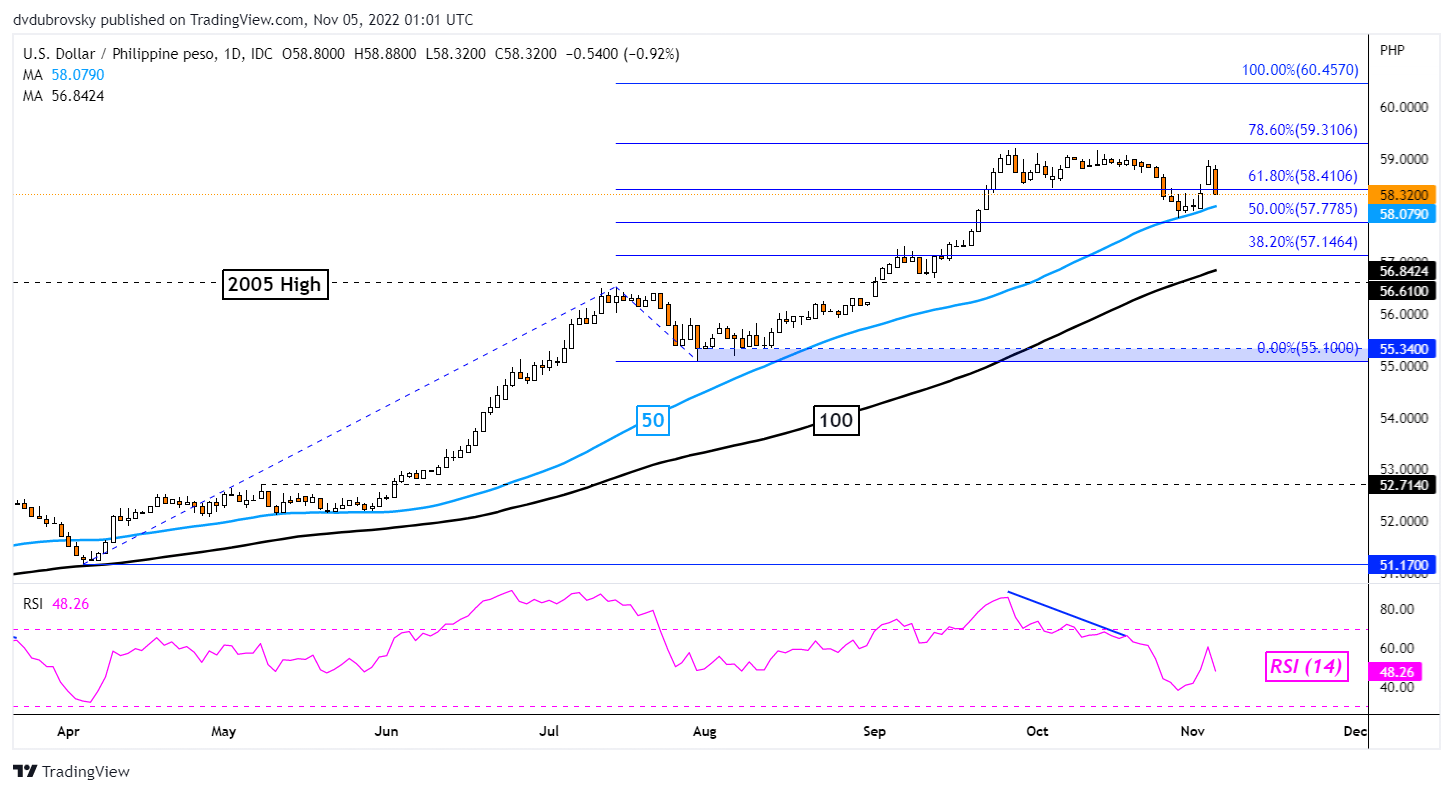
The Philippine Peso was mostly flat against the US Dollar this past week. Prices remain in a consolidative state since USD/PHP upside momentum faded in late September. Still, the pair is trading above both the 50- and 100-day SMAs. These are maintaining the broader upside focus despite recent consolidation. If these hold and pivot USD/PHP higher, the 78.6% Fibonacci extension level at 59.310 would come into focus before the 100% point at 60.457.

USD/PHP Daily Chart

Philippine Peso Technical Outlook – Neutral

image1.png

Crude Oil Eases as Markets Ponder a Possible Chinese Reopening. Will WTI Rally?

Crude oil slipped through Asian trade after a 5% gain on Friday. The run higher was based on rumours that China might ease their Covid-19-related restrictions, but this was dismissed by Chinese health authorities on Saturday.

Several assets have reflected this sway in hopes of a reopening of China but there has been somewhat of a divergence to start the week through Asian trade.

Commodity and currency markets are mostly reflecting the swing from a “risk-on” to a “risk-off” type of trading environment around the news on Monday.

Equity markets, on the other hand, appear to have held onto the hope of higher growth from the world’s second-largest economy. The positive perspective could reflect an article in the People’s Daily online edition that alludes to a managed reopening.

China’s trade balance was released today, and the surplus came in at US$ 85 billion, lower than the US$ 96 billion anticipated, but that didn’t sour the mood.

APAC equities were led higher by Hong Kong’s Hang Seng Index (HSI), which has added over 9% in the last two trading days. Wall Street had a green day on Friday, but futures are pointing toward a soft start to their cash session ahead.

The growth- and commodity-linked Australian and New Zealand Dollars have been the underperformers today while the US Dollar has been the beneficiary in currency land.

The WTI futures contract is near US$ 91.50 bbl while the Brent contract is a touch below US$ 98 bbl. Gold has also eased in Asia today, trading near US$ 1,673 an ounce.

Elsewhere, Apple cut the output forecasts for their new iPhone on the back of lockdowns and lower-than-anticipated demand.

Former Treasury Secretary Larry Summers made comments over the weekend that he thought the terminal rate for the Federal Reserve could be above 6%.

The terminal rate is the Fed Funds level at which the current hiking cycle will peak. The markets now price this in at 5%, to be reached mid-2023. It is understandably eye-catching then that 6% is 100 basis points (bps) higher and some 200 bps above the current policy setting.

Looking ahead, European Central Bank President Christine Lagarde will be speaking, and markets will be watching for any more commentary from her regarding quantitative tightening.

There will also be a sprinkling of Fed speakers crossing the wires.

The full economic calendar can be viewed here.

WTI CRUDE OIL TECHNICAL ANALYSIS

The WTI price has developed a potential Symmetrical Triangle that might indicate a possible bullish breakout unfolding.

Resistance could be at the previous peaks of 93.64, 97.66, 101.88 and 105.24.

On the downside, support may lie at the recent low of 81.30, which is just above a breakpoint at 81.20. The September low of 76.25 could also provide support.

image1.png


Graphical user interface, chart, histogram  Description automatically generated

Crude Oil Prices Surge as Bullish Breakout Drives WTI Back Above $90 Crude Oil Prices Surge as Bullish Breakout Drives WTI Back Above $90

China’s Potential Reopening Refuel Bullish Momentum as Oil Prices Rise

Crude oil prices are grinding higher after speculation of easing China lockdowns fueled a rally in commodities. As the news of a potential reopening of the world’s largest economy raised demand expectations, both WTI and Brent soared, driving oil futures higher.

With the fundamental backdrop providing a catalyst for bullish momentum, US Crude (WTI) futures rose on Friday, settling above $92.00.

Recommended by Tammy Da Costa
Futures for Beginners
Get My Guide

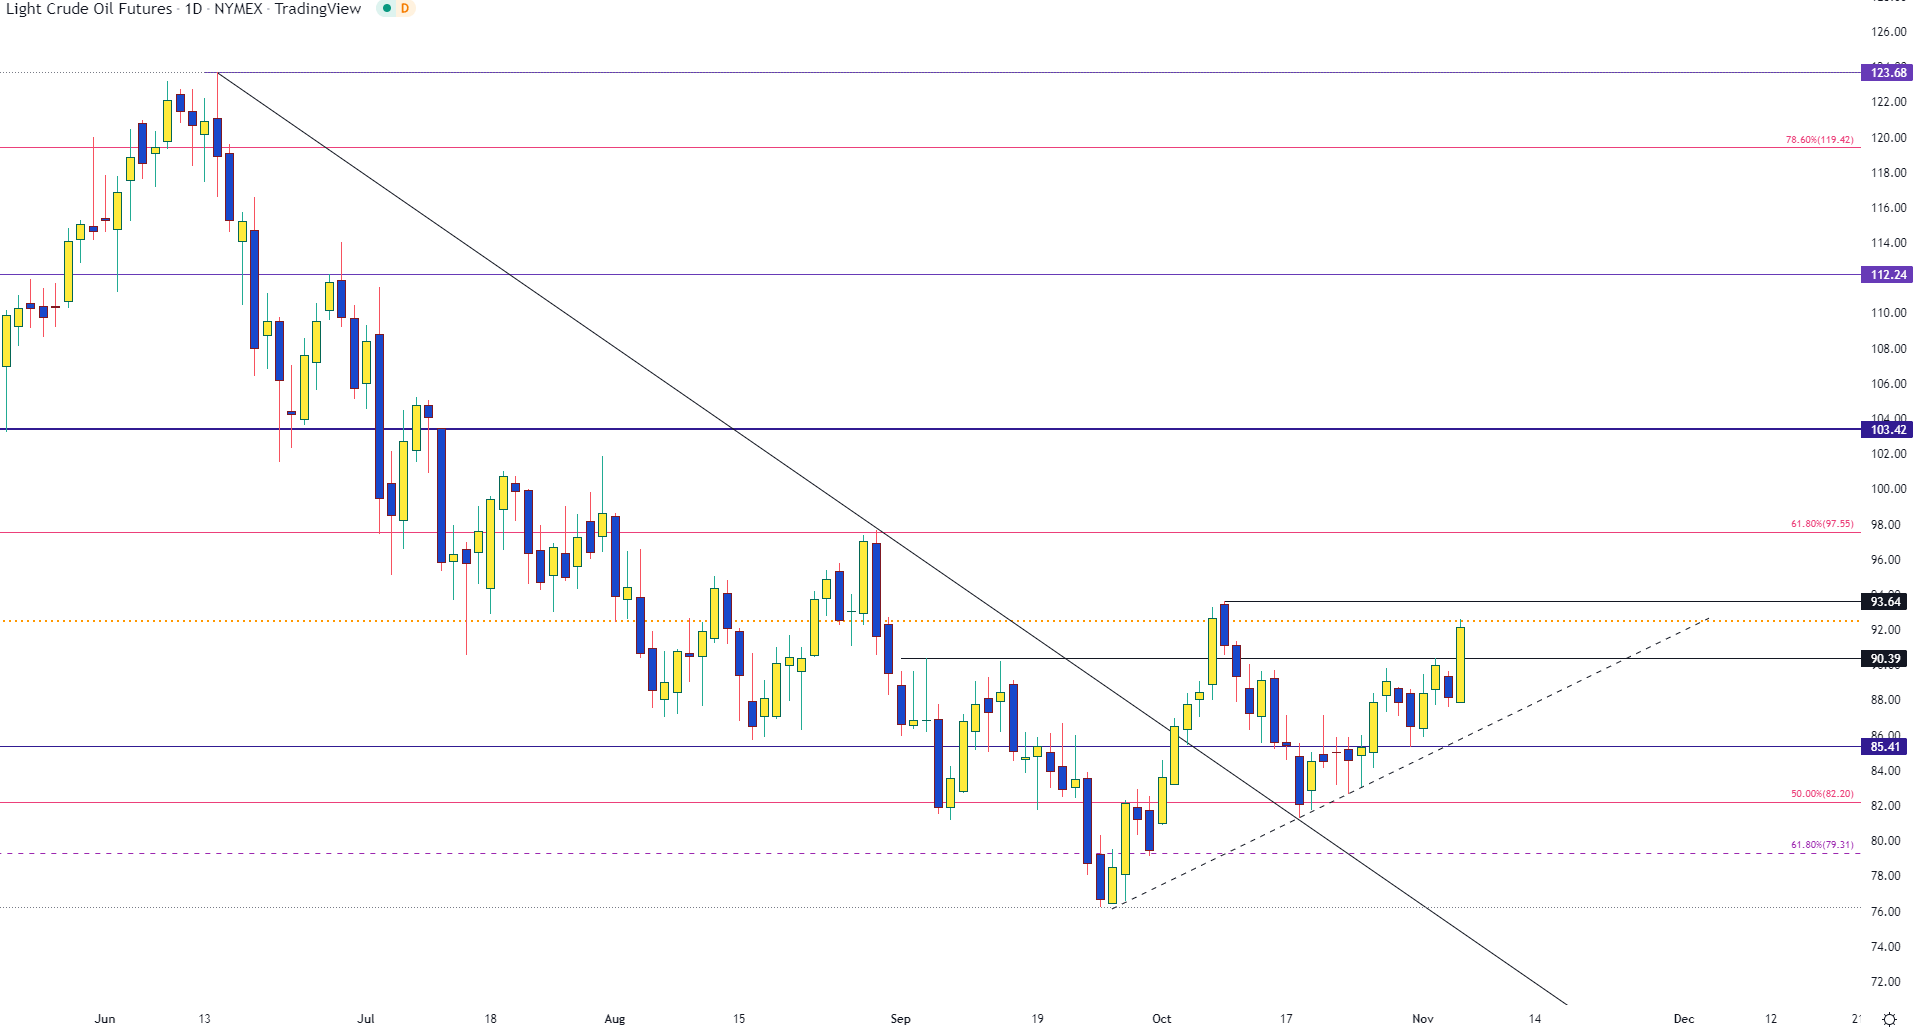
From the daily chart below, the recent full-bodied candle indicates an aggressive move from buyers that allowed them to push through $90.00. With trendline support from the September low firming at around $88.00, an increase in bullish momentum could see prices rising back towards the $95.00 psychological handle.

Crude Oil (CL1!) Daily Chart

Graphical user interface, chart, histogram  Description automatically generated

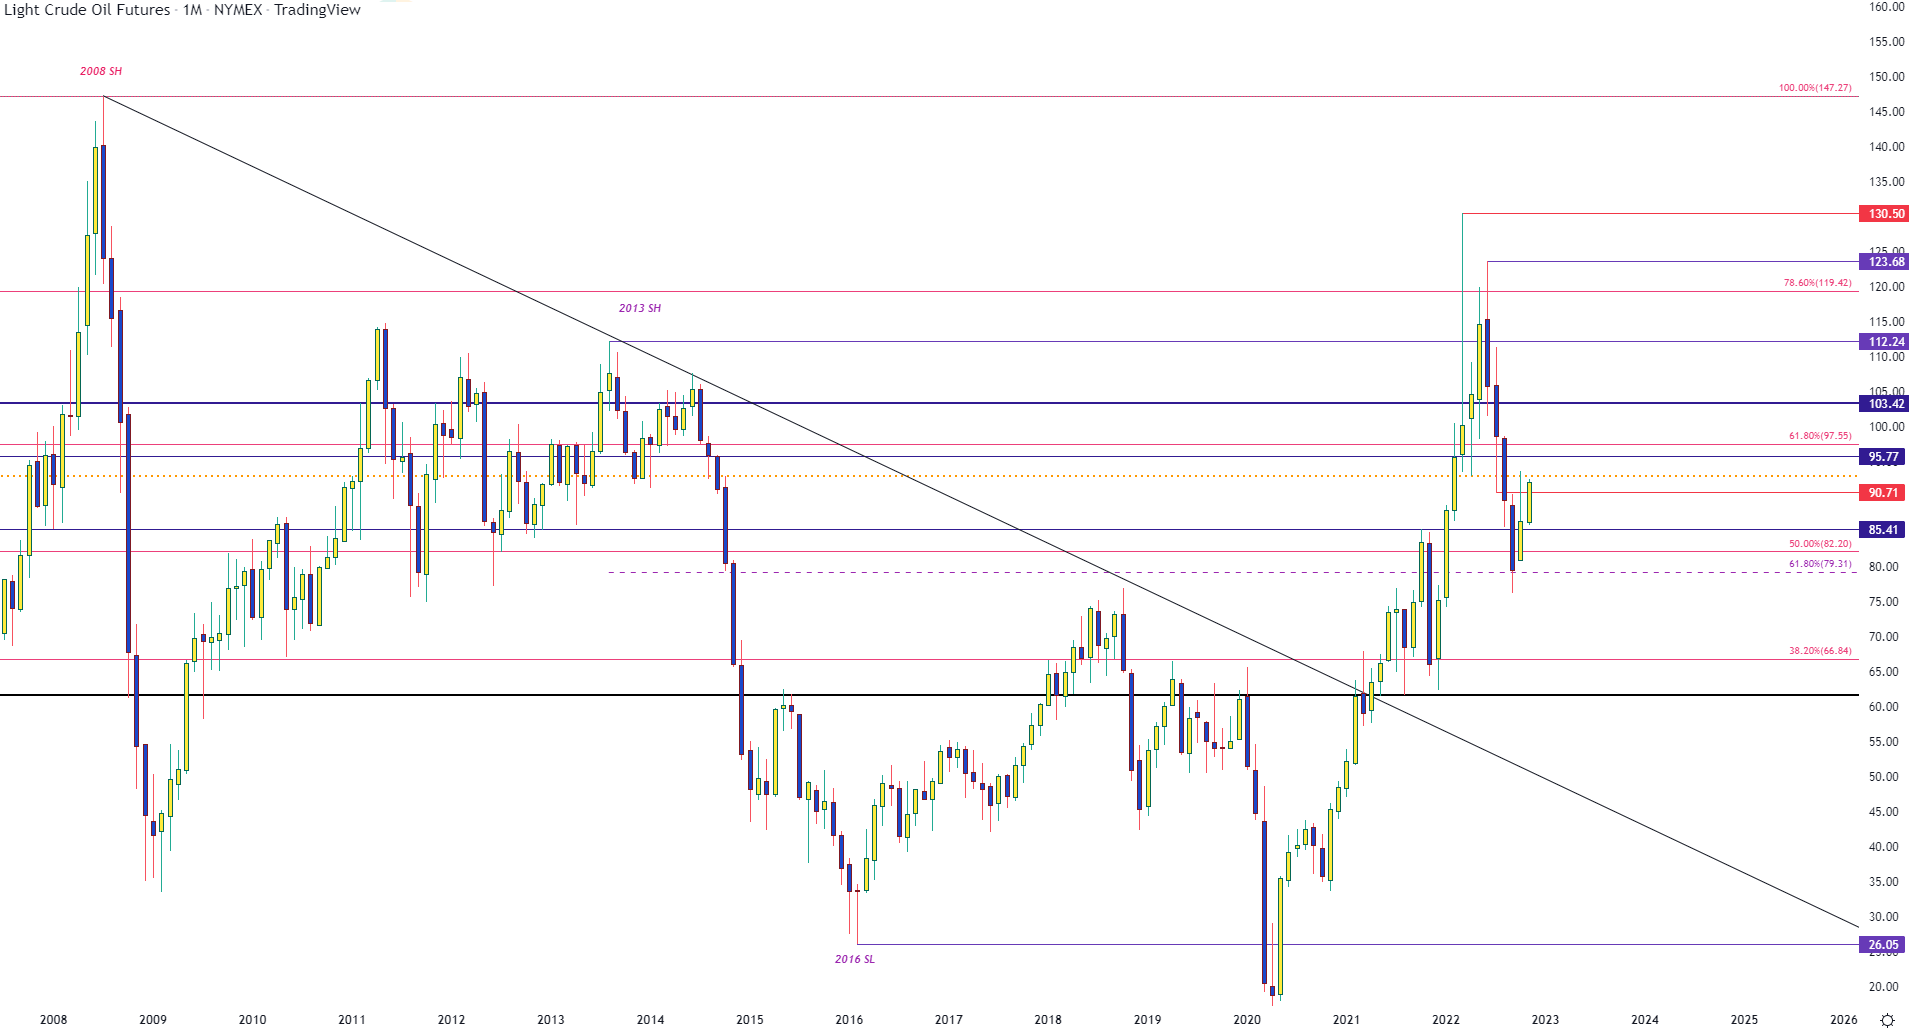
After falling from the June high of 123.68, a four-month sell-off drove WTI to a September low of $76.5 before rising back above $80.00. As a strong rebound drove price action higher, the same technical levels that provided support for WTI in 2013 & 2014 are now assisting in limiting the upside move at $92.50.

With the October high of $93.64 and the $95.00 providing additional resistance, a move higher and a retest of $97.55 (the 61.8% Fibonacci of the 2001 – 2008 move) could drive WTI back to the big $100 mark.

Crude Oil (CL1!) Monthly Chart

Chart, histogram  Description automatically generated