USD/SGD Daily Chart

US Dollar Technical Outlook Remains Grim: USD/SGD, USD/IDR, USD/PHP, USD/THB

Singapore Dollar Technical Outlook – Bullish

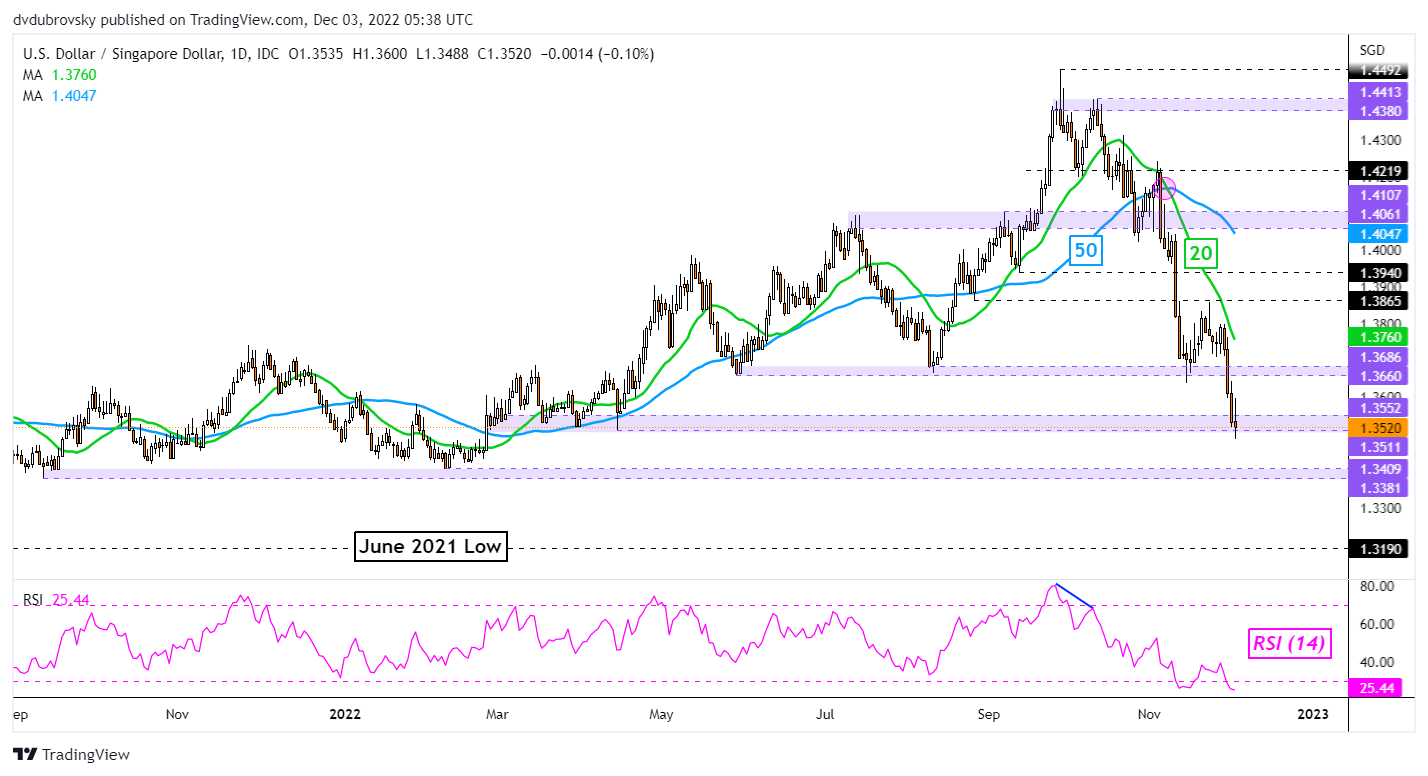
The Singapore Dollar extended its advance against the US Dollar last week. In November, USD/SGD sank 3.84%. That was the best performance for SGD since March 2016. Where does this leave the pair heading into the new week? Keep a close eye on the 1.3511 – 1.3552 support zone. A confirmatory downside breakout would open the door to extending the downtrend, exposing lows from September 2021. In the event of a turn higher, keep a close eye on the 20-day Simple Moving Average (SMA). This could reinstate the downside focus.

USD/SGD Daily Chart

USD/SGD Daily Chart

Indonesian Rupiah Technical Outlook – Bullish

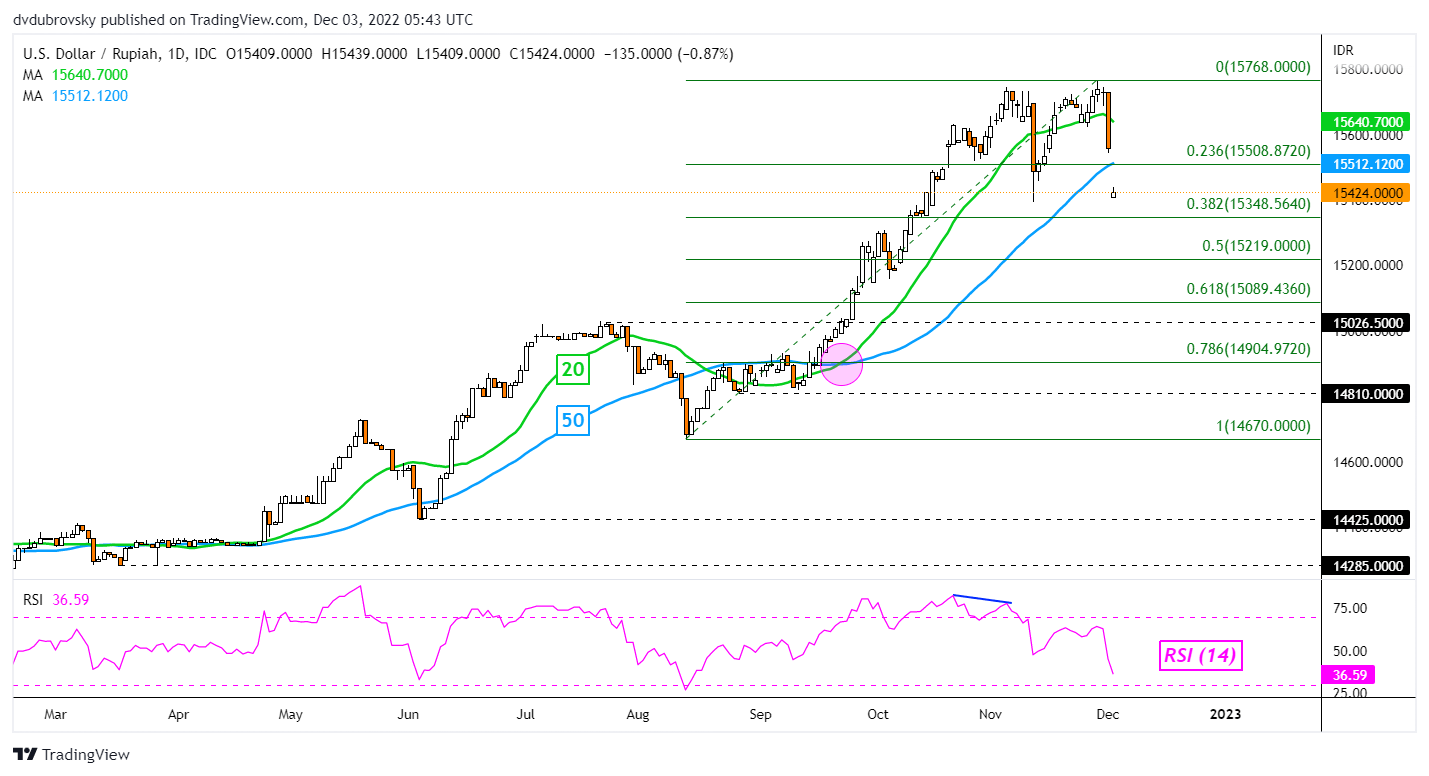
The US Dollar also weakened against the Indonesian Rupiah, sending USD/IDR down 1.57% last week. That was the worst 5-day period since November 2020. Moreover, the pair broke under the 50-day SMA, opening the door to an increasingly downside bias ahead. Keep a close eye on the 20-day SMA, it could cross under the 50, creating a bearish Death Cross. Immediate support is the 38.2% Fibonacci retracement level at 15348. Further losses would expose the midpoint of the retracement at 15219. In the event of a turn higher, a push above the 23.6% level at 15508 would place the focus on the November high at 15768.

USD/IDR Daily Chart

USD/IDR Daily Chart

Philippine Peso Technical Outlook – Bullish

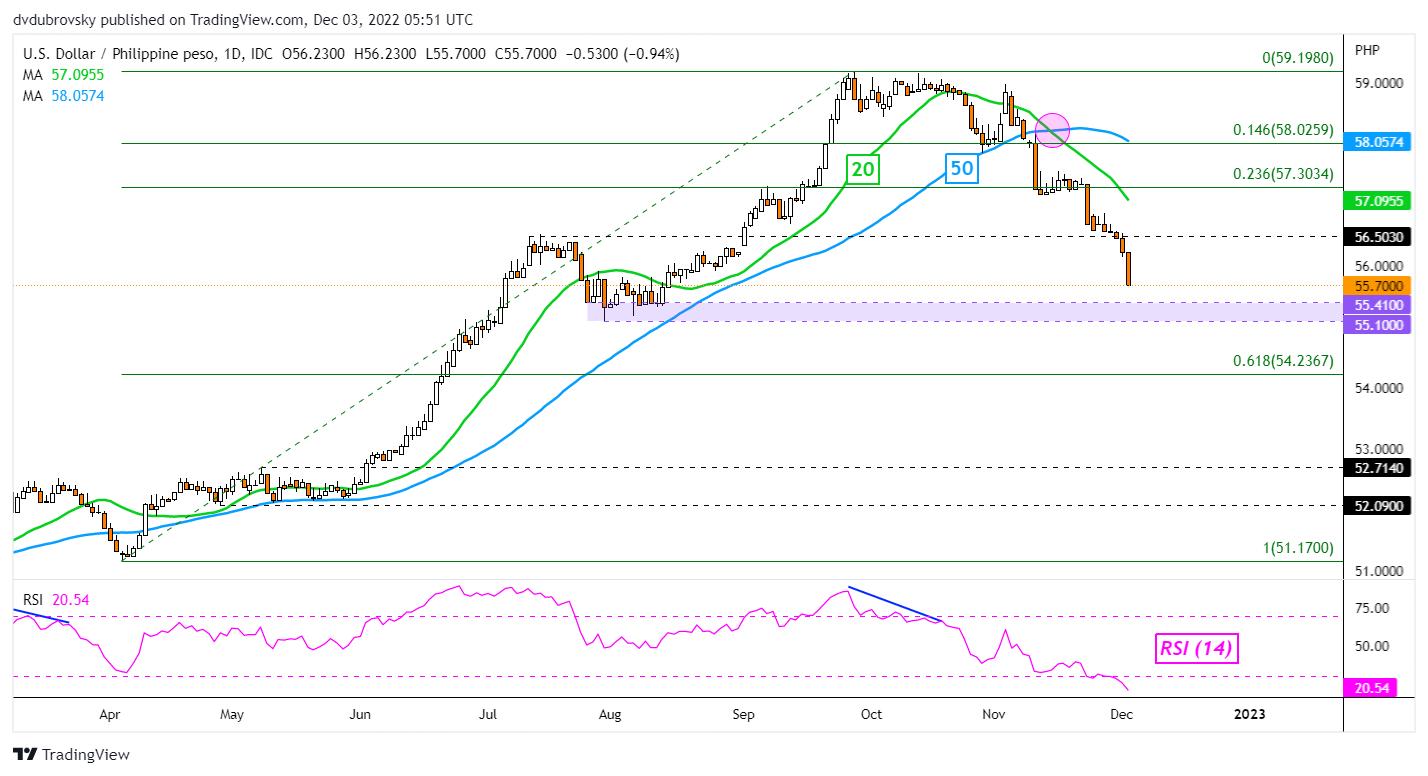
The US Dollar is also quickly losing its upside progress earned earlier this year against the Philippine Peso. USD/PHP fell 2.77% in November, the worst month since March 2016. This has left USD/PHP facing August lows, making for a key zone of support between 55.10 and 55.41. This might be tricky to clear, but doing so would offer an increasingly bullish outlook for PHP, exposing the 61.8% Fibonacci retracement level at 54.236. In the event of a turn higher, key resistance could be the 56.503 inflection point before the 20-day SMA comes into focus.

 USD/PHP Daily Chart

USD/PHP Daily Chart

Thai Baht Technical Outlook – Bullish

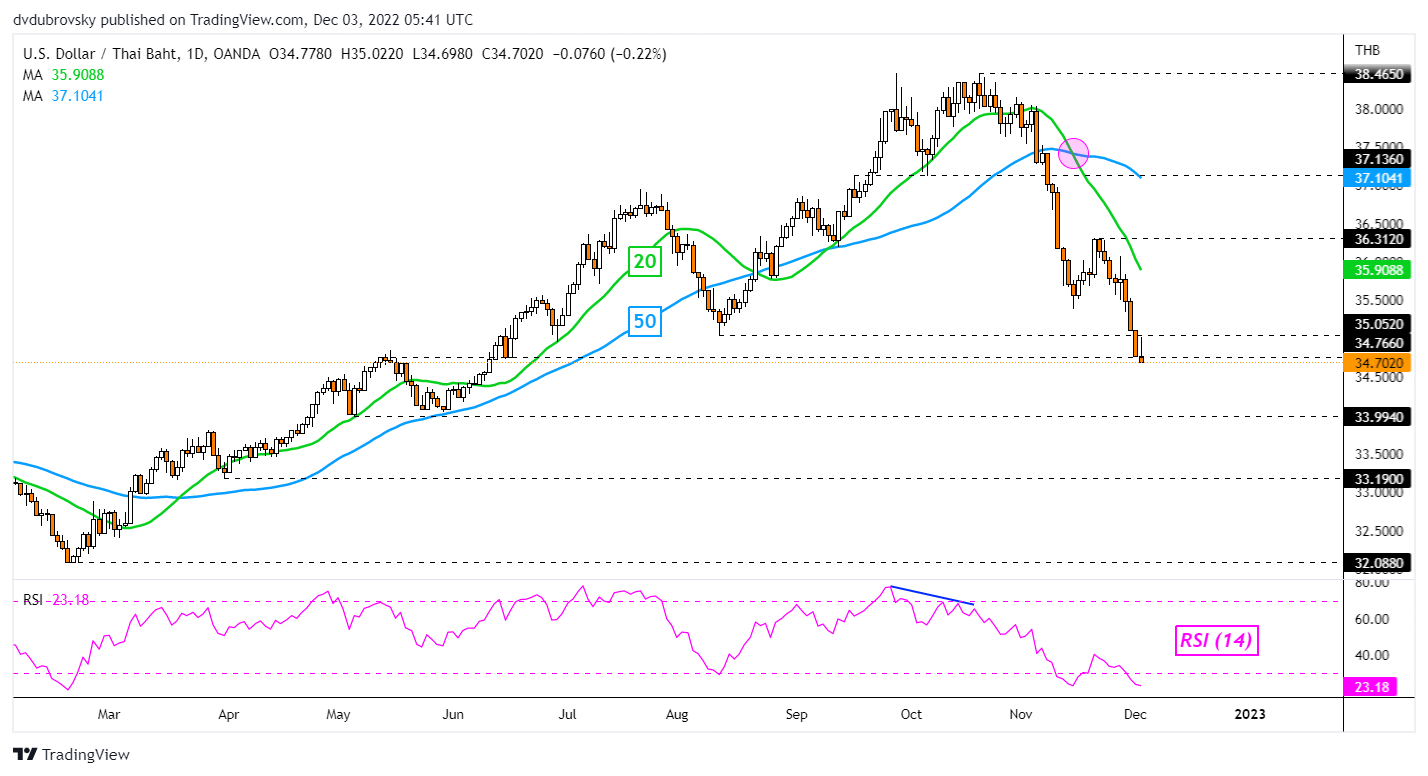
The US Dollar is also quickly losing ground against the Thai Baht, with USD/THB sinking 7.63% in November. That was the worst month since March 1998! Heading into the new week, USD/THB is facing the May low at 33.994. In the event of a turn higher, key resistance could be the 35.052 inflection point. Beyond that the 20-day SMA would likely quickly follow, offering an opportunity to maintain the dominant downside focus.

USD/THB Daily Chart

USD/THB Daily Chart


USDCAD steps on 20-SMA; bears still present

USDCAD had a lukewarm start to December, barely gaining bullish traction despite taking support from the 20-day simple moving average (SMA) at 1.3394.

The pair has completed two consecutive negative months, charting a bearish head and shoulders pattern around the 29-month peak of 1.3976. Even though the bulls attempted to deactivate the bearish structure above the 1.3500 neckline this week, the 50-day simple moving average (SMA) pressed the price aggressively lower, keeping negative trend risks alive.

In momentum indicators, the RSI and the MACD have been trending up since mid-November, but the former has yet to climb successfully above its 50 neutral mark, while the latter hasn’t exited the negative zone.

Nevertheless, there are a couple of support levels that may prevent an outlook deterioration. The upper constraining line from August 2021 might immediately attract attention around 1.3330 if the 20-day SMA at 1.3400 gives way. Then, the 38.2% Fibonacci retracement of the 1.2006-1.3976 at 1.3222 could defend the neutral trajectory in the short-term picture. Should selling forces persist, the tentative ascending trendline could next come to the rescue near 1.3120. Otherwise, the decline may stretch towards the 200-day SMA and the 50% Fibonacci of 1.2990.

On the upside, the 1.3500–1.3565 zone and the 50-day SMA will be closely watched. A sustainable move above the bar could bolster the bullish action up to the 1.3745–1.3800 resistance region. Running higher, the pair will push for new higher highs above the 1.3976 top.

In brief, USDCAD is lacking bullish signals, with traders waiting for a clear break above 1.3500-1.3565 or below 1.3330 to direct the market accordingly.

XM TV


Watch Now


Latest News

Technical Analysis – USDCAD steps on 20-SMA; bears still present


Technical Analysis – GBPJPY crosses below 50-day SMA as bearish bias strengthens

Technical Analysis – LTCUSD completes golden cross but advance pauses

Technical Analysis – Silver bulls roar back; meet key resistance

European Shares Set For Weak Open As Investors Await US Jobs Report

European stocks are seen opening slightly lower on Friday, as caution prevails ahead of the closely watched U.S. monthly employment report for November, due out later in the day.

Economists expect employment to jump by 200,000 jobs in November after an increase of 261,000 jobs in October. The jobless rate is expected to hold at 3.7 percent.

A cool-off in employment figures would be a welcome sign for Federal Reserve officials who have more work to do in tightening policy.

Asian markets succumbed to selling pressure and the dollar edged off 16-week lows against a basket of currencies, while gold eased but was on track for its best week in three.

Oil prices edged up slightly and were on track for their first weekly gains after three consecutive weeks of decline.

Media reports suggest that the European Union was edging closer to setting a USD 60-per-barrel price cap on Russian oil.

U.S. stocks ended mixed overnight as investors reacted to a mixed batch of economic data.

While U.S. manufacturing activity shrank for the first time in 2-1/2 years in November, consumers’ incomes and expenditures increased in October and first-time unemployment benefits declined during Thanksgiving week, separate reports showed. A measure of inflation that is closely monitored by the Federal Reserve eased but remained at an elevated level in October.

The Dow dipped 0.6 percent and the S&P 500 slipped marginally while the tech-heavy Nasdaq Composite edged up 0.1 percent.

European stocks hit a six-month high Thursday on the back of Fed Chair Jerome Powell’s dovish remarks on the pace of potential rate hikes and signs of easing COVID curbs in China.

The pan European STOXX 600 climbed 0.9 percent. The German DAX gained 0.7 percent and France’s CAC 40 index inched up 0.2 percent while the U.K.’s FTSE 100 eased 0.2 percent.

Thai Stock Market May Run Out Of Steam On Friday

The Thai stock market has climbed higher in three straight sessions, gathering more than 30 points or 2 percent along the way. The Stock Exchange of Thailand now sits just beneath the 1,650-point plateau although it may be stuck in neutral on Friday.

The global forecast for the Asian markets is mixed and flat ahead of key U.S. employment data later in the day. The European and U.S. bourses were mixed and little changed and the Asian bourses are tipped to follow suit.

The SET finished modestly higher on Thursday following mixed performances from the financial shares and energy producers.

For the day, the index improved 13.08 points or 0.80 percent to finish at 1,648.44 after trading between 1,639.02 and 1,651.76. Volume was 18.838 billion shares worth 75.294 billion baht. There were 931 gainers and 695 decliners, with 516 stocks finishing unchanged.

Among the actives, Advanced Info added 0.53 percent, while Thailand Airport retreated 1.33 percent, Asset World sank 0.79 percent, Banpu gained 0.76 percent, Bangkok Bank collected 0.69 percent, Bangkok Dusit Medical plunged 3.31 percent, Bangkok Expressway skidded 1.07 percent, BTS Group shed 0.60 percent, CP All Public climbed 1.15 percent, Charoen Pokphand Foods rose 0.42 percent, Energy Absolute increased 0.52 percent, Gulf gained 0.47 percent, IRPC lost 0.65 percent, Kasikornbank fell 0.35 percent, Krung Thai Bank improved 0.57 percent, Krung Thai Card strengthened 1.28 percent, PTT Exploration and Production dropped 1.06 percent, SCG Packaging jumped 1.81 percent, Siam Commercial Bank was up 0.48 percent, Siam Concrete advanced 0.89 percent, Thai Oil spiked 1.80 percent, True Corporation rallied 2.20 percent, TTB Bank slumped 0.71 percent and B. Grimm, PTT Oil & Retail, PTT and PTT Global Chemical were unchanged.

The lead from Wall Street is murky as the major averages were unable to hold early gains on Thursday, with only the NASDAQ able to break back into the green.

The Dow stumbled 194.76 points or 0.56 percent to finish at 34,395.01, while the NASDAQ added 14.45 points or 0.13 percent to close at 11,482.45 and the S&P 500 eased 3.54 points or 0.09 percent to end at 4,076.57.

The lack of direction shown by the broader markets came as traders looked ahead to the Labor Department’s closely watched monthly jobs report later today.

The data could affect the outlook for interest rates, although the impact may be somewhat muted following Federal Reserve Chair Jerome Powell’s remarks on Wednesday hinting at a slowdown in the pace of rate hikes as soon as next month.

In economic news, the Institute for Supply Management said manufacturing activity contracted for the first time in over two years in November. Also, the Labor Department said first-time claims for U.S. unemployment benefits pulled back by more than expected last week.

Crude oil futures settled higher Thursday on easing concerns about the outlook for energy demand, while a weaker dollar amid rising prospects of smaller rate hikes by the Fed also contributed to the increase in oil prices. West Texas Intermediate Crude oil futures for January gained $0.67 or 0.8 percent at $81.22 a barrel.

RBA Gov. Lowe says Australian inflation expectations are still well anchored

Reserve Bank of Australia Governor Lowe, speaking at an event in Thailand: • Inflation expectations in remain well anchored. • Household spending in Australia has been resilient to the higher interest rates so far. • In this cycle policy lags are likely to be longer. • The Reserve Bank of Australia is attempting to slow inflation without too much negative . • Impact on the economy.

Yeah, nah from RBNZ on changing the way it makes OCR decisions

The Reserve Bank is toying with the idea of simply voting on changes to monetary policy instead of first having to try to seek a consensus, acknowledging a danger of “groupthink” on the committee that makes those decisions.

However, it appears to be minded towards maintaining the status quo.

The bank’s decisions, and the way it reaches them, have both come under growing scrutiny in the wake of ongoing criticism that it was too slow to dampen inflation pressures last year and could now be overcompensating by engineering a recession.

Its current charter requires the seven members of its monetary policy committee (MPC), including its three external members, to a seek a consensus on decisions such as whether and by how much to raise or lower the official cash rate, and to hold an anonymous vote if a consensus can’t be reached.

Former Reserve Bank assistant governor John McDermott last week queried how the committee has always managed to reach a consensus since it was established in 2019, despite being faced with huge economic uncertainties.

The bank kicked off a second round of public consultations on its remit on Wednesday and noted in a discussion document that its decision-making practice was unusual among its major peers.

STUFF
Reserve Bank Governor Adrian Orr discusses lifting the OCR by 75 basis points to 4.25%.

Voting was more common than consensus-based decision-making among similar central banks, and of those that did hold votes, most published details of who voted which way, it said.

The bank said in its discussion document that its emphasis on seeking a consensus could “reduce the benefits associated with having a diverse committee”.

It also said there was a further risk of its chairperson, currently governor Adrian Orr, or other members of the committee being “overly dominant when using a consensus-based model”.

But it said the latter challenge could still be there if votes were taken, and that the committee’s processes had been set up to “reduce the risk of ‘groupthink’ developing”.

The bank appeared to come out against change, stating that neither a consensus nor a vote-centric approach would consistently deliver better decisions than the other and that there was “no strong evidence supporting a move away from the consensus-based decision-making model”.

Chart 1: Global Vehicle Sales by Region

Global Auto Sales Recovery Stalls Again in October While Sales Climb in North America

Global auto sales posted another month-over-month decline in October following a similar pull-back in September, still driven by a deceleration in Asia Pacific (-4.7% m/m sa) and South America (-9.2% m/m sa). Auto sales in China contracted again by -7.0% m/m (sa) in October as the impact of the lockdown lingers—making it the third consecutive month of decline—but still up 11.2% from a year ago. Experiencing a series of slowdowns in the second half of the year, South American auto sales plunged across the board in October, with Brazil and Peru leading the drop. Sales recovery in Western Europe also lost some momentum and recorded a -0.3% m/m (sa) dip in October. Sales in the largest market—Germany—have influenced headline numbers with its pullback of -4.9% m/m, though sales were down in many others (i.e., France -7.7% m/m, Spain -5.3% m/m). A strong rebound in the UK (23.2% m/m sa) offsets the majority of the losses in the region.

Chart 1: Global Vehicle Sales by Region

In contrast to the weak headline number, North American sales saw clear signs of a turnaround in October with sales jumping by 9.7%, building up on the 1.7% gain last month. The US drove the improving trend with sales up 10.1% m/m (sa). Canada saw its first gain after five months of consecutive declines, posting a double-digit growth of 12.9% m/m (sa).

The strong sales in October on the back of improving inventory will likely persist—in line with our expectations of a gradual recovery for the rest of the year. We are holding the line on our outlook for Canadian and US auto sales, with our 2022 forecast for Canada and the US standing at 1.5 mn and 13.6 mn units, respectively. We see auto sales continuing to improve by over 8% in both countries in 2023 as supply improves, but with considerable bandwidths around those figures in light of economic (and policy) uncertainty, layered on top of weak sight lines on auto production plans.

A SLOW REBALANCING OF SUPPLY AND DEMAND IN NORTH AMERICA

After limited inventory took a toll on sales for most of the year, North American markets saw some early signs of easing supply constraints in recent months. Inventory levels in the US stood at 51% higher than in the same month a year ago in October, and light vehicle days’ supply reached the highest level since May 2021 (chart 2). While inventory levels showed some improvement, they remained low by historical standards, especially for some Asian non-luxury brands and Japanese and European luxury brands, according to Cox Automotive. The rate at which inventory is picking up is not fast enough to bring the inventory-to-sales ratio back to a normal level, which has been bottoming yet without any material sign of a turnaround. Proprietary data in Canada also suggests a slight uptick in inventory relative to a year ago, but the market conditions remain just as tight as in the US, if not more.

Chart 2: US Light Vehicle Inventory

Demand-side factors have been holding up strong amid rising interest rates, especially in Canada. Canadian GDP surprised to the upside in Q3 and posted a strong q/q growth rate of 2.9%, pushing the anticipated slowdowns into later this year/early next year. The household saving rate edged up to 5.7% as of Q3, well above the pre-pandemic average of 3–4%. Primary household income rose 8.7% since the same quarter last year on the back of strong wage growth. Soaring immigration could give vehicle demand a decent boost moving forward—Canada is on track to beat the upper range of its 2022 immigration target of 445k people, which would be close to a 10% increase from last year’s record-level immigration. The Government of Canada also increased its immigration targets for the coming two years (chart 3), planning to welcome 447k new permanent residents in 2023 and 451k in 2024.

Chart 3: Proposed Immigration for Canada

Car ownership is getting more expensive, but wages are catching up. In the US, new vehicle inflation stood at 8.4% y/y in October, down from the peak of over 13% in April (chart 4). JD Power reported the average monthly finance payment at $712 in November, up 7.2% from a year ago. As the pace of new vehicle price growth slows, wage growth remains steady at an annualized rate of 4% m/m as of October, bringing average hourly earnings 4.7% higher than in the same month a year prior. In Canada, new vehicle inflation stood at a similar level as in the US at 7.9% y/y, but wages have been growing faster at an annualized 8.8% m/m as of October, 5.5% higher than a year ago (chart 5).

Chart 4: US: New Vehicle Inflation vs Wage Growth; Chart 5: Canada: New Vehicle Inflation vs Wage Growth

But the headwinds to auto demand in the near term are mounting. In our latest forecasts, we see central banks to raise policy rates further by early next year given the persistent inflationary pressures. A mild recession is likely in the first half of 2023 along with some uptick in unemployment, but with policy actions in the coming weeks to play a determining role in whether this baseline holds. As interest rates still have rooms to rise in both Canada and the US, broader cost of living pressures along with uncertainties on the financial markets will likely weigh on sentiment and curtail purchases down the road—but so far these impacts have been masked by limited inventory.

Replenishing inventory in an environment of still-solid demand will take time despite the improving trend in production. As of October, North American production is still down -13.5% year-to-date compared to 2019. Wards Automotive forecasts light vehicle production to end the year 11% (1.4 mn units) higher relative to 2021 and pick up by another 7% (1.1 mn units) in 2023. Domestically produced vehicles account for roughly 78% of North American sales, and with an average sales loss of close to 3 mn per year since the pandemic, the forecasted recovery won’t be able to catch up to sales without an expansion in capacity. Currently, as production is highly constrained by elevated input costs and tight labour markets, we don’t expect to see the markets fully restoring the supply-demand balance in 2023.

Table 1—Global Auto Sales Outlook (mns units); Table 2—Provincial Auto Sales Outlook (thousands of units ann.); Table 3—North American Annual Production Outlook
Table 3—Global Auto Sales Outlook (mns units)

Asian Markets Mostly Lower Amid Cautious Trades

Asian stock markets are trading mostly lower on Friday, following the mixed cues from global markets overnight, as traders largely cautious and refrained from making significant moves ahead of the release of the closely watched US monthly jobs data later in the day, which could affect the outlook for interest rates. Meanwhile, traders are optimistic over a Chinese demand recovery amid easing Covid curbs in China. Asian markets ended mostly higher on Thursday.

The Australian stock market is notably lower on Friday, giving up some of the gains in the previous three sessions, with the benchmark S&P/ASX 200 falling below the 7,300 level, following the mixed cues from global markets overnight, with losses in energy and financial stocks partially offset by gains in gold miners.

The benchmark S&P/ASX 200 Index is losing 55.20 points or 0.75 percent to 7,299.10, after hitting a low of 7,296.30 earlier. The broader All Ordinaries Index is down 55.60 points or 0.74 percent to 7,498.40. Australian markets ended significantly higher on Thursday.

Among major miners, BHP Group and Rio Tinto are losing almost 1 percent each, while Fortescue Metals is edging down 0.5 percent. Mineral Resources is edging up 0.5 percent and OZ Minerals is flat.

Oil stocks are weak. Santos is losing more than 1 percent, Woodside Energy is declining almost 2 percent and Beach energy is edging down 0.4 percent, while Origin Energy is edging up 0.1 percent.

Shares in Warrego Energy are surging almost 9 percent after Beach energy sweetened its acquisition offer for the next generation oil and gas company amid receipt of competing bids from two others.

Among tech stocks, WiseTech Global and Xero are losing almost 1 percent each, while Afterpay owner Block and Zip are gaining almost 1 percent each. Appen is flat.

Among the big four banks, National Australia Bank, Westpac and ANZ Banking are losing almost 1 percent each, while Commonwealth Bank is declining more than 1 percent.

Gold miners are higher. Northern Star Resources is gaining more than 2 percent, Newcrest Mining is advancing more than 3 percent, Evolution Mining is adding almost 3 percent. Gold Road Resources is up almost 2 percent and Resolute Mining is surging 5.5 percent.

In economic news, the value of retail sales in Australia was down a seasonally adjusted 0.2 percent on month in October, the Australian Bureau of Statistics said on Friday – coming in at A$35.017 billion. That missed forecasts for an increase of 0.2 percent following the 0.6 percent gain in September. On a yearly basis, retail sales climbed 12.5 percent.

Meanwhile, the value of owner-occupied home loans issued in Australia in October was down a seasonally adjusted 2.9 percent on month, coming in at A$17.16 billion. That exceeded expectations for a decline of 4.5 percent following the 9.3 percent drop in September. On a yearly basis, home loans stumbled 17.2 percent.

In the currency market, the Aussie dollar is trading at $0.680 on Friday.

The Japanese stock market is sharply lower on Friday, giving up all of the gains in the previous session, with the benchmark Nikkei 225 falling below the 27,700 level, following the mixed cues from global markets overnight, with weakness across all sectors, led by exporters and financial stocks.

The benchmark Nikkei 225 Index closed the morning session at 27,679.84, down 546.24 points or 1.94 percent, after hitting a low of 27,662.12. Japanese stocks closed significantly higher on Thursday.

Market heavyweight SoftBank Group is edging down 0.5 percent, while Uniqlo operator Fast Retailing is losing more than 1 percent. Among automakers, Honda and Toyota are declining more than 2 percent each.

Asian stock markets are trading mostly lower on Friday, following the mixed cues from global markets overnight, as traders largely cautious and refrained from making significant moves ahead of the release of the closely watched US monthly jobs data later in the day, which could affect the outlook for interest rates. Meanwhile, traders are optimistic over a Chinese demand recovery amid easing Covid curbs in China. Asian markets ended mostly higher on Thursday.

The Australian stock market is notably lower on Friday, giving up some of the gains in the previous three sessions, with the benchmark S&P/ASX 200 falling below the 7,300 level, following the mixed cues from global markets overnight, with losses in energy and financial stocks partially offset by gains in gold miners.

The benchmark S&P/ASX 200 Index is losing 55.20 points or 0.75 percent to 7,299.10, after hitting a low of 7,296.30 earlier. The broader All Ordinaries Index is down 55.60 points or 0.74 percent to 7,498.40. Australian markets ended significantly higher on Thursday.

Among major miners, BHP Group and Rio Tinto are losing almost 1 percent each, while Fortescue Metals is edging down 0.5 percent. Mineral Resources is edging up 0.5 percent and OZ Minerals is flat.

Oil stocks are weak. Santos is losing more than 1 percent, Woodside Energy is declining almost 2 percent and Beach energy is edging down 0.4 percent, while Origin Energy is edging up 0.1 percent.

Shares in Warrego Energy are surging almost 9 percent after Beach energy sweetened its acquisition offer for the next generation oil and gas company amid receipt of competing bids from two others.

Among tech stocks, WiseTech Global and Xero are losing almost 1 percent each, while Afterpay owner Block and Zip are gaining almost 1 percent each. Appen is flat.

Among the big four banks, National Australia Bank, Westpac and ANZ Banking are losing almost 1 percent each, while Commonwealth Bank is declining more than 1 percent.

Gold miners are higher. Northern Star Resources is gaining more than 2 percent, Newcrest Mining is advancing more than 3 percent, Evolution Mining is adding almost 3 percent. Gold Road Resources is up almost 2 percent and Resolute Mining is surging 5.5 percent.

In economic news, the value of retail sales in Australia was down a seasonally adjusted 0.2 percent on month in October, the Australian Bureau of Statistics said on Friday – coming in at A$35.017 billion. That missed forecasts for an increase of 0.2 percent following the 0.6 percent gain in September. On a yearly basis, retail sales climbed 12.5 percent.

Meanwhile, the value of owner-occupied home loans issued in Australia in October was down a seasonally adjusted 2.9 percent on month, coming in at A$17.16 billion. That exceeded expectations for a decline of 4.5 percent following the 9.3 percent drop in September. On a yearly basis, home loans stumbled 17.2 percent.

In the currency market, the Aussie dollar is trading at $0.680 on Friday.

The Japanese stock market is sharply lower on Friday, giving up all of the gains in the previous session, with the benchmark Nikkei 225 falling below the 27,700 level, following the mixed cues from global markets overnight, with weakness across all sectors, led by exporters and financial stocks.

The benchmark Nikkei 225 Index closed the morning session at 27,679.84, down 546.24 points or 1.94 percent, after hitting a low of 27,662.12. Japanese stocks closed significantly higher on Thursday.

Market heavyweight SoftBank Group is edging down 0.5 percent, while Uniqlo operator Fast Retailing is losing more than 1 percent. Among automakers, Honda and Toyota are declining more than 2 percent each.


read moreRTTNews2d

Exela Pharma Recalls Sodium Bicarbonate Injection Top Biotech IPOs Of 2021 That Soared As Much As- 500%- Share Story
Facebook LinkedIn Twitter Telegram WhatsApp

Copy About Login


In the tech space, Advantest, Screen Holdings and Tokyo Electron are edging down 0.2 to 0.4 percent each.

In the banking sector, Mizuho Financial and Mitsubishi UFJ Financial are losing almost 2 percent each, while Sumitomo Mitsui Financial is down almost 1 percent.

Among major exporters, Canon is losing 2.5 percent, Sony is declining almost 2 percent, Panasonic is slipping almost 3 percent and Mitsubishi Electric is down more than 3 percent.

Among the other major losers, Daiichi Sankyo, Mitsubishi Motors and T&D Holdings are losing almost 5 percent each, while Fujikura, Japan Steel Works, NTN and Minebea Mitsumi are slipping more than 4 percent each. MS&AD Insurance Group and Olympus are down almost 4 percent each, while JFE Holdings, Citizen Watch, Yamaha Motor, JGC Holdings, Sompo Holdings and Seiko Epson are declining more than 3 percent each.

Conversely, CyberAgent is surging almost 6 percent.

In economic news, the monetary base in Japan was down 6.4 percent on year in November, the Bank of Japan said on Friday – coming in at 616.820 trillion yen. That follows the 6.9 percent annual contraction in October. The seasonally adjusted monetary base was up 17.0 percent after tumbling 33.0 percent in the previous month.

In the currency market, the U.S. dollar is trading in the lower 135 yen-range on Friday.

Elsewhere in Asia, South Korea is down 1.1 percent, while New Zealand, China, Hong Kong, Singapore, Malaysia, Taiwan and Indonesia are lower by between 0.1 and 0.7 percent each.

On Wall Street, stocks turned in a relatively lackluster performance during trading on Thursday after skyrocketing over the course of Wednesday’s session. The Nasdaq and the S&P 500 spent the day bouncing back and forth across the unchanged line, while the narrower Dow gave back ground.

The major averages eventually ended the session mixed. While the Nasdaq crept up 14.45 points or 0.1 percent to 11,482.45, the Dow slid 194.76 points or 0.6 percent to 34,395.01 and the S&P 500 edged down 3.54 points or 0.1 percent to 4,076.57.

The major European also turned in a mixed performance on the day. While the U.K.’s FTSE 100 Index edged down 0.2 percent, the French CAC 40 Index crept up 0.2 percent and the German DAX Index climbed 0.7 percent.

Crude oil futures settled higher Thursday on easing concerns about the outlook for energy demand, while a weaker dollar amid rising prospects of smaller rate hikes by the Fed also contributed to the increase in oil prices. West Texas Intermediate Crude oil futures for January gained $0.67 or 0.8 percent at $81.22 a barrel.
S Labor Market to Cool Further But Not Enough Yet to Assure Fed

The remarkably resilient US jobs market is beginning to cool, but Friday’s employment report will fall far short of the turning point Federal Reserve officials are seeking in their battle to beat back inflation.

The median projection in a Bloomberg survey of economists calls for payrolls to rise 200,000 in November and hourly earnings to climb 4.6% from a year ago. There are signs labor demand is ebbing, but a bigger slowdown is needed to bring that demand more in line with labor supply in order to contain the wage growth that’s helped fuel inflation.

“The Fed has probably succeeded in stopping imbalances from getting larger” in the labor market, said Michael Gapen, head of US economics at Bank of America Corp. “We’re now all starting to look for reasons to suggest those imbalances are getting removed.”

Here’s a snapshot of the labor market leading up to the November jobs report:

Mixed October Report

The October jobs report suggested differing degrees of labor market cooling. The Bureau of Labor Statistics monthly employment report is made up of two surveys — one of households and the other of businesses. Most of the time, they point in the same direction but that wasn’t the case in October.

Payrolls rose a stronger-than-expected 261,000 in the month after an upwardly revised September gain. And while that was the smallest advance since December 2020, the establishment figures indicated robust labor demand.

The survey of households, however, pointed to more joblessness. The number of employed Americans sank by 328,000 as the unemployment rate climbed to 3.7%.

While the projected gain in November employment represents a further moderation, it’s nonetheless historically strong. That said, data out Thursday from LinkedIn showed that hiring fell by 4.9% in November and was down 20.5% from a year earlier. Hiring is now also 11.8% below February 2020 levels.

Job Openings

Job openings fell in October, reversing a surprise jump in the prior month, according to data out Wednesday. While the figures suggest labor demand is moderating, vacancies still remain well above longer-run levels.

Fed Chair Jerome Powell said at an event Wednesday that while the drop in openings is a “positive thing,” the “jobs-workers gap is about four million.” He noted that the job market is only showing “tentative signs” of getting back into balance.

There were 1.7 job openings for every unemployed worker, a historically elevated figure, but matching the lowest ratio in year.

Still, data from LinkedIn suggest that figure may be overstating the tightness of the labor market. The company’s ratio of active job openings to active applicants, which takes into account the recruiting intensity by firms with vacancies, was 0.9 in September and October.

Layoffs

A slew of companies across industries such as technology, finance and real estate have announced thousands of layoffs in recent months, and the high-profile job cuts from companies like Amazon.com Inc. and Redfin Corp. have prompted many to worry about the health of the labor market.

According to a report by Challenger, Gray & Christmas Inc., employers announced 76,835 cuts in November — more than double the October number.

The latest JOLTS data, which are for October, showed layoffs rose only modestly in the month. That said, the layoff rate for the information sector, where many tech jobs are concentrated, did increase.

Applications for unemployment benefits have begun to creep up as well. The four-week moving average, which helps to smooth out week-to-week volatility, has steadily increased since the end of September. For continuing claims, which are filings by those who have already filed an initial application, the average stands at an eight-month high.

Consumer Surveys

Consumer surveys also paint differing pictures. The Conference Board’s November survey showed nearly 46% of Americans said jobs were “plentiful.” That’s lower than the share seen earlier this year when job openings were at record highs, but still a historically strong level and up from a month earlier.

Yet, looking ahead, that same survey showed a greater share of Americans expect fewer jobs in the next six months. Meanwhile, unemployment expectations sank to the worst level since 2011 in a University of Michigan survey of consumers.

Even so, four in 10 respondents saw zero probability of losing their job over the next five years. Another 31% said the likelihood was less than 25%.

Wages

Wages have generally pointed to a labor market that is moderating but remains extremely tight.

Average hourly earnings, while trending lower, remain elevated, with economists expecting a 4.6% year-over-year rise in November. Powell said that wage gains are running 1.5% to 2% above what would typically be consistent with the central bank’s inflation goals.

Private sector wage growth increased 5.2% in the 12 months through September, a step down from the 5.7% seen in the prior quarter but among the highest readings on record, according to the government’s employment cost index data.

The Federal Reserve Bank of Atlanta’s wage growth tracker has eased slightly from the record 6.7% seen over the summer, but remains extremely elevated at 6.4%.

“There are signs of moderation,” said Nick Bunker, head of economic research at Indeed Hiring Lab. “But there’s still lots of underlying resilience and strength in the labor market.”