UK CPI inflation leaps to 3% YoY in January vs. 2.8% forecast

UK CPI inflation leaps to 3% YoY in January vs. 2.8% forecast

The United Kingdom (UK) Consumer Price Index (CPI) rose at an annual pace of 3% in January after December’s 2.5% increase, the data released by the Office for National Statistics (ONS) showed Wednesday.

The market consensus was for a 2.8% growth in the reported period. The print remained well above the Bank of England’s (BoE) 2% target.

The core CPI (excluding volatile food and energy items) advanced 3.7% year-over-year (YoY) in the same period, compared to a 3.2% rise in December while aligning with the market expectations.

Services inflation climbed to 5% YoY in January versus 4.4% in December.

Meanwhile, the monthly UK CPI inflation fell to -0.1% in January from +0.3% in December. Markets estimated a -0.3% reading.

GBP/USD reaction to the UK CPI inflation data

The UK CPI data fails to move the needle around the Pound Sterling, keeping GBP/USD modestly flat above the 1.2600 level, as of writing.

The high-impact Consumer Price Index (CPI) data from the United Kingdom (UK) for January will be published by the Office for National Statistics (ONS) on Wednesday at 07:00 GMT.

The Pound Sterling (GBP) could witness a big reaction to the UK CPI inflation report, which will likely have a strong bearing on the Bank of England’s (BoE) interest rate-cut path amid upside risks to inflation.

What to expect from the next UK inflation report?

The UK Consumer Price Index is expected to rise at an annual rate of 2.8% in January after increasing by 2.5% in December.

The reading is set to move further away from the BoE’s 2.0% target.

Core CPI inflation, which excludes energy, food, alcohol and tobacco prices, is forecast to climb to 3.7% YoY in January from December’s 3.2%.

According to a Bloomberg survey of economists, official data is expected to show that service inflation jumped to 5.2% in January after falling to 4.4% in December.

Meanwhile, the British monthly CPI is seen declining 0.3% in the same period, as against the previous growth of 0.3%.

Previewing the UK inflation data, TD Securities analysts noted: “Inflation is set to rebound sharply after December airfares were surveyed early in the month and missed the usual seasonal bump. The Monetary Policy Committee (MPC) expects this too, and is looking for core inflation of 3.9% year-on-year (YoY), having set the bar quite high for upside inflation surprises in the next few months. Still, it’ll make for uncomfortable reading even if some of the drivers are temporary.”

How will the UK Consumer Price Index report affect GBP/USD?

At its monetary policy meeting earlier this month, the BoE lowered the benchmark policy rate by 25 basis points (bps) to 4.5% after the UK annual headline and services inflation unexpectedly cooled in December.

However, BoE Governor Andrew Bailey maintained a cautious stance on future rate cuts, noting that “we must judge in future meetings whether underlying inflation pressures are easing enough to allow further cuts.”

“We must proceed carefully,” he added.

Therefore, the January UK CPI data will be closely scrutinized for fresh hints on the BoE’s easing trajectory.

A hotter-than-expected headline and core inflation data will strengthen the expectations of the BoE’s prudent approach to policy easing, providing a fresh boost to the Pound Sterling uptrend. In this case, GBP/USD could target the 1.2700 round figure. On the other hand, a downside surprise in the inflation readings could rekindle bets for aggressive BoE rate cuts, fuelling a GBP/USD correction from over two-month highs.

Dhwani Mehta, Asian Session Lead Analyst at FXStreet, offers a brief technical outlook for the major and explains: “GBP/USD is challenging the key resistance near 1.2605 heading into the UK CPI data release, with the 14-day Relative Strength Index (RSI) momentum indicator in the daily chart holding firm above 50. The 21-day Simple Moving Average (SMA) is on the verge of crossing the 50-day SMA from below, which, if it occurs on a daily closing basis, will confirm a Bull Cross. These technical indicators point to a sustained uptrend for the pair.”

Mehta adds: “However, the pair needs acceptance above the 100-day SMA at 1.2665 to initiate a meaningful upside toward the 200-day SMA at 1.2788. Ahead of that level, the 1.2700 round level must be recovered. On the flip side, the immediate support is seen at the 21-day SMA and the 50-day SMA confluence at around 1.2460. Should the selling pressure intensify, the rising trendline support drawn from the January 13 low at 1.2357 will come to the buyers’ rescue.

gold-bar-and-dollar-bills-42586628_XtraLarge

Gold price consolidates near all-time peak; looks to FOMC minutes for fresh impetus

Gold price (XAU/USD) extended its consolidative price move through the first half of the European session on Wednesday and remains close to the all-time peak touched last week. Traders now seem reluctant and opt to wait for the release of the FOMC meeting minutes, which might provide cues about the Federal Reserve’s (Fed) rate-cut path. This, in turn, will play a key role in influencing the near-term US Dollar (USD) price dynamics and provide some meaningful impetus to the non-yielding yellow metal.

In the meantime, bets that the US central bank will cut interest rates further keep the USD bulls on the defensive. Apart from this, worries that US President Donald Trump’s tariff plans could trigger a global trade war continue to act as a tailwind for the safe-haven Gold price. Moreover, the lack of any meaningful selling interest suggests that the path of least resistance for the XAU/USD is to the upside. Hence, any corrective pullback might still be seen as a buying opportunity and is more likely to remain cushioned.

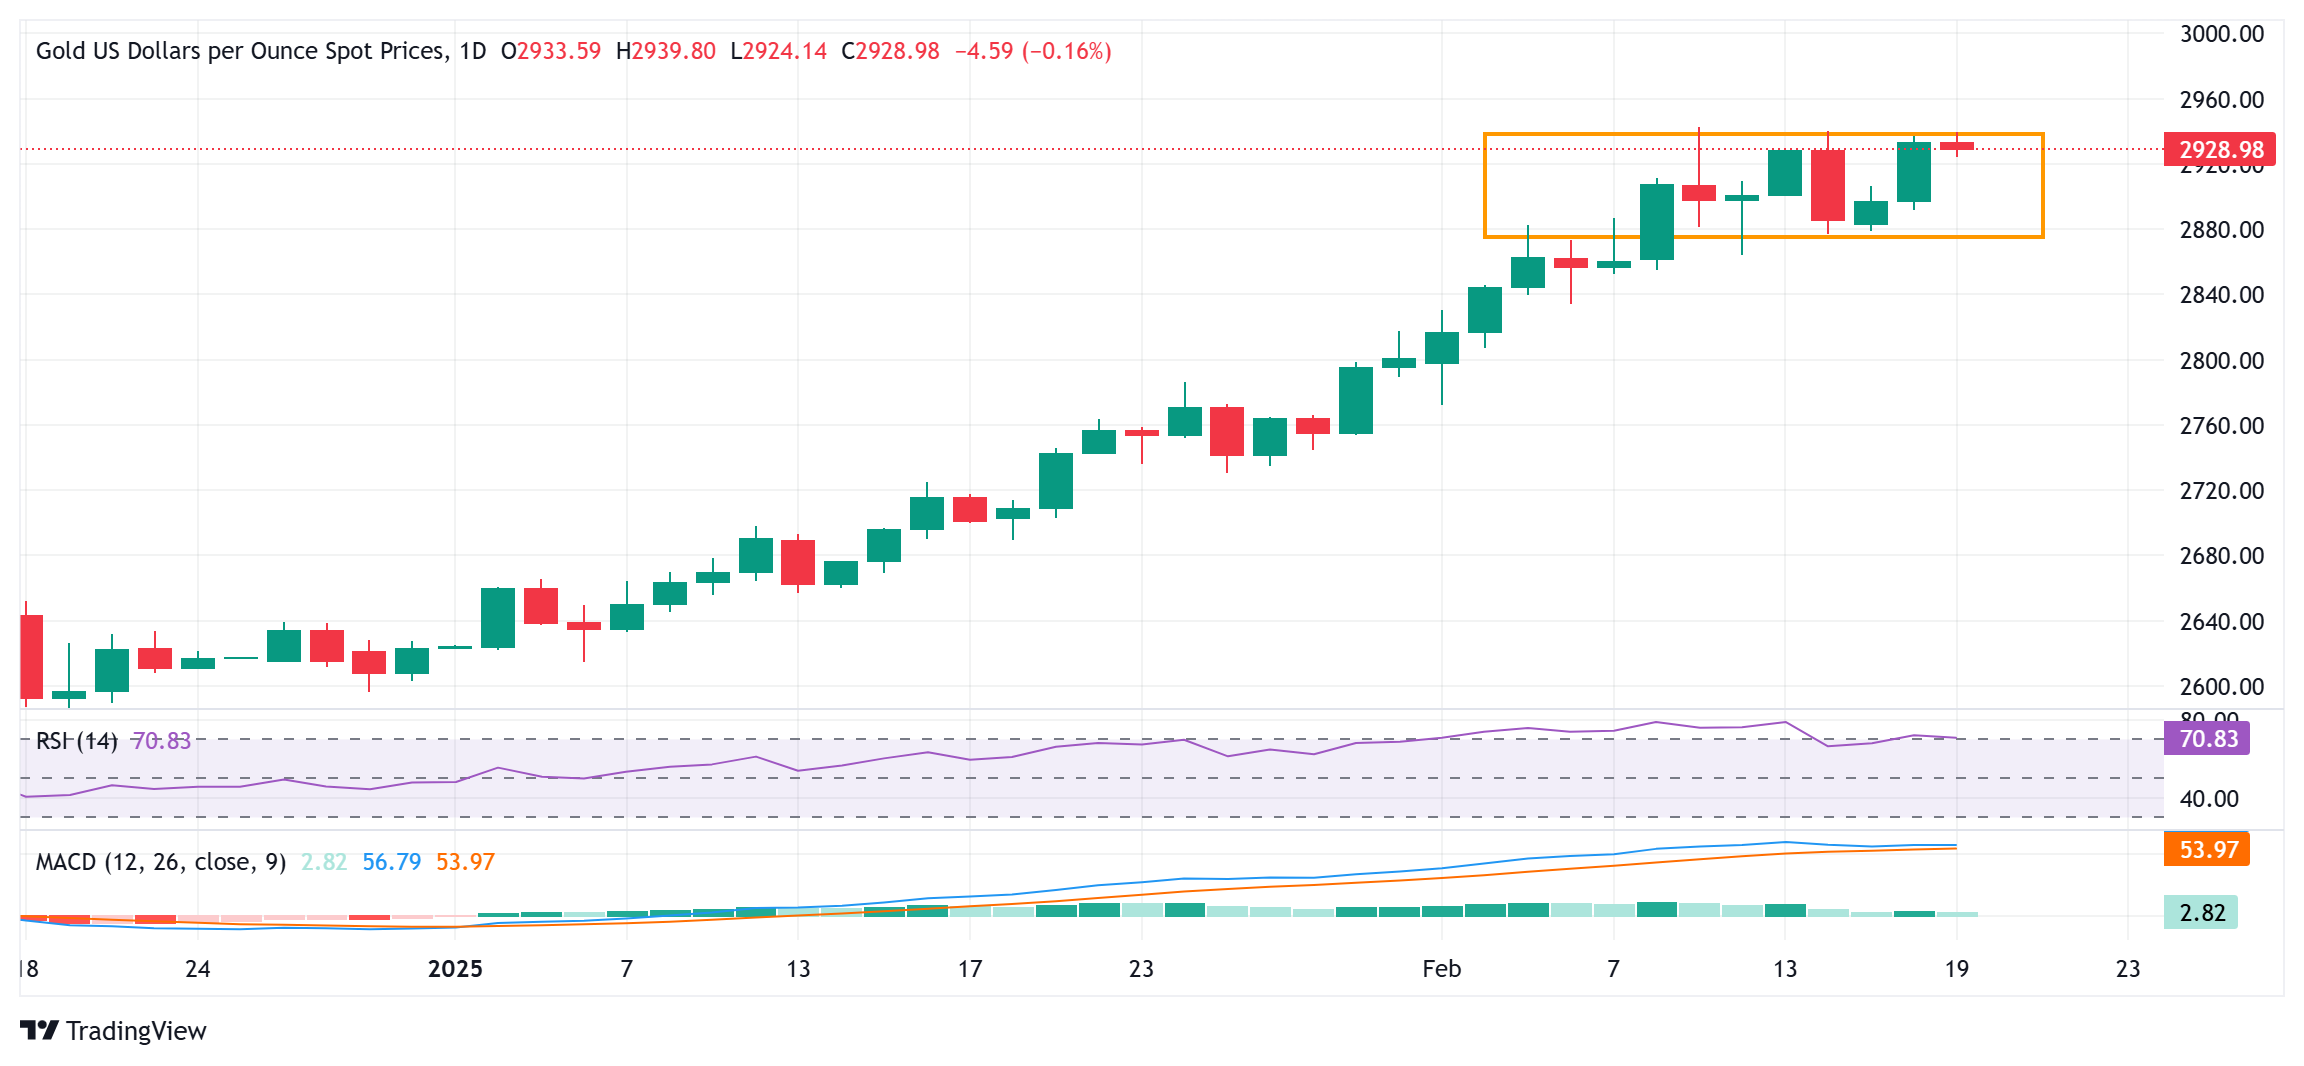
Gold price technical setup remains tilted firmly in favor of bullish traders

fxsoriginal

From a technical perspective, the range-bound price action might still be categorized as a bullish consolidation phase against the backdrop of the recent strong move up to the all-time peak. That said, the daily Relative Strength Index (RSI) remains close to the overbought territory and supports prospects for an extension of the consolidative price move. Nevertheless, the setup remains tilted in favor of bulls and suggests that the path of least resistance for the XAU/USD remains to the upside.

Meanwhile, weakness below the $2,925 area is likely to find some support near the $2,900 mark ahead of the $2,878-2,876 zone or the lower boundary of the short-term trading range. A convincing break below the latter could drag the Gold price to the $2,860-2,855 area en route to the $2,834 region. Failure to defend the said support levels might prompt some technical selling and drag the XAU/USD towards the $2,815 region en route to the $2,800 mark and the $2,785-2,784 area.

On the flip side, the $2,940-2,942 region, or the record high touched earlier this month, might continue to act as an immediate strong barrier. Some follow-through buying will be seen as a fresh trigger for bullish traders and set the stage for an extension of a well-established uptrend witnessed over the past two months or so.

GBP/USD holds above 1.2600 after strong UK inflation data

GBP/USD holds above 1.2600 after strong UK inflation data

GBP/USD holds steady above 1.2600 in the European morning on Wednesday after the data from the UK showed that the annual CPI inflation climbed to 3% in January from 2.5% in December. Market focus shifts to mid-tier US data and FOMC Minutes.

The Relative Strength Index (RSI) indicator on the 4-hour chart holds above 60 and GBP/USD continues to trade above the 20-period Simple Moving Average, reflecting sellers’ hesitancy.

In case GBP/USD continues to use 1.2600 (round level) as support, it could face the next resistance at 1.2650 (Fibonacci 78.6% retracement of the latest downtrend) before 1.2700-1.2710 (round level, static level). On the downside, supports could be seen at 1.2530 (Fibonacci 61.8% retracement), 1.2500 (round level, static level) and 1.2460-1.2450 (100-period Simple Moving Average, Fibonacci 50% retracement).

The UK’s Office for National Statistics (ONS) reported early Tuesday that the ILO Unemployment Rate held steady at 4.4% in the three months to December. This reading came in better than the market forecast of 4.5%. Additionally, the Employment Change rose by 107,000 in this period, up sharply from 35,000 reported for the previous month. Finally, the annual wage inflation, as measured by the change in the Average Earnings Including Bonus, climbed to 6% from 5.6%. These figures seem to be helping Pound Sterling stay resilient against the US Dollar (USD).

In the meantime, while participating in a panel discussion titled “Preserving and enhancing open financial markets” at an event in Brussels on Tuesday, Bank of England (BoE) Governor Andrew Bailey acknowledged that they are in a period of heightened uncertainty and added that they are facing a weak growth environment in the UK.

The economic calendar will not feature any high-impact data releases on Tuesday. In case risk flows dominate the action in the financial markets in the second half of the day, GBP/USD could regain its traction. At the time of press, US stock index futures were up between 0.1% and 0.3%.

Bitcoin Price Forecast: BTC stalemate soon coming to an end

Bitcoin Price Forecast: BTC stalemate soon coming to an end

Bitcoin (BTC) price has been consolidating between $94,000 and $100,000 for almost two weeks. Amid this consolidation, investor sentiment remains indecisive, with US spot Exchange Traded Funds (ETFs) recording a $580.2 million net outflow last week, signaling institutional demand weakness. At the same time, CryptoQuant data suggests continued accumulation through the 30DMA exchange inflow/outflow ratio.

Bitcoin price consolidates while institutional demand weakens

The Glassnode report last week states, “Bitcoin price has been wildly volatile and ultimately flat over the last few weeks. It has traded up to a high of $105,000, down to a low of $93,000, and ended the week where it started.”

The report further explains that this unstable price action resulted in a substantial loss of $520 million (the largest local capitulation event) when priced in USD. However, when assessing the severity of the drawdown through a normalized measure, the sell-off remains broadly in line with other local corrections.

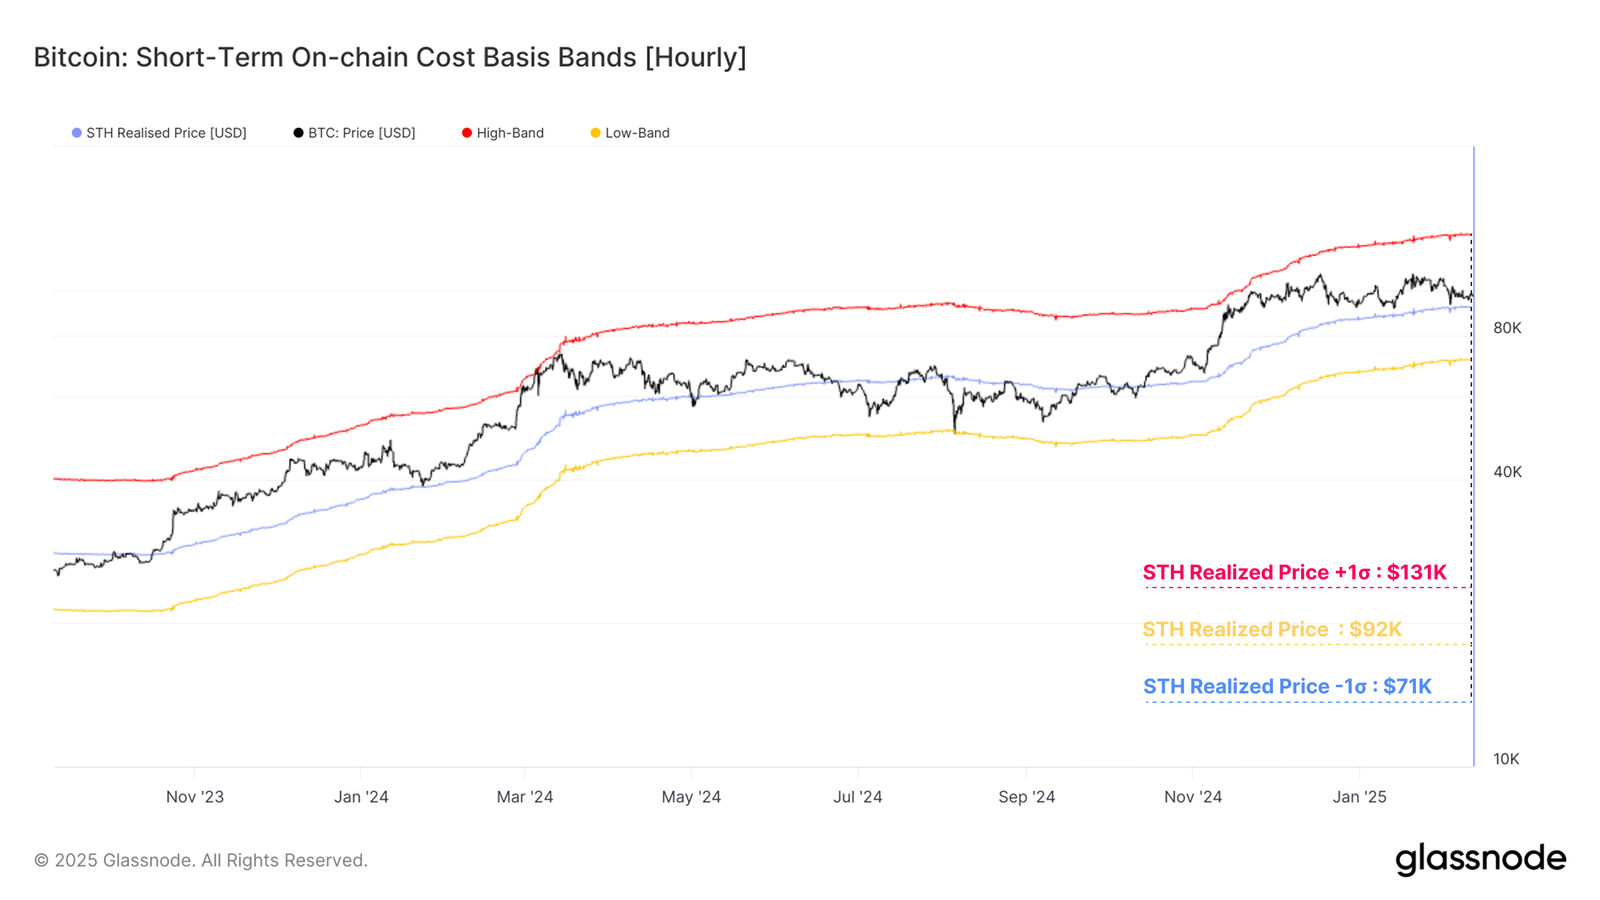
Looking down on the average Short-Term Holder cost basis chart below, the report highlights that it has historically acted as a strong support level during a bull market uptrend. This pricing model currently trades at around $92,200 and is a key region to hold for the market to avoid further downside.

Bitcoin: Short-term on-chain cost basis bands (Hourly) chart. Source: Glassnode

In an exclusive interview with Hyblock, analysts told FXStreet, “Bitcoin remains in a consolidation phase, with two key trading zones to watch: $99,600 – $99,900 (upside) and $95,600 – $95,900 (downside). A move toward $94,00 could create a strong buy opportunity if confluence signals align, while resistance remains at $108,000.”

Diving down into Bitcoin’s institutional demand, it shows signs of weakness. According to Coinglass, Bitcoin spot ETF data recorded net outflows of $580.2 million last week compared to $203.8 million inflows in the previous one. If the magnitude of the outflow continues and intensifies, the Bitcoin price could see further corrections.

Total Bitcoin spot ETF net inflow chart. Source: Coinglass

Some optimistic signs for Bitcoin 

CryptoQuant data shows that despite Bitcoin trading within a broad range between $90,000 and $105,000, there is clear evidence of continued accumulation, as indicated by the 30DMA exchange inflow/outflow ratio.

The chart below shows that the ratio currently reads 0.98, dropping below 1. It suggests that outflows dominate inflows, which many professional investors view as bullish. Generally, the lower the ratio, the stronger the underlying demand appears.

Bitcoin Exchange Inflow/Outflow ratio 30DMA chart. Source: CryptoQuant

Other optimistic signs for Bitcoin include US President Trump’s nomination of Brian Quintenz last week to be the next Chairman of the Commodity Futures Trading Commission (CFTC). Quintenz expressed his gratitude for the nomination on X. Known for his pro-crypto stance, he added that “…the agency is also well poised to ensure the USA leads the world in blockchain technology and innovation.”

Bitcoin Price Forecast: Two weeks of price consolidation

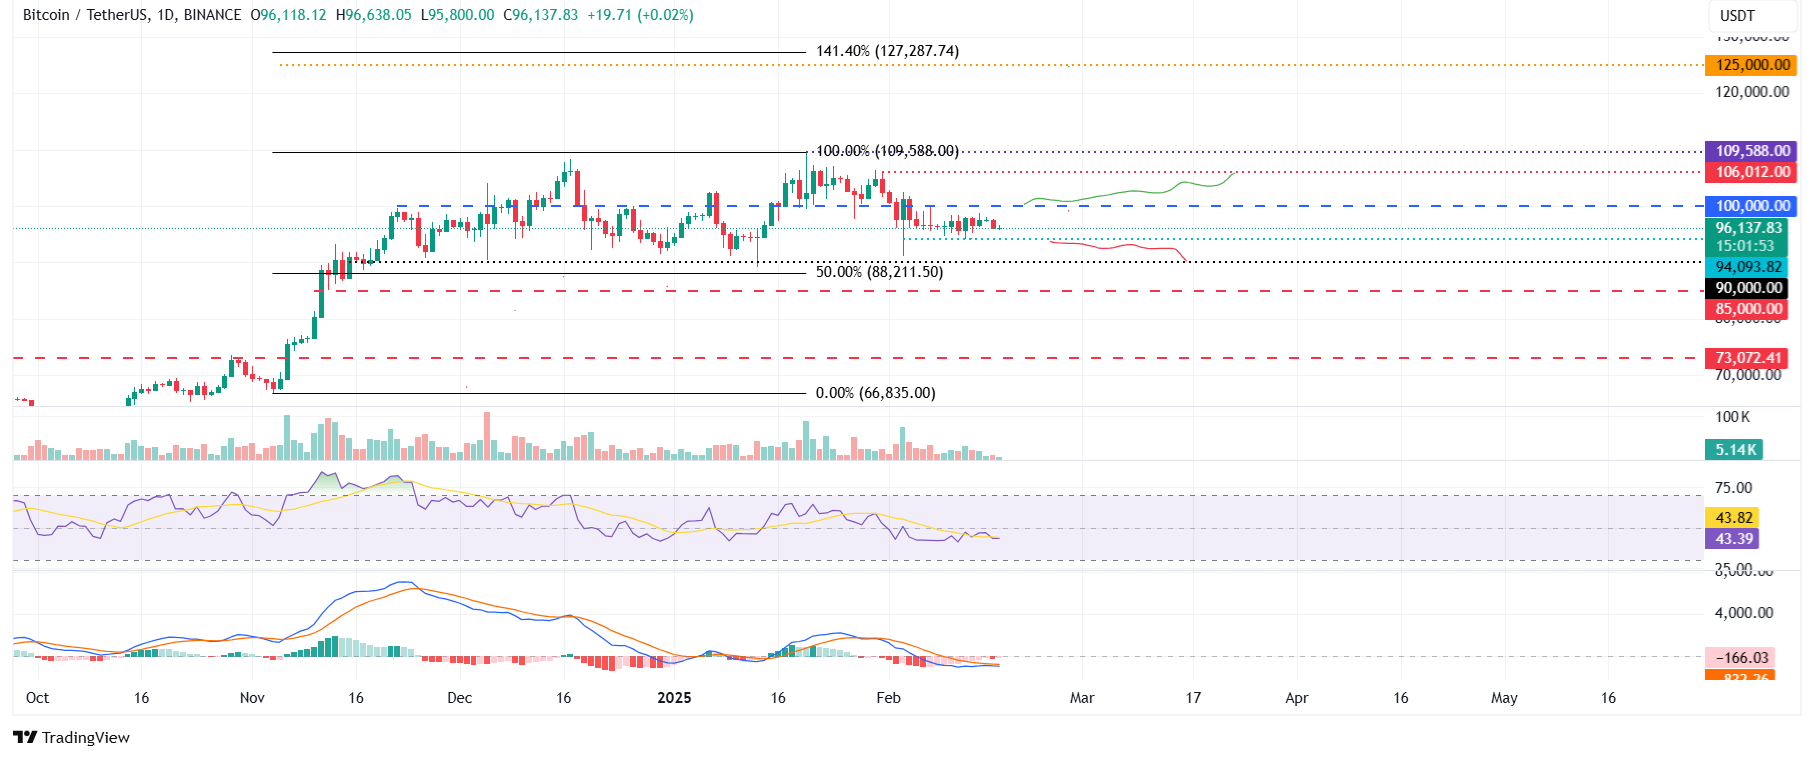
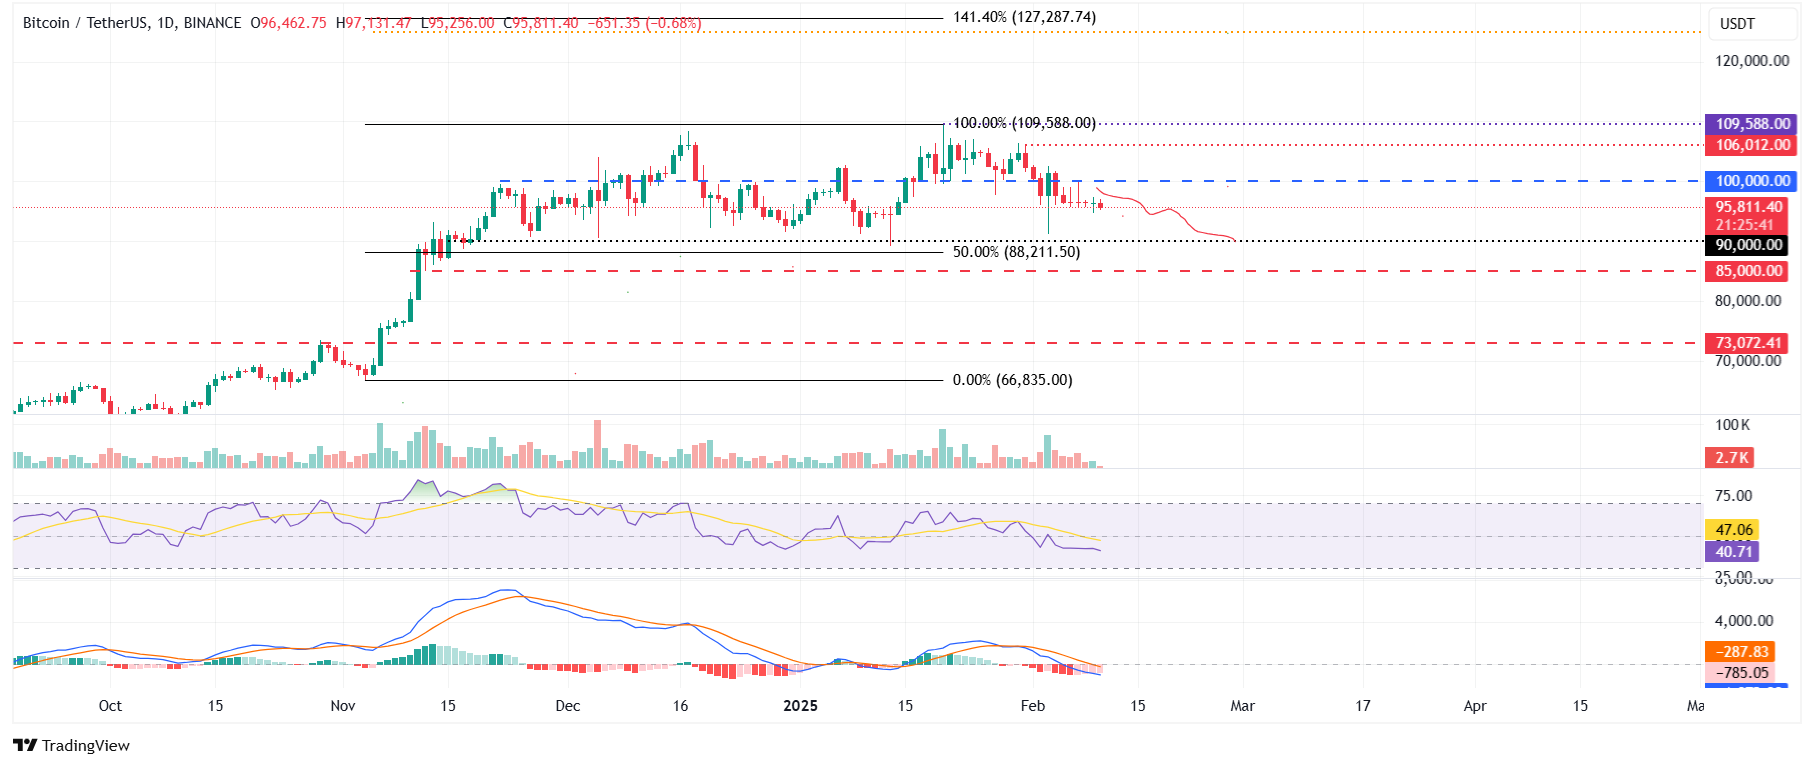
Bitcoin price broke below the $100,000 support level on February 4 and has been consolidating between $94,000 and $100,000 since then. At the time of writing on Monday, BTC hovers around $96,100.

If BTC breaks and closes below the lower boundary of the consolidating range of $94,000, it could extend the decline to test its psychologically important level of $90,000.

The Relative Strength Index (RSI) on the daily chart reads 43, consolidating after being rejected at its neutral level of 50 last week and indicating slightly bearish momentum. Moreover, the Moving Average Convergence Divergence (MACD) showed a bearish crossover and red histogram bars, hinting at further correction.

BTC/USDT daily chart

However, if BTC recovers and breaks above the upper boundary of the consolidating range of $100,000, it would extend the recovery to retest its January 31 high of $106,012.

WTI trades cautiously above $70 as investors await Russia-Ukraine peace talks

WTI trades cautiously above $70 as investors await Russia-Ukraine peace talks

West Texas Intermediate (WTI), futures on NYMEX, trades with caution above the seven-week low of $70.15 in Monday’s European session. The Oil price trades cautiously as investors seek more development in the Russia-Ukraine peace talks.

Last week, United States (US) President Donald Trump confirmed that both leaders of Russia and Ukraine have agreed to peace negotiations.

Donald Trump said that he had a “lengthy and highly productive” conversation with Russian leader Vladimir Putin, and he agreed to start peace negotiations with Ukraine. Also, he ordered his team to begin peace talks.

Over the weekend, Trump also said that he is expected to discuss ending the three-year-long war in Ukraine in the coming days.

Analysts at Philip Nova expect, “If negotiations lead to a resolution, more Russian barrels would enter global supplies, which could significantly impact oil prices negatively.”

Meanwhile, reports that OPEC is planning to delay its planned monthly supply increases, which were expected to begin in April, have offered a temporary relief to the Oil price, Bloomberg reported.

The decision is contrary to President Donald Trump’s urge to Saudi Arabia to increase Oil output by two million barrels last month.

Pound Sterling steadies ahead of UK labor market and inflation data

Pound Sterling steadies ahead of UK labor market and inflation data

The Pound Sterling (GBP) trades steady against its major peers at the start of the week as investors turn cautious ahead of the United Kingdom (UK) employment data for three months ending December, which will be released on Tuesday.

Investors will pay close attention to the UK labor market data to know whether business owners are still upset with Chancellor of the Exchequer Rachel Reeves’s announcement of raising employers’ contribution to National Insurance (NI). In the Autumn Budget, Reeves increased employers’ social security contributions by 1.2% to 15%, which will come into effect from April.

Since the announcement, the private sector’s hiring pace has sharply slowed, indicating dissatisfaction among business owners. In the three months ending November, the economy added 35K workers, significantly lower than the 173K addition seen in the August-October period.

Also, Bank of England (BoE) Governor Andrew Bailey said in an interview with BusinessLive in European trading hours that he sees some softness in the labor market and is confident that the disinflation trend is still on. Bailey said, “the economic context is not really supporting the view that we will get more persistence in inflation.”

The UK Office for National Statistics (ONS) is expected to show that the ILO Unemployment Rate accelerated to 4.5% in December from the former reading of 4.4%.

Market participants will also focus on the UK Average Earnings data, which is a key measure of wage growth that has been a major contributor to high inflation in the service sector. Average Earnings (Including and Excluding bonuses) are expected to accelerate at a robust pace to 5.9% compared to the prior release of 5.6%. Hot wage growth measures would boost fears of price pressures remaining stubborn. In February’s monetary policy statement, the BoE stated that inflationary pressures could accelerate before resuming its journey to the 2% target due to higher energy prices.

Therefore, soft employment conditions and high inflation expectations due to strong wage growth could stem the risks of stagflation.

Later this week, investors will also focus on the UK Consumer Price Index (CPI) and Retail Sales data for January, which will be released on Wednesday and Friday, respectively.

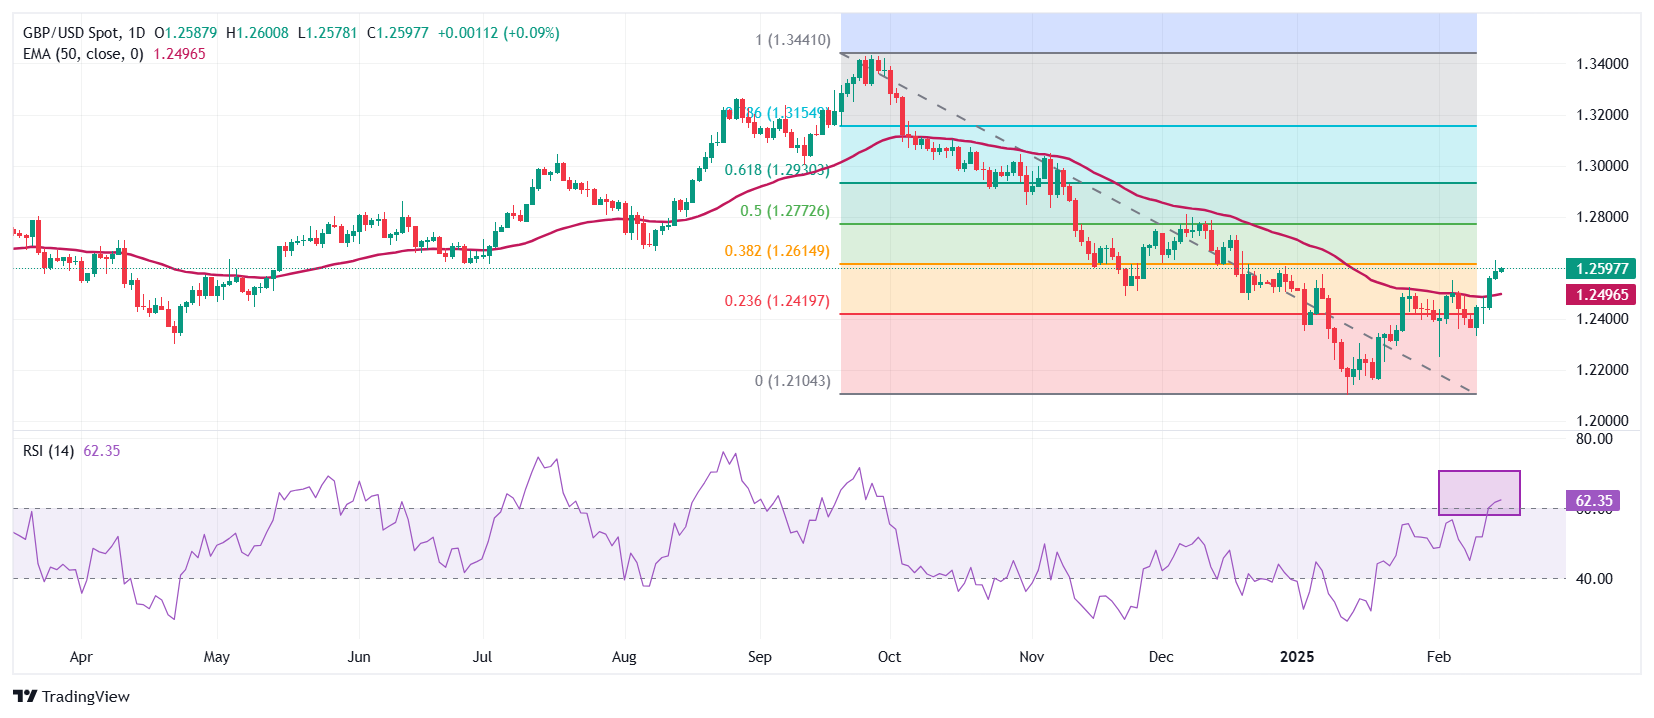
Technical Analysis: Pound Sterling strives to break above key level of 1.2620

The Pound Sterling trades inside Friday’s trading range but aims to break decisively above the 38.2% Fibonacci retracement around 1.2620. The near-term outlook of the GBP/USD pair has turned bullish as it holds above the 50-day Exponential Moving Average (EMA), which stands at around 1.2500.

The 14-day Relative Strength Index (RSI) advances above 60.00. A bullish momentum would activate if the RSI (14) sustains above that level.

Looking down, the February 3 low of 1.2250 will act as a key support zone for the pair. On the upside, the 50% Fibonacci retracement at 1.2767 will act as a key resistance zone.

EUR/USD stays defensive below 1.0500 amid light trading

EUR/USD stays defensive below 1.0500 amid light trading

EUR/USD struggles to capitalize on recent upside and oscillates in a narrow range below 1.0500 in European trading on Monday. However, the pair’s downside remains cushioned by persistent US Dollar weakness and an upbeat mood. Focus shifts to central bank talks.

The Relative Strength Index (RSI) indicator on the 4-hour chart declines from the 80 mark it touched on Friday but holds above 60, suggesting that EUR/USD remains bullish after correcting from overbought levels.

On the downside, 1.0440 (Fibonacci 61.8% retracement of the latest downtrend) aligns as first support before 1.0400 (100-period Simple Moving Average (SMA), Fibonacci 50% retracement) and 1.0360 (200-period SMA).

Looking north, first resistance could be spotted at 1.0500-1.0510 (round level, Fibonacci 78.6% retracement) ahead of 1.0550 (static level) and 1.0600 (static level, beginning point of the downtrend).

EUR/USD trades in a relatively tight channel below 1.0500 to begin the new week. Financial markets in the US will remain closed in observance of the Presidents’ Day holiday on Monday, limiting the volatility in the second half of the day.

The persistent selling pressure surrounding the US Dollar helped EUR/USD post strong gains in the previous week. Easing fears over an aggressive trade policy by US President Donald Trump helped the market mood improve and weighed on the USD. Ahead of the weekend, the data from the US showed that Retail Sales in the US declined by 0.9% on a monthly basis in January, not allowing the USD to stage a rebound.

The economic calendar will not feature any high-tier data releases in the first half of the week. On Wednesday, the Federal Reserve (Fed) will publish the minutes of its January policy meeting.

In the meantime, market participants will pay close attention to developments surrounding the Trump administration’s trade policy with the EU.

European Trade Commissioner Maros Sefcovic will travel to Washington on Monday to meet with US counterparts to discuss US tariffs.

Bitcoin Price Forecast: BTC stalemate soon coming to an end

Cryptocurrencies Price Prediction: Dogecoin, Bitcoin & Ripple – Asian Wrap 10 February

Dogecoin Price Forecast: DOGE whale transactions fell by more than 70%; bearish move ahead

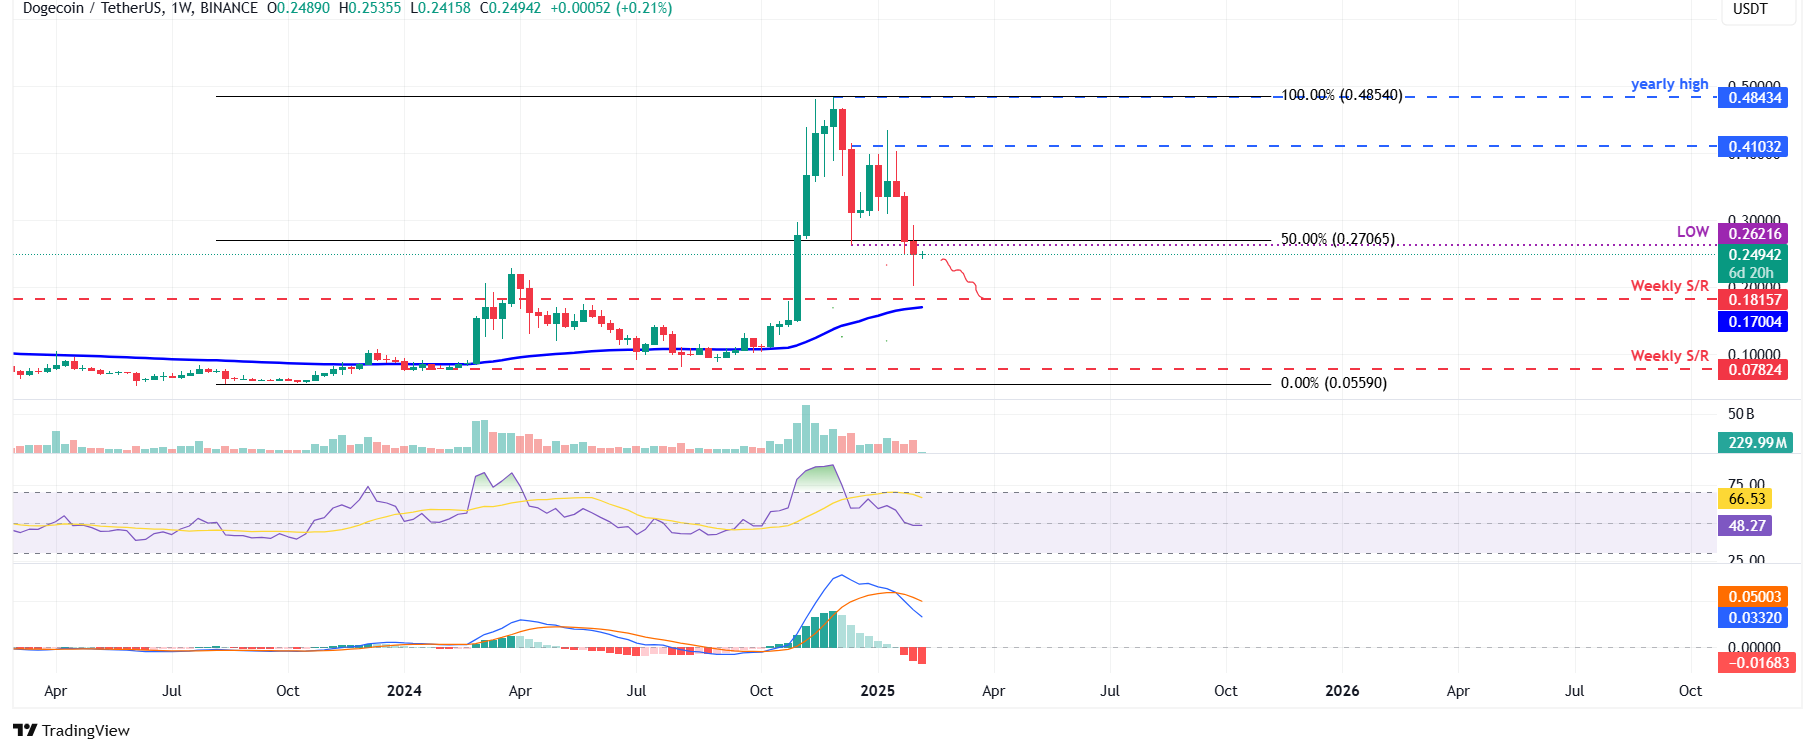
Dogecoin (DOGE) continues to trade down around $0.24 after falling more than 7% in the previous week. The technical outlook suggests a further correction as DOGE’s momentum indicators reflect bearish divergences. Santiment data show that DOGE whale transactions are falling, indicating signs of weakness.

Top 3 Price Prediction Bitcoin, Ethereum, Ripple: BTC, ETH and XRP are headed for further drops

Bitcoin’s (BTC) price continues to edge down, trading below $96,000 on Monday after declining the previous week. Ethereum (ETH) and Ripple (XRP) prices followed BTC’s footsteps, declined more than 7% the previous week, and traded below their key support level, hinting at further correction.

XRP sees gains ahead of Depository Receipts launch, Brad Garlinghouse set to join White House crypto council

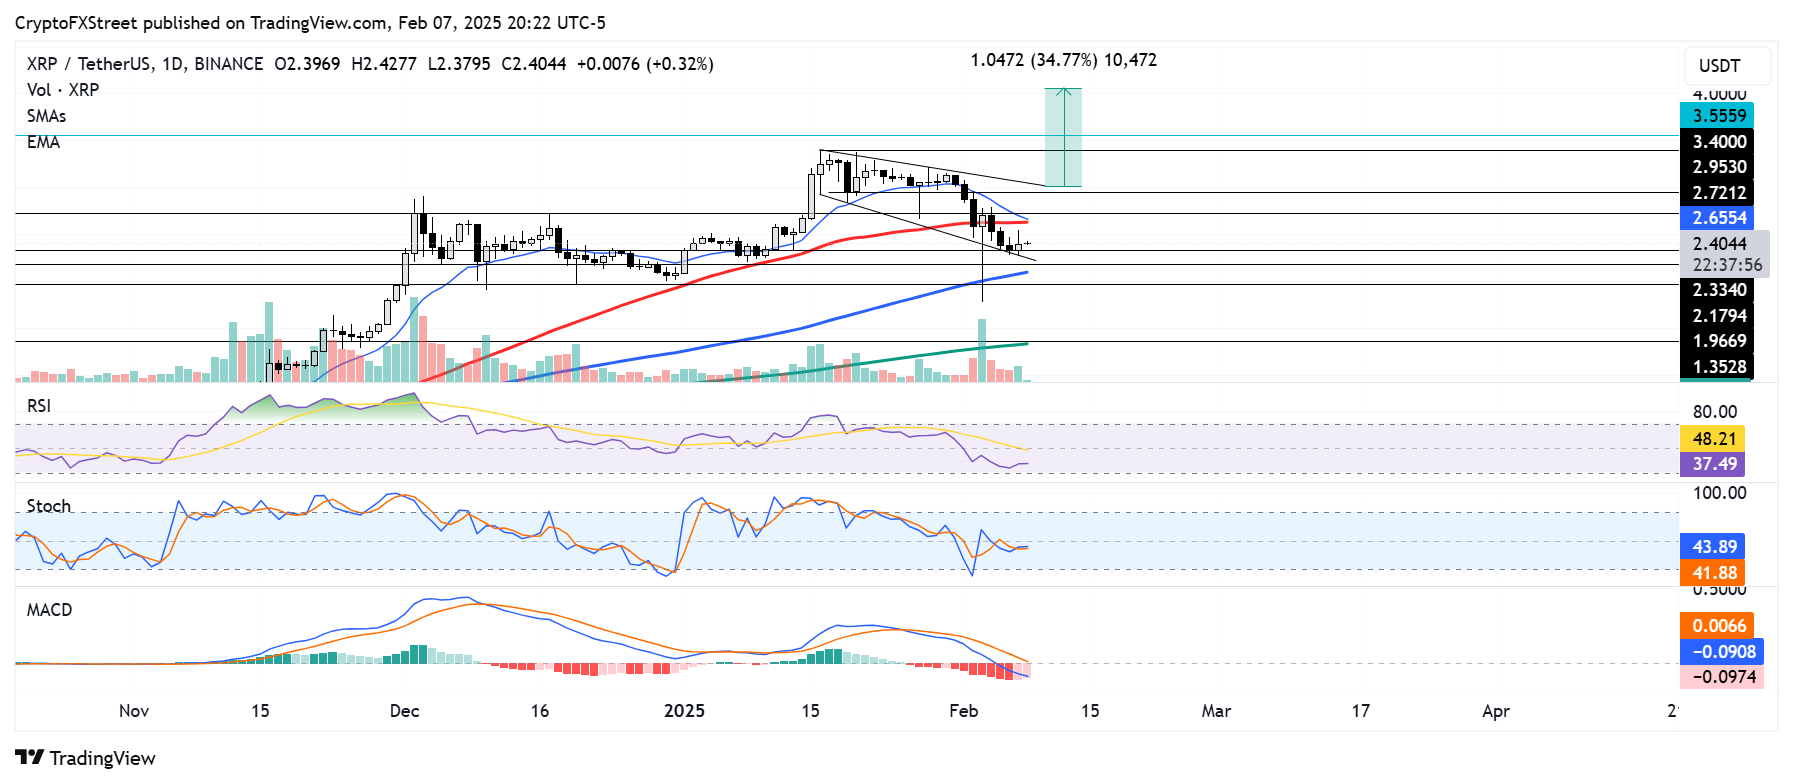
Ripple’s XRP gained 4% on Friday following reports that investment firms Receipts Depository Corp and Digital Wealth Partners plan to launch XRP Depository Receipts in the United States. The receipts will offer investors exposure to XRP’s price, similar to exchange-traded funds (ETFs).

gold-bar-and-dollar-bills-42586628_XtraLarge

Gold rally continues, USD holds ground as markets assess Trump tariff talks

The US Dollar stays resilient against its major rivals on Monday as markets assess the latest headlines surrounding US President Donald Trump’s tariff policy. The economic calendar will not feature any high-impact data releases. Later in the day, European Central Bank (ECB) President Christine Lagarde will deliver the Annual Report at the European Parliament.

Following the mixed labor market data, the USD Index closed modestly higher on Friday. Nonfarm Payrolls (NFP) in the US rose by 143,000 in January, missing the market expectation for an increase of 170,000. On a positive note, November’s increase of 256,000 got revised higher to 307,000 and the Unemployment Rate edged lower to 4.1% from 4% in December.

Meanwhile, President Trump said on Friday that he will announce “reciprocal tariffs” on many countries this Tuesday or Wednesday. Over the weekend, Trump also noted that he plans to impose 25% tariffs on all steel and aluminum imports into the US. The USD Index opened with a small bullish gap and was last seen trading marginally higher on the day, slightly above 108.20. Wall Street’s main indexes suffered large losses on Friday. Early Monday, US stock index futures rise between 0.1% and 0.4%. Federal Reserve (Fed) Chairman Jerome Powell will testify before the Senate Banking Committee on Tuesday and before the House Financial Services Committee on Wednesday.

Despite losing more than 0.5% on Friday, EUR/USD ended the previous week in positive territory. The pair holds steady above 1.0300 in the early European morning.

AUD/USD started the week under bearish pressure on Trump’s announcement of imposing new 25% tariffs on all steel and aluminum imports into the US and declined below 0.6250. In response, Australian Trade Minister Don Farrell said Monday that Australian steel and aluminum is creating “thousands of good-paying American jobs” adding that they are key for their shared defense interests. The pair regains its traction to begin the European session and trades flat on the day above 0.6270.

GBP/USD registered losses on Thursday and Friday but managed to post weekly gains. The pair holds its ground early Monday and fluctuates above 1.2400.

USD/JPY declined sharply and lost more than 2% in the previous week. The pair stages a rebound toward 152.00 early Monday. During a news conference with Japanese Prime Minister Shigeru Ishiba on Friday, Trump said that he intends to “work out” the US’ trade deficit with Japan, which currently sits around $65 billion per year.

Gold preserves its bullish momentum to begin the new week, after having gained more than 2% last week. XAU/USD was last seen trading at a new record-high near $2,890.

USDINR

USD/INR retreats from record high amid likely RBI intervention

The Indian Rupee (INR) recovers some ground on Monday after reachign a fresh all-time low in early trading. USD sales by state-run banks, though most likely on behalf of the Reserve Bank of India (RBI), might help limit the local currency’s losses.

On the other hand, sustained foreign portfolio investors (FPI) outflows, the concern about an economic slowdown in India, and the uncertainty of US President Donald Trump’s tariff policies contribute to the INR’s downside. In the absence of the top-tier economic data releases from the US and India on Monday, the USD/INR pair will be influenced by the USD.

USD/INR maintains a constructive view, overbought RSI warrants caution for bulls

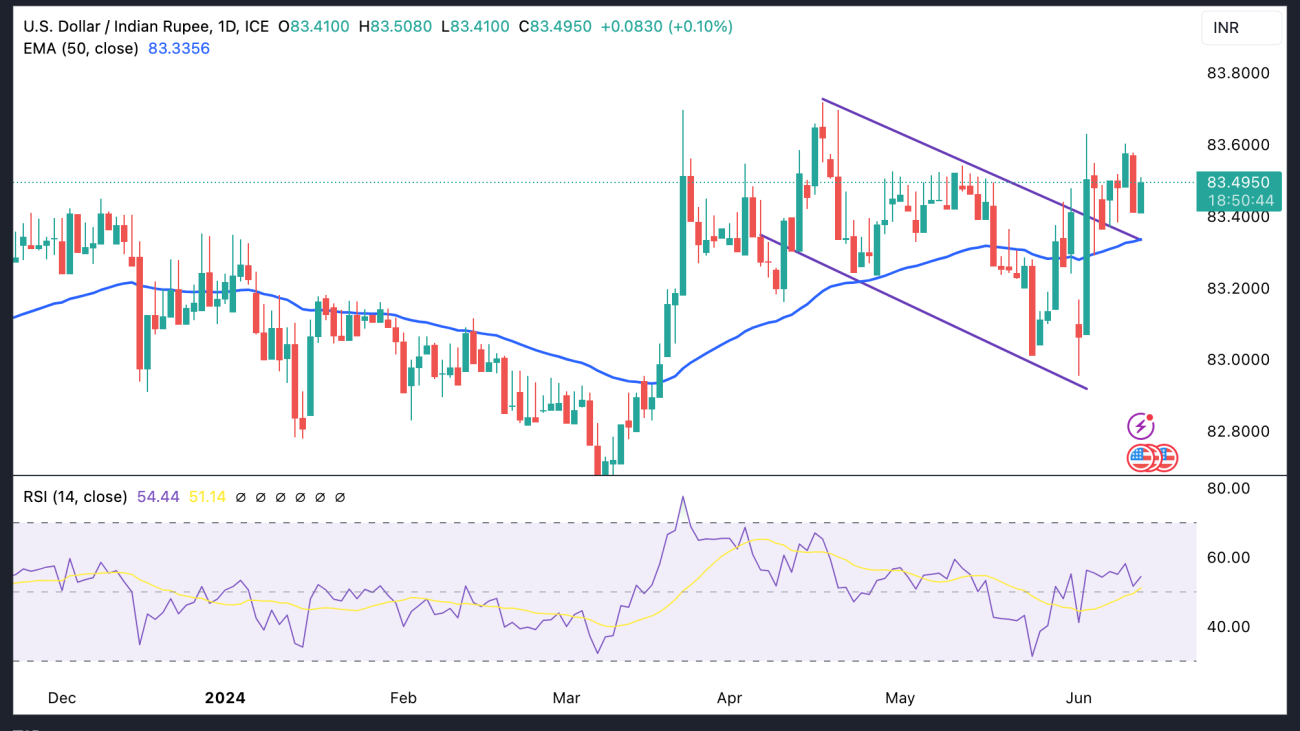
The Indian Rupee trades on a positive note on the day. The USD/INR pair paints a positive picture on the daily chart, characterized by the price holding above the key 100-day Exponential Moving Average (EMA).

Nonetheless, the overbought 14-day Relative Strength Index (RSI) beyond the 70.00 mark warrants caution for bullish traders, potentially signaling a temporary weakness or further consolidation in the near term.

An all-time high of 87.62 acts as an immediate resistance level for USD/INR. Bullish candlesticks and buying pressure above this level might attract bulls aiming for the 88.00 psychological level.

On the other hand, the first downside target to watch is the 87.05-87.00 regions, representing the low of February 5 and the round mark. Consistent trading below the mentioned level, the bears could take control and drag the pair down to 86.51, the low of February 3.