Asia Day Ahead: STI at Key Support, Natural Gas Touches Eight-Month High

Asia Day Ahead: STI at Key Support, Natural Gas Touches Eight-Month High

Market Recap

Slowing growth in the US services sector and a significantly lower-than-expected US private payroll data paved the way for some cooling in the US Treasury yields rally, which offered room for relief in Wall Street overnight.

The US Automatic Data Processing (ADP) payroll data totalled just 89,000 in September versus the 153,000 forecast, and while it may not necessarily go hand-in-hand with the official non-farm payroll data released Friday, rate expectations were quick to pare back on some hawkish bets. This also comes as the US services purchasing managers index (PMI) data softened to 53.6 from previous 54.5, while new orders registered its lowest level since December (51.8 vs 57.5 forecast).

The S&P 500 VIX has retraced off the 20 level for now, which marked a key level of resistance from its May 2023 high, although overall risk mood may likely stay cautious in the lead-up to the US non-farm payroll data to end the week. Much attention is on oil prices, with Brent crude seeing a 5.4% plunge overnight. Despite another week of higher-than-expected drawdown in US crude inventories, traders have their focus on the significant build in gasoline inventories (+6.5 million vs +0.2 million expected).

A decisive break below its 50-day moving average (MA) for Brent crude prices could leave sellers in control for now, while its daily Relative Strength Index (RSI) heads to its lowest level since May this year. The US$82.50 level may serve as a key level for buyers to defend next, where the lower edge of its Ichimoku cloud on the daily chart rests alongside its key 200-day MA. Having reclaimed its 200-day MA back in July this year for the first time in 11 months, the MA-line may be a key level of support to retain the broader upward trend.
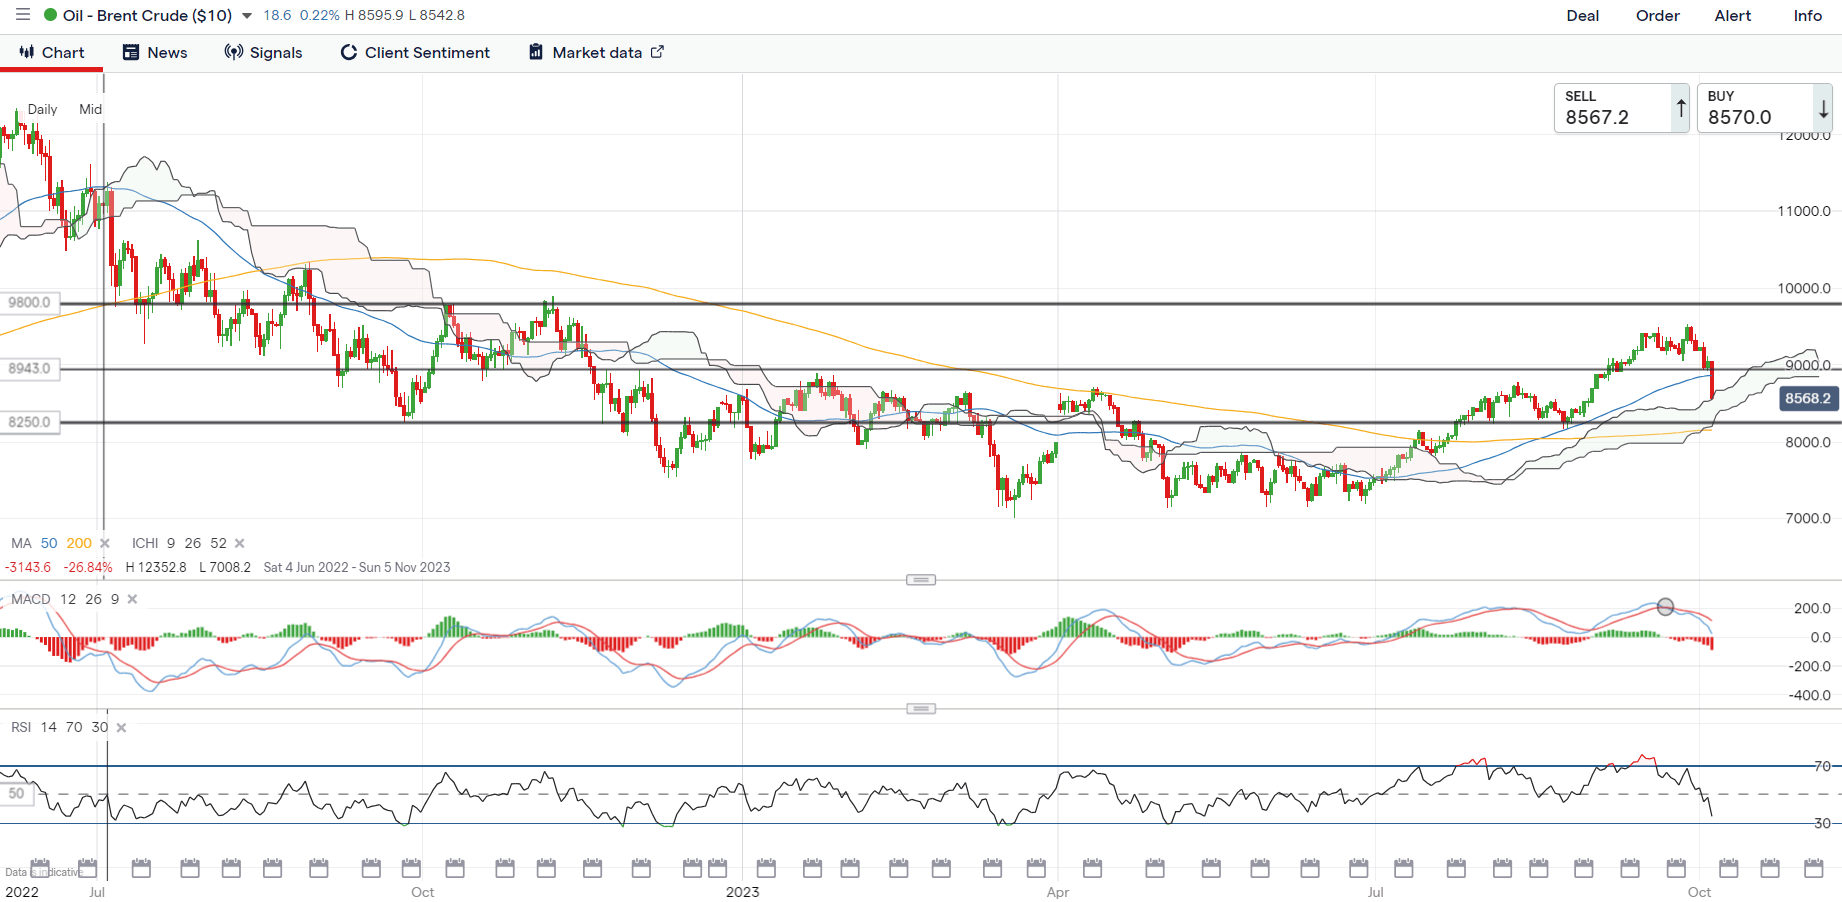
image1.png

Asia Open

Asian stocks look set for a positive open, with Nikkei +0.66%, ASX +0.09% and KOSPI +0.28% at the time of writing. Lower Treasury yields, a weaker US dollar and falling oil prices may allow risk sentiments in the region to stabilise from its recent sell-off, although there is still some caution around risk-taking being presented.

China markets remain closed for the rest of the week, while the Hang Seng Index touched a new low since November 2022 in yesterday’s session. Economic data this morning saw a higher-than-expected inflation read from South Korea (3.7% versus 3.4% forecast), with the second straight month of increase likely to keep the Bank of Korea on its hawkish pause at its 19 October meeting, leaving room for additional tightening but still on further wait-and-see for now.

Aside, the Straits Times Index may be on the radar, with the index back at the lower base of its long-ranging pattern, which may prompt some defending from buyers ahead at the 3,145 level. Greater conviction may still be needed from a move in the daily moving average convergence/divergence (MACD) back above the zero mark, alongside the daily RSI above the 50 level. A successful defend of the 3,145 level may leave the 3,230 level on watch next.
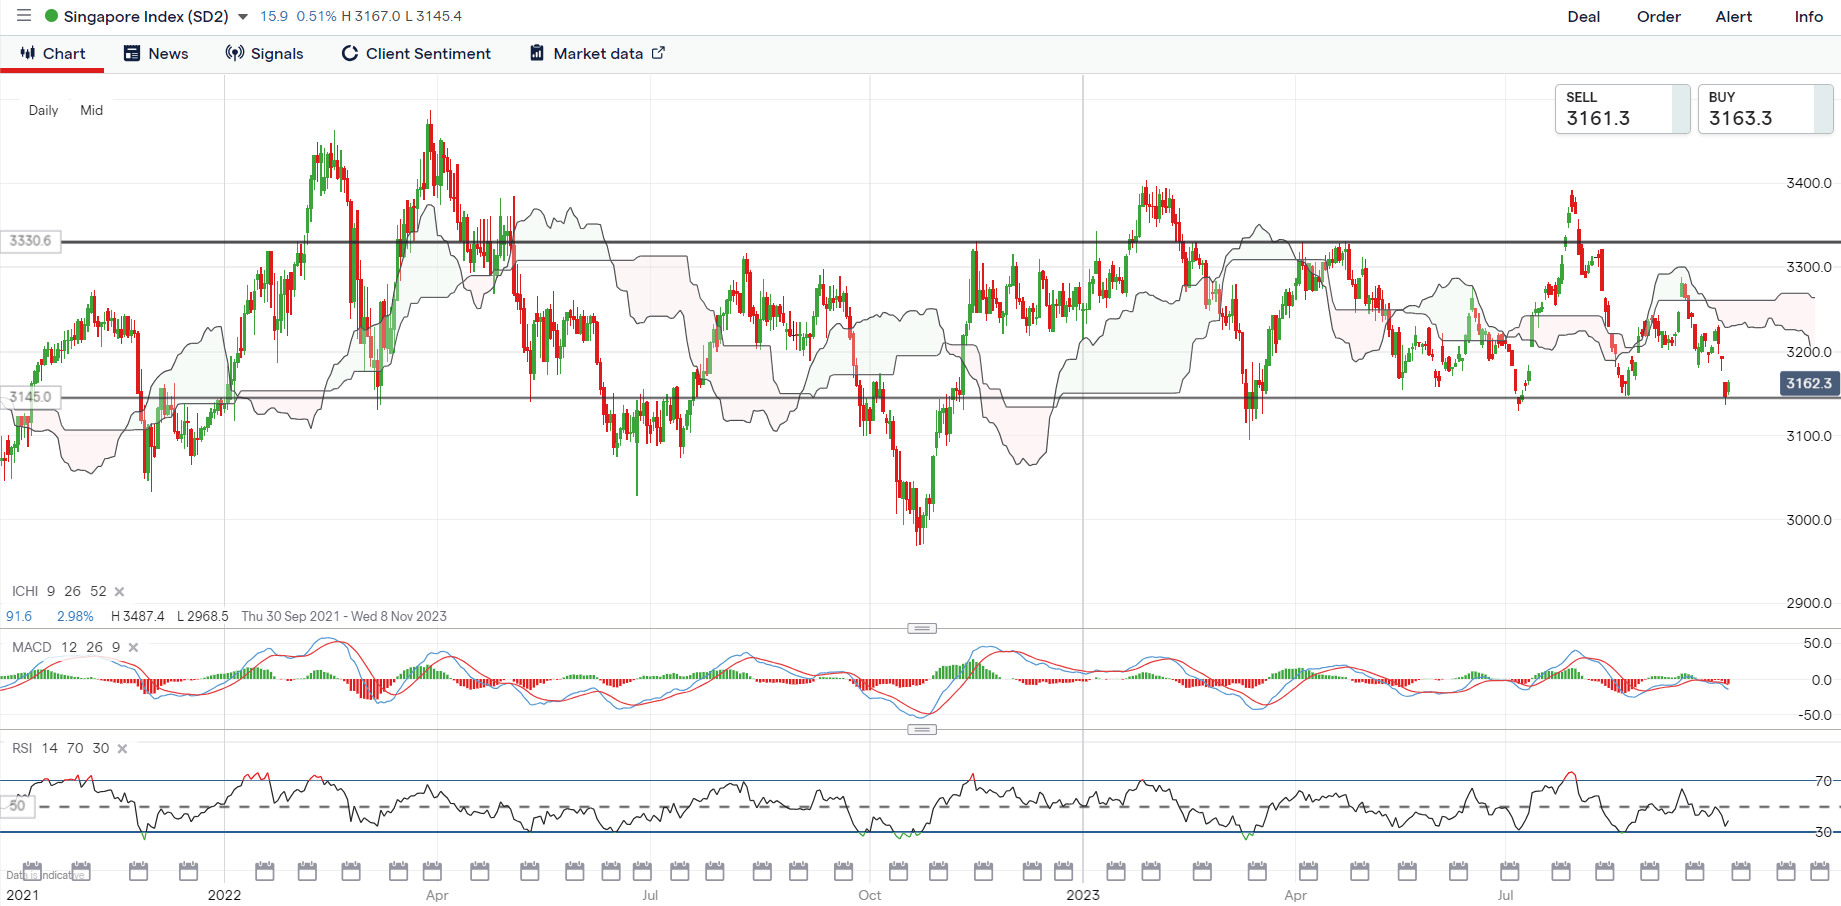
image2.png

On the watchlist: Natural gas prices touch eight-month high

Natural gas prices have been largely stuck in its base-building phase since February this year, but are starting to see some signs of life lately, as a near-term ascending channel pattern led prices to touch a new eight-month high overnight. Thus far, prices have managed to stay above its Ichimoku cloud zone on the daily chart after reclaiming it back in June 2023, with the cloud providing intermittent support on at least three previous occasions.

For now, its weekly RSI is also attempting to cross above the key 50 level for the first time since September 2022, with further positive follow-through reflecting buyers taking greater control. On the downside, the $3.000 level will serve as near-term support to hold while further upside may leave sight on the $3.400 level next.
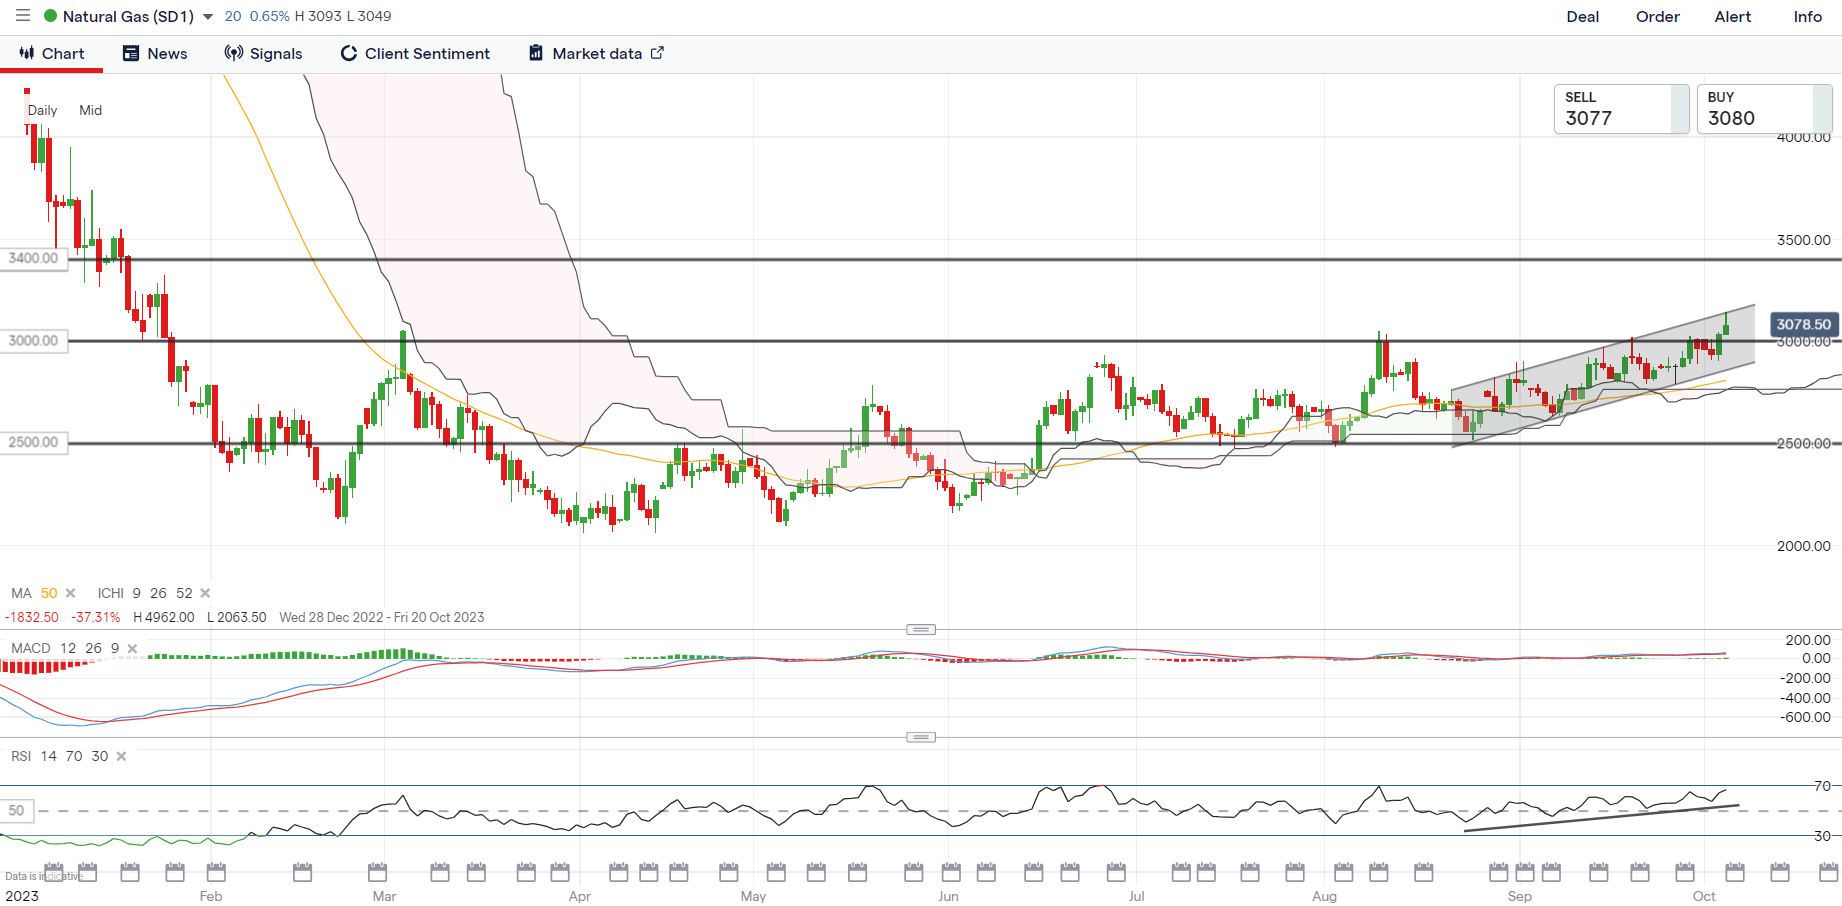
image3.png


New Zealand Dollar After RBNZ Holds Rates; NZD/USD, GBP/NZD, NZD/JPY

New Zealand Dollar After RBNZ Holds Rates; NZD/USD, GBP/NZD, NZD/JPY

The New Zealand dollar appears to be holding above strong support against the US dollar even as the Reserve Bank of New Zealand held interest rates steady at its meeting on Wednesday.

The New Zealand central bank held benchmark rates steady at a 15-year high, in line with expectations, but the accompanying statement was less hawkish than expected. RBNZ said the policy needs to remain restrictive to ensure inflation returns to its 1%-3% target, echoing the global higher-for-longer narrative, but stopped short of suggesting further increases were on the table.

Diverging economic growth and monetary policy outlooks between the US and New Zealand imply that any upside in NZD/USD could be limited. The growth outlook in New Zealand has deteriorated in recent months, compared with a material improvement in US economic growth expectations in recent months. Moreover, the US Federal Reserve has left the door open for one more rate hike before the year-end.

NZD/USD Daily Chart

image1.png

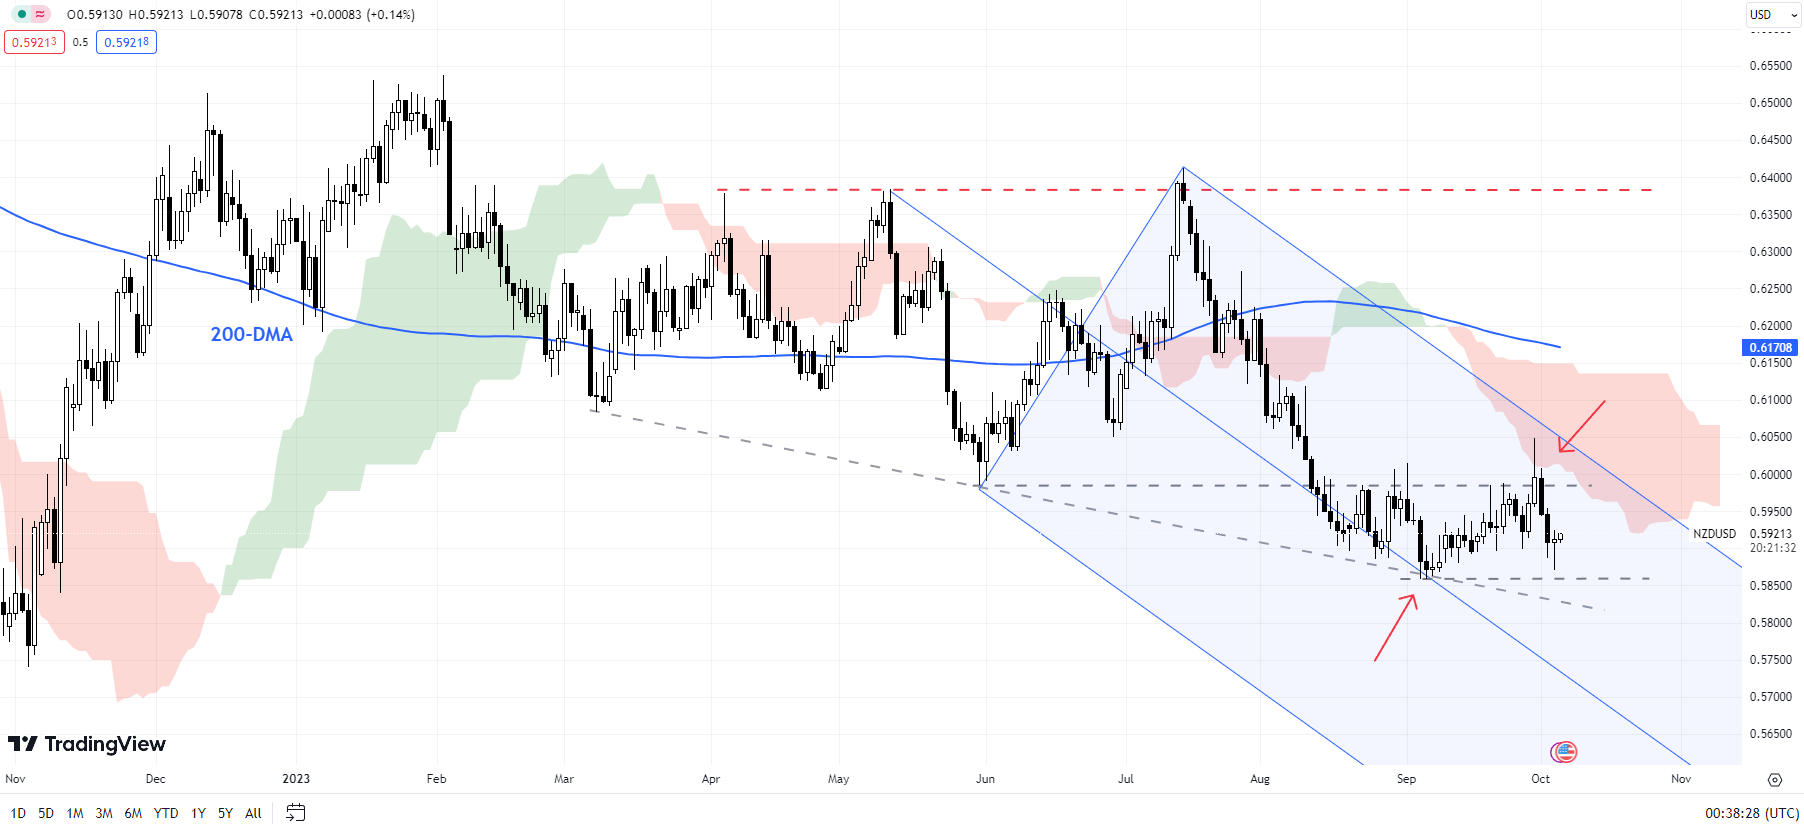
NZD/USD: Holding the above channel support

On technical charts, NZD/USD is holding above key converged support, including a downtrend line from March, the median line of a declining pitchfork channel since May, and the September low of 0.5860. In order to confirm that an interim low is in place, NZD/USD needs to break above immediate resistance at 0.6000-0.6050, including the June low and the end-September high. Until then, the path of least resistance could be sideways to down. Any break above could push the pair up toward the 200-day moving average (now at about 0.6170).

GBP/NZD Monthly Chart

image2.png

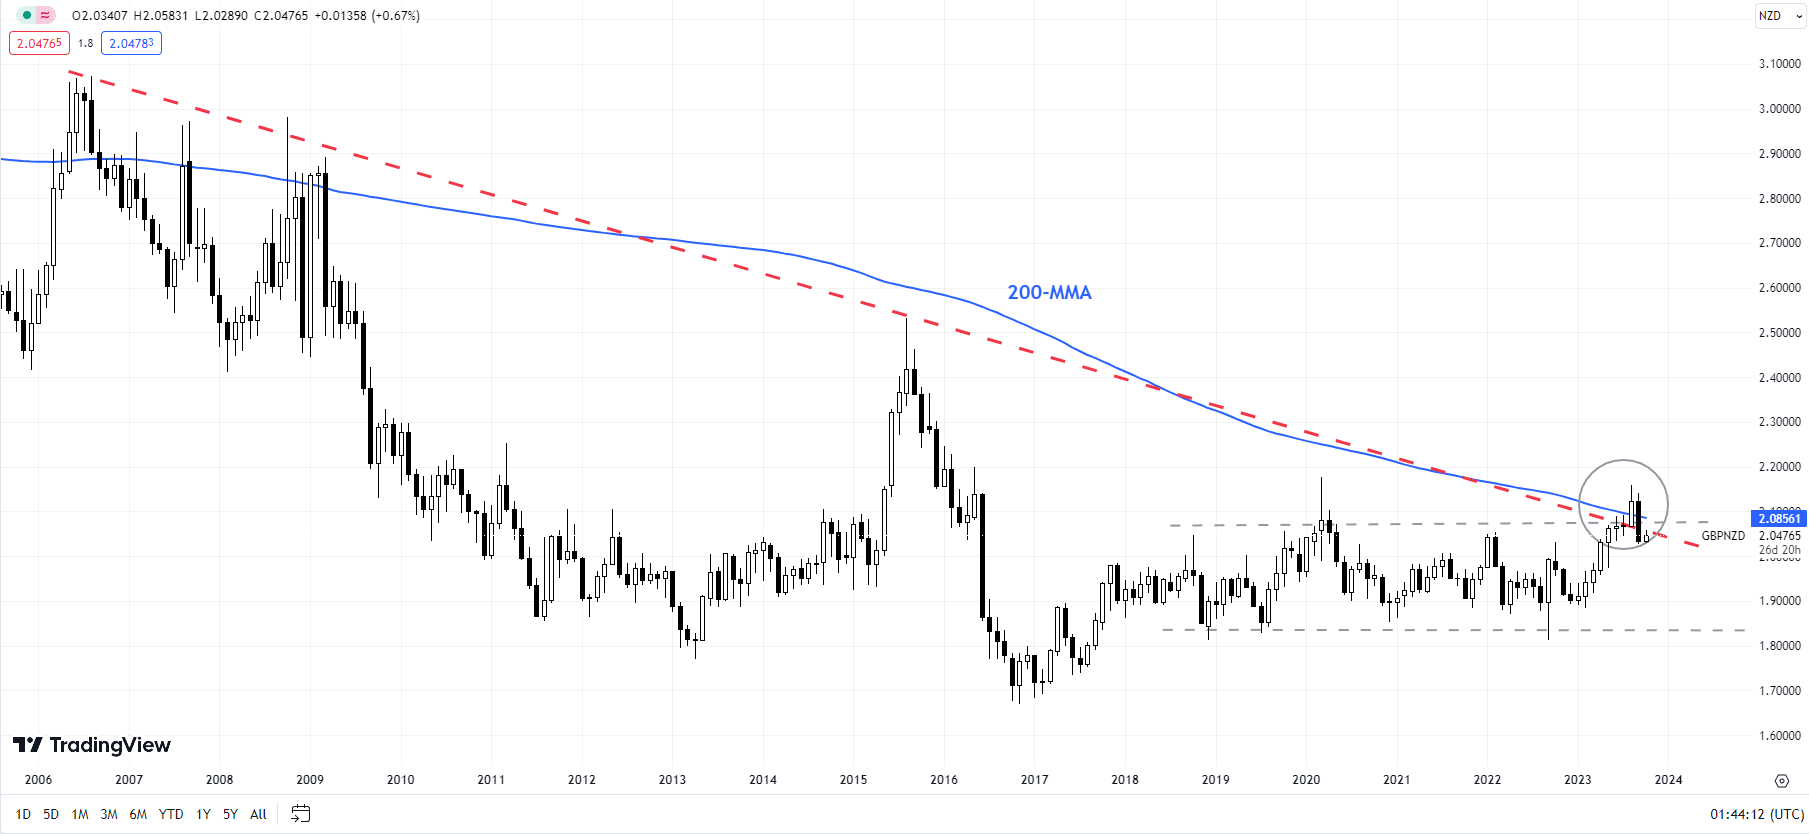
GBP/NZD: Retreats from strong resistance

GBP/NZD has retreated from strong resistance on the 200-month moving average, roughly coinciding with the 2020 high and a downtrend line from 2006. The fall below the Ichimoku cloud on the daily charts is a sign that the upward pressure has faded in the interim. Strong support is on the 200-day moving average (now at about 2.0150).

NZD/JPY Daily Chart

image3.png


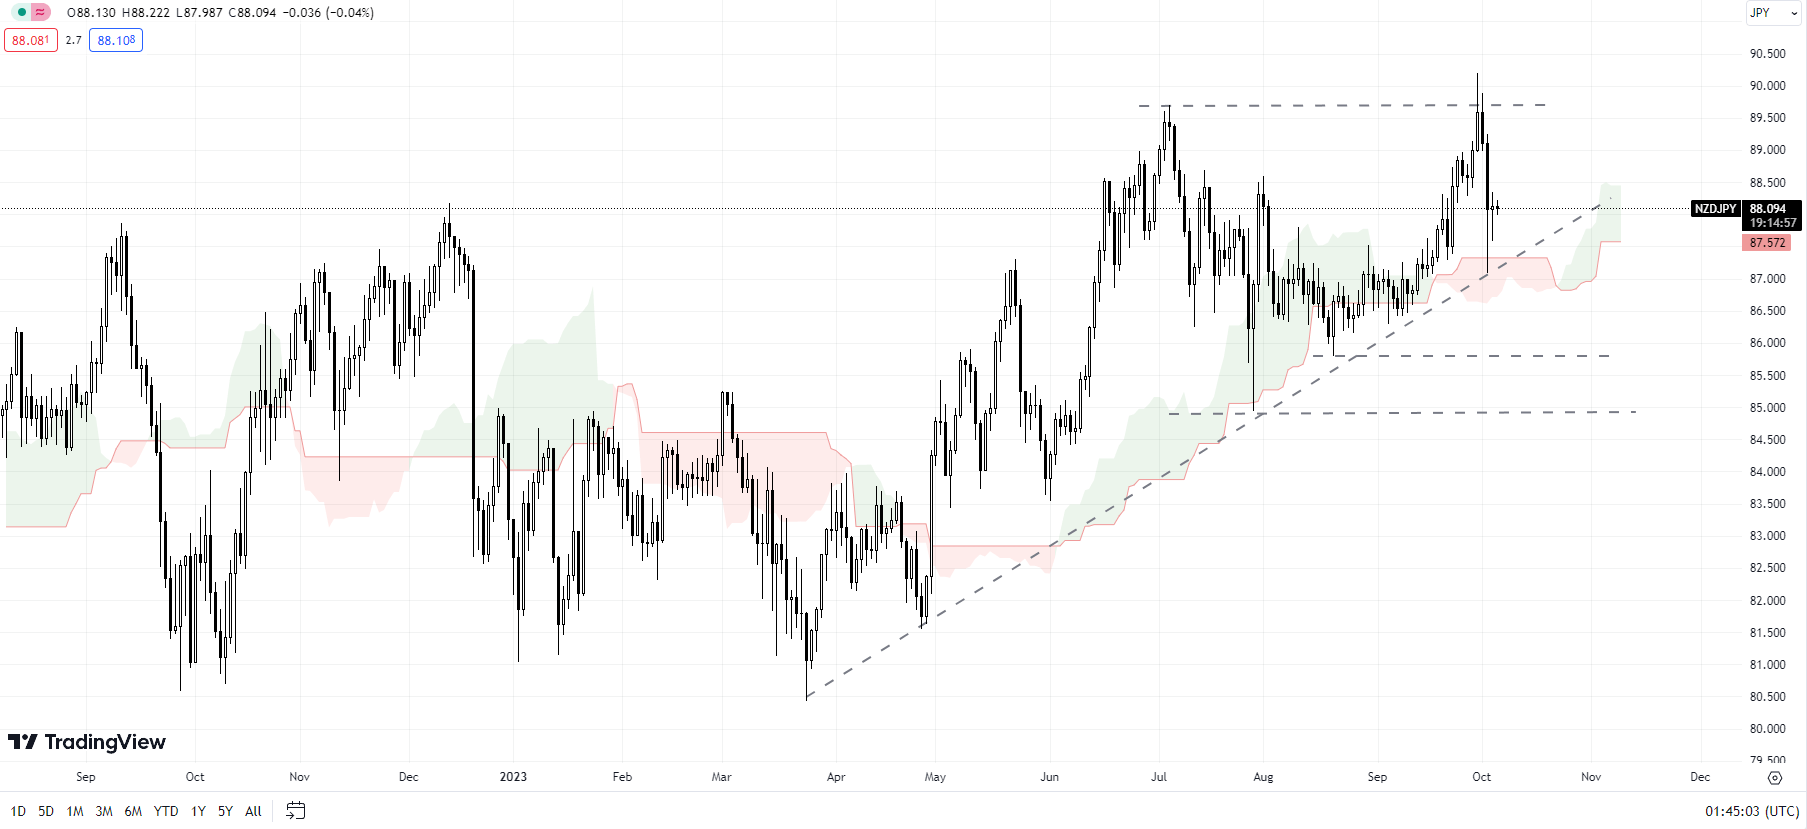
NZD/JPY: Range reinforced

The sharp retreat in recent sessions reinforces that NZD/JPY remains within the two-month range of 85.00-90.00. This follows a failure last month to break above the July high of around 90.00. Further downside could be limited to the August low of 85.85, with strong support on the 200-day moving average, near the July low of 85.00.

Canadian Dollar Outlook: USD/CAD Rally Seemingly Supported by Bearish Retail Bets

Canadian Dollar Outlook: USD/CAD Rally Seemingly Supported by Bearish Retail Bets

The Canadian Dollar is heading towards its worst 2-week period against the US Dollar since the middle of February with USD/CAD up about 1.8 percent so far. Retail traders have been responding by increasing downside exposure, which can be seen by looking at IG Client Sentiment (IGCS). The latter often functions as a contrarian indicator. With that in mind, will USD/CAD continue higher from here?

USD/CAD Sentiment Outlook – Bullish

The IGCS gauge shows that only about 27% of retail traders are net-long USD/CAD. Since most of them are biased to the downside, this suggests that prices may continue falling down the road. This is as downside exposure increased by 1.77% and 29.04% compared to yesterday and last week, respectively. With that in mind, the combination of recent changes and overall exposure offers a stronger bullish outlook.


Canadian Dollar Daily Chart

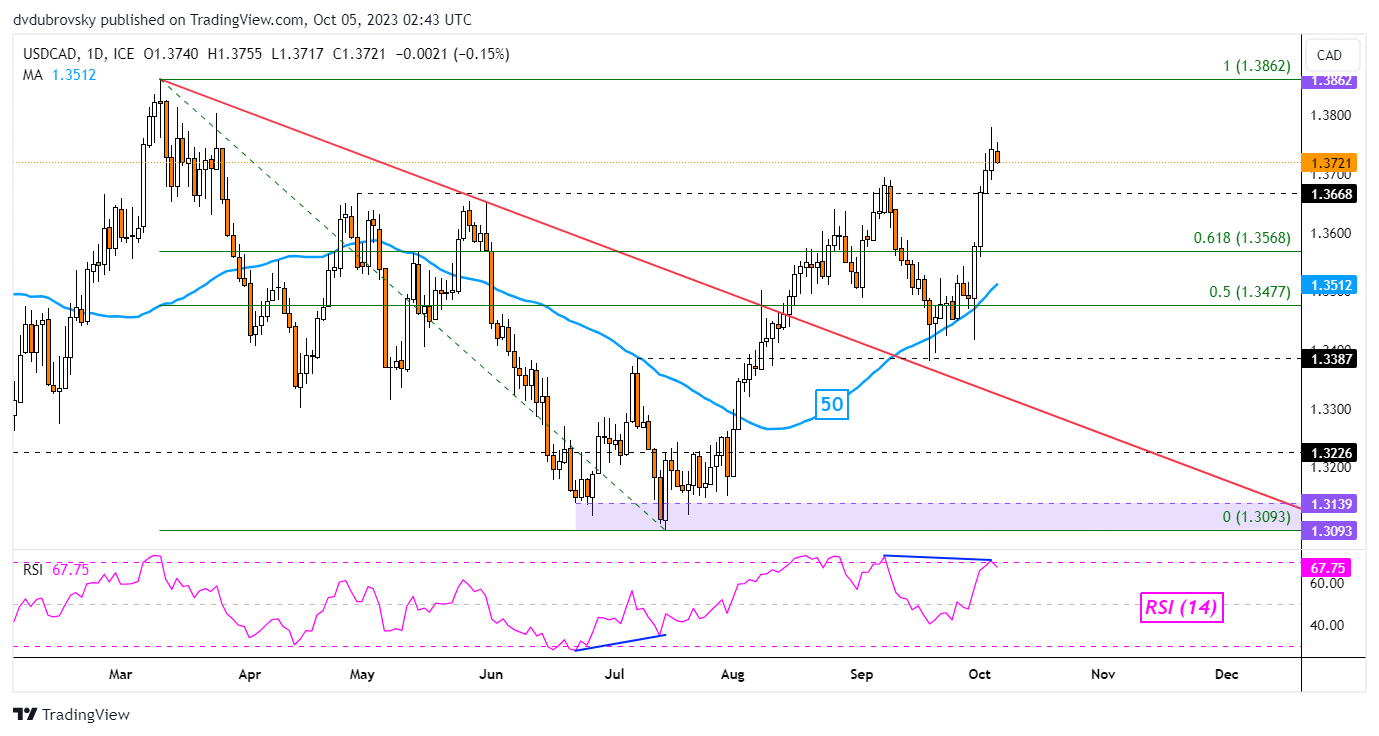
On the daily chart below, USD/CAD has confirmed a breakout above the key 1.3668 inflection zone. The latter has its beginning from earlier this year, around April. Heading into Thursday’s European trading session, the exchange rate is aiming lower. Recent gains have been occurring alongside negative RSI divergence.

This shows that upside momentum is fading, which can at times precede a turn lower. Still, in September, we saw the 50-day Moving Average hold as support, maintaining the broader upside focus. It may very well again in the event of a pronounced drawdown. That would place the focus on the 61.8% Fibonacci retracement level of 1.3568. Otherwise, extending higher turns the focus on the March high of 1.3862.

Canadian Dollar Daily Chart

US Dollar Showing Tentative Signs of Fatigue: EUR/USD, GBP/USD, USD/JPY

US Dollar Showing Tentative Signs of Fatigue: EUR/USD, GBP/USD, USD/JPY

Developments on the technical charts indicate that the US dollar’s rally is beginning to show tentative signs of fatigue, pointing to a minor pause in the near term. However, there are no signs of reversal yet, suggesting that it would be premature to conclude that the uptrend is over.

DXY Index: Upward pressure could be easing a bit

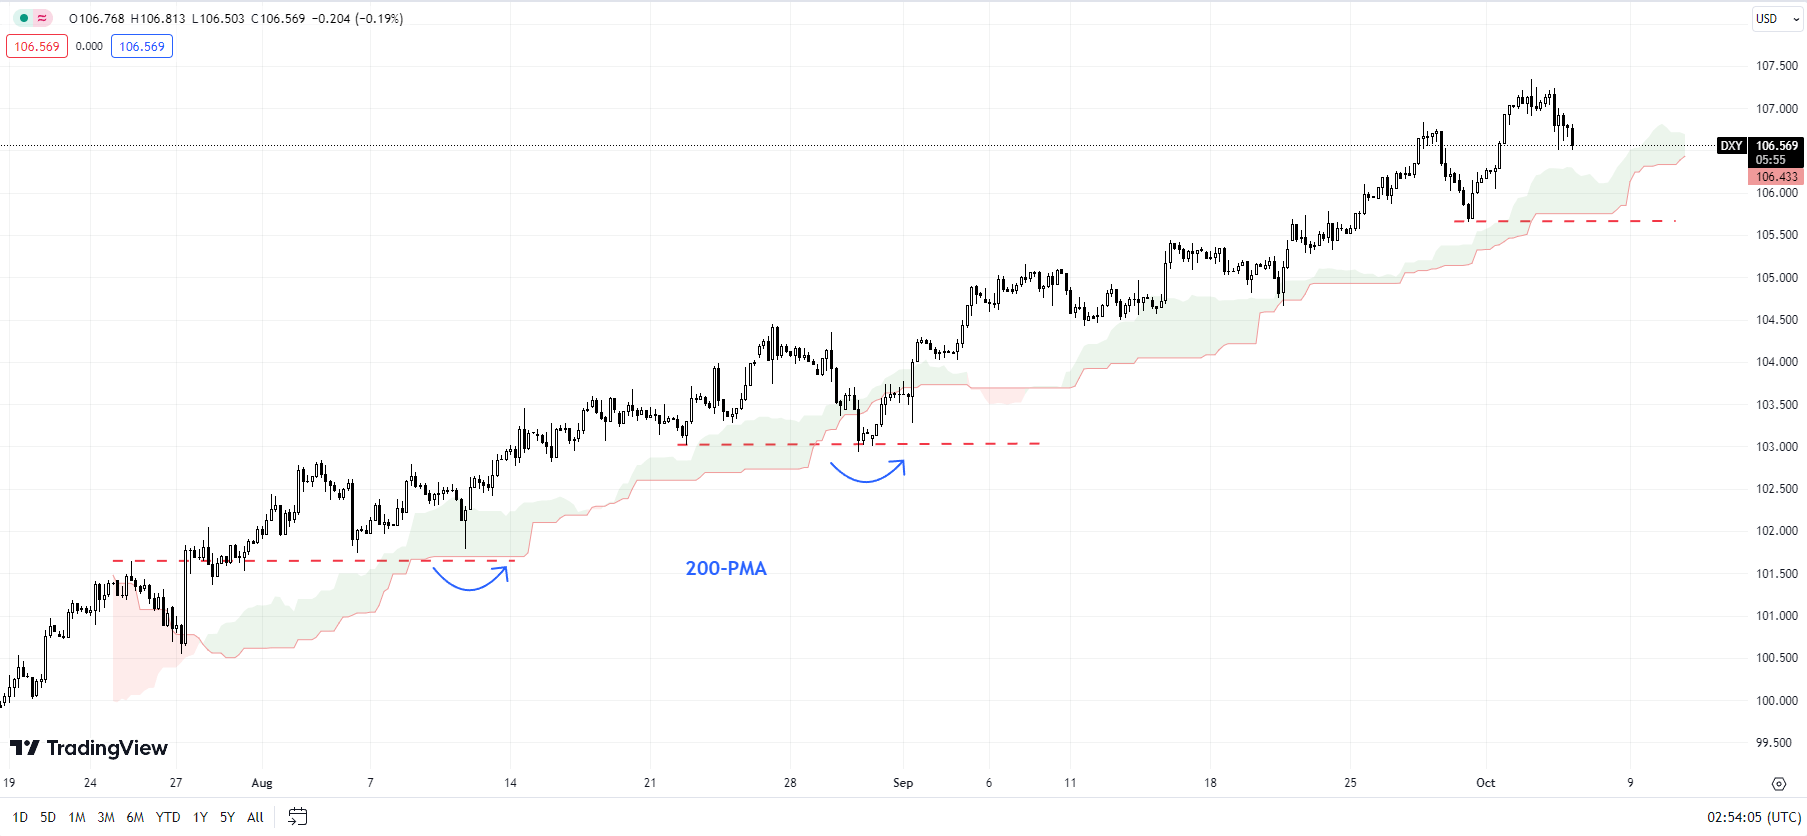
The DXY Index’s (US dollar index) fall below minor support at last week’s high of 106.85 indicates that the upward pressure has faded a bit. However, this wouldn’t imply that the uptrend is reversing – indeed, the index would need to break below quite strong support at Friday’s low of 105.65, coinciding with the lower edge of the Ichimoku cloud on the 240-minute charts.

DXY Index (USD index) 240-minute Chart

image1.png

As the accompanying chart shows, on previous occasions, the index has rebounded from similar support, so it wouldn’t be surprising if it does so again. Only a break below the 200-period moving average (now at 105.00) on the 240-minute chart would pose a threat to the broader uptrend.

EUR/USD Weekly Chart

image2.png

EUR/USD: Upward channel breaks

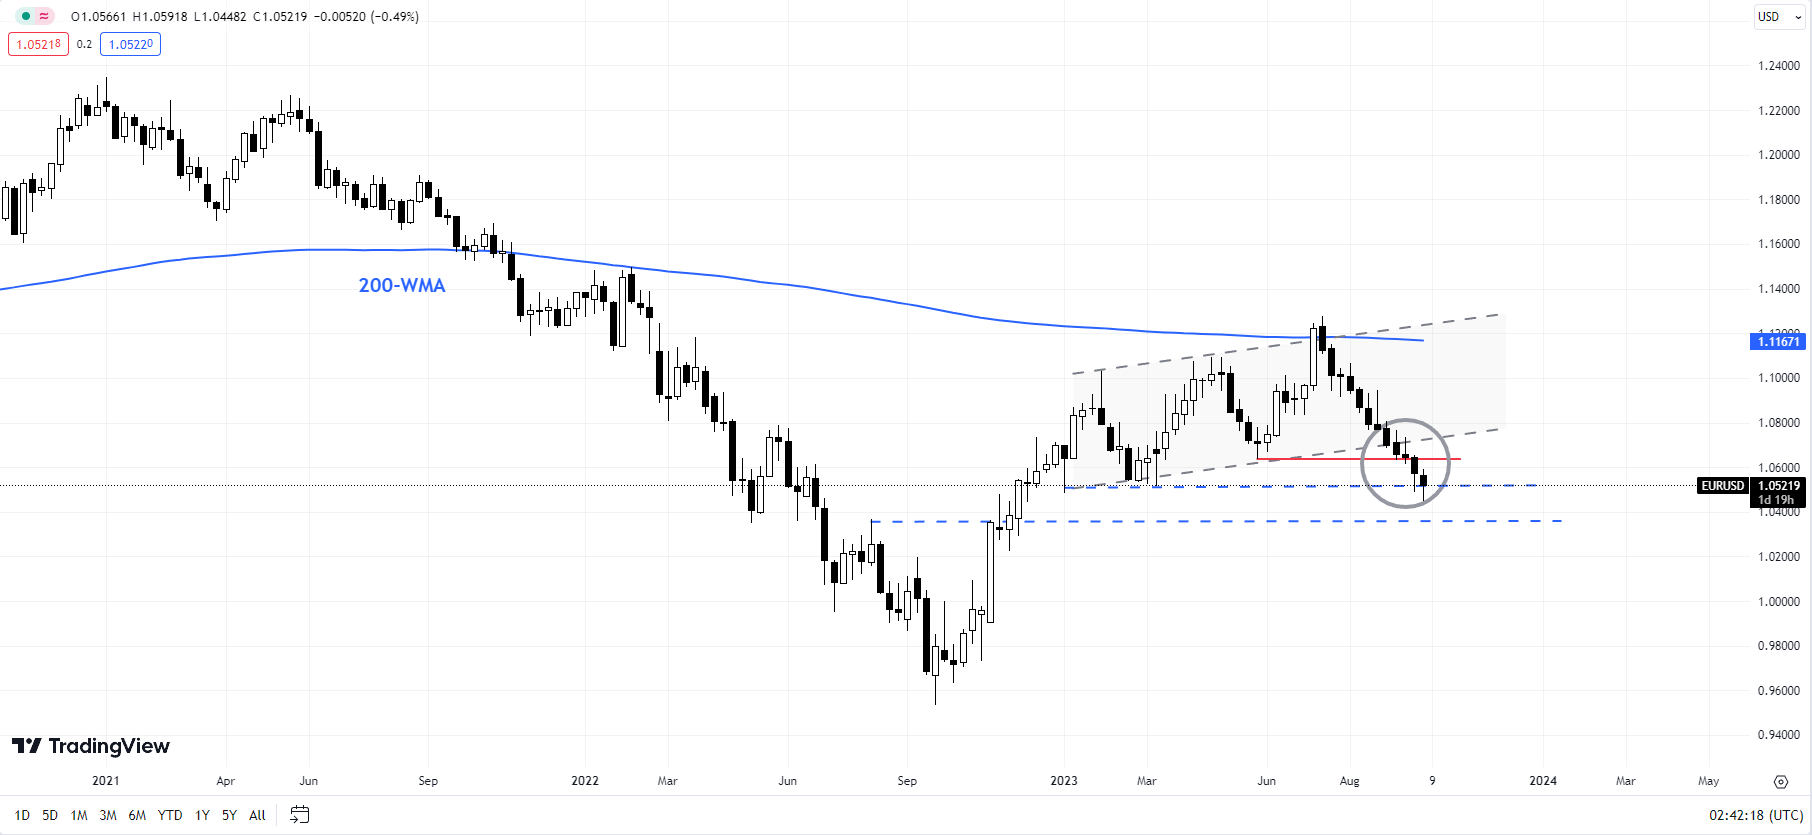
EUR/USD’s fall below the May low of 1.0635 is a sign that the broader upward pressure has faded. This coincides with a crack below the lower edge of a rising channel from early 2023. The pair is looking deeply oversold as it tests another vital floor at the January low of 1.0480, not too far from the lower edge of the Ichimoku cloud on the weekly charts (at about 1.0315). A break below 1.0315-1.0515 would pose a severe risk to the uptrend that began in late 2022. Plenty of resistance on the upside to cap corrective rallies, including 1.0650, 1.0735, and 1.0825.

GBP/USD Weekly Chart

image3.png

GBPUSD: Weak bias as it approaches support

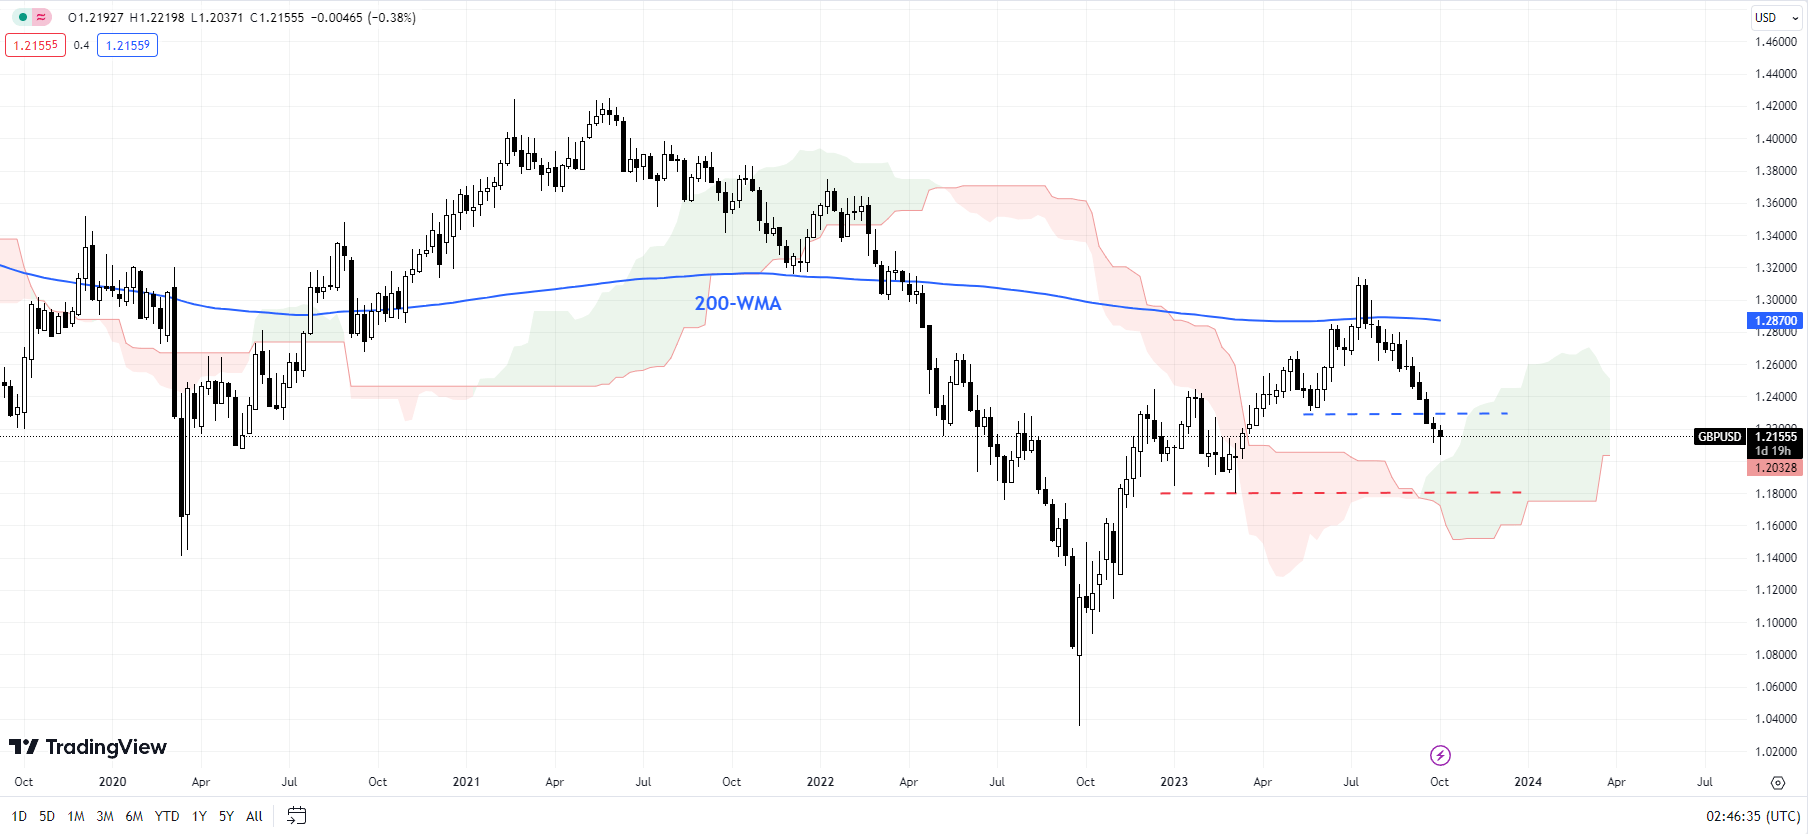
GBP/USD’s break below support at the May low of 1.2300 has opened the way toward a major cushion at the March low of 1.1800, around the lower edge of the Ichimoku cloud on the weekly charts (at about 1.1600). A fall below 1.1600-1.1800 would pose a risk to the broader recovery, disrupting the higher-top-higher-bottom sequence since late 2022.

USD/JPY Daily Chart

image4.png

USD/JPY: Sharp retreat from a tough hurdle

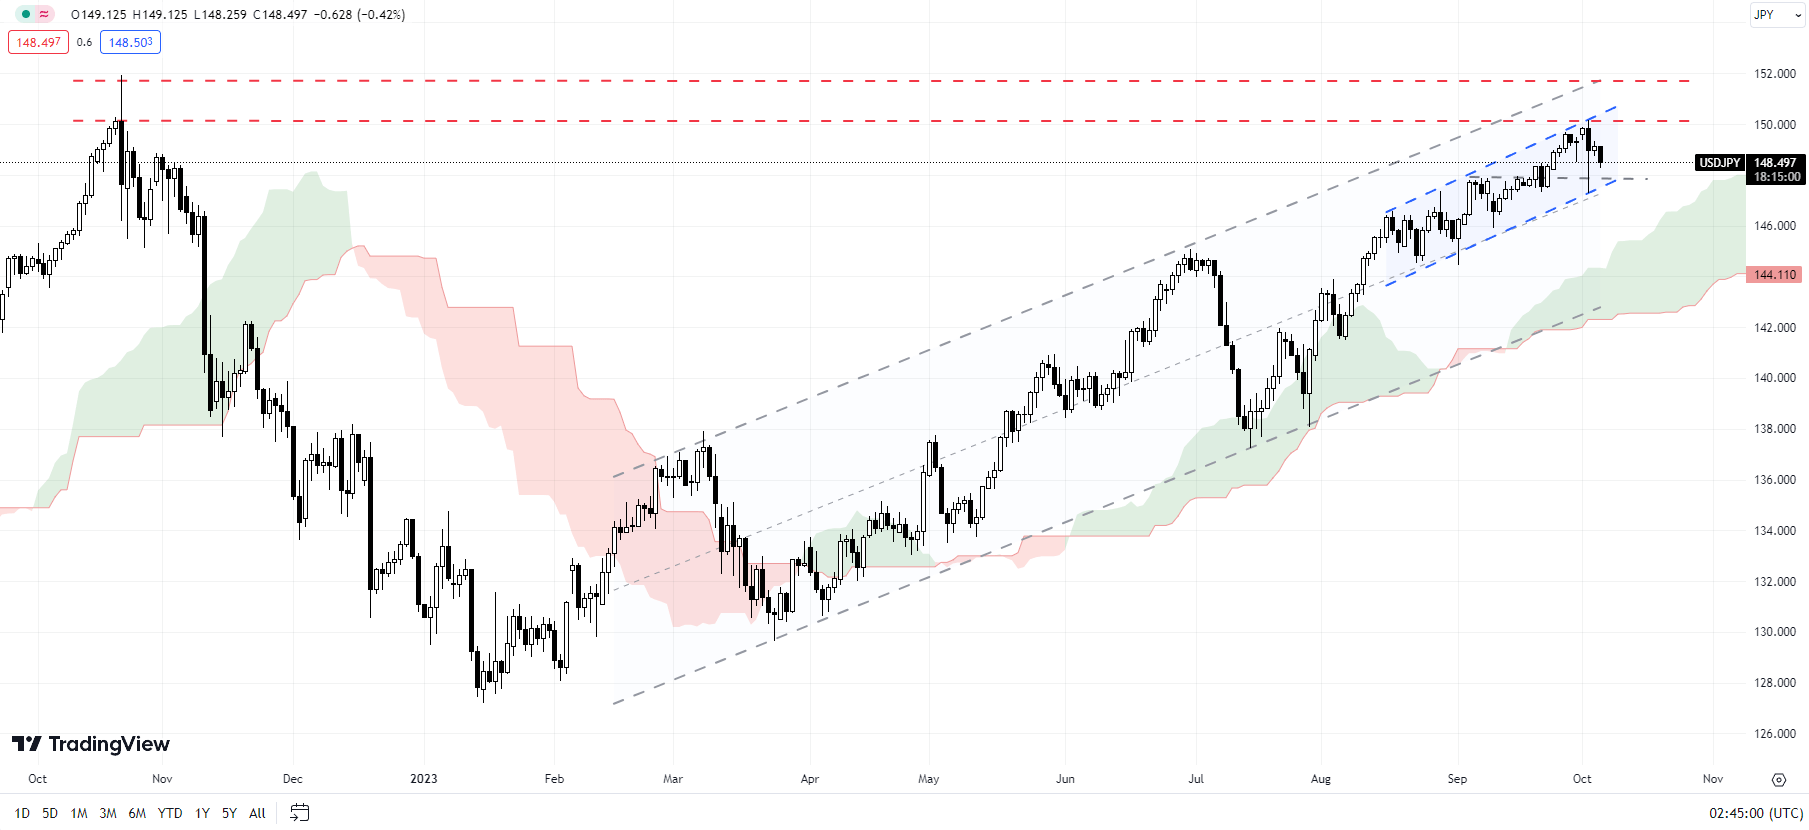
USD/JPY has retreated from the psychological barrier at 150, not too far from the 2022 high of 152.00. The bearish reversal created this week could be early signs of fatigue in the rally. However, unless USD/JPY falls under support at Tuesday’s low of 147.25, coinciding with the 200-period moving average on the 240-minute chart, along with the lower edge of a rising channel since September, the path of least resistance remains sideways to up. Any break below 147.00-147.25 could open the way toward the early-September low of 144.50.

Italian service sector shrinks fractionally in September

Italian service sector shrinks fractionally in September

Italian service providers endured a second month of falling activity in September. Incoming new business levels were unchanged, however, signalling little movement in the sector. Despite evidence of weak demand conditions, modest job creation was recorded, alongside stronger confidence towards the 12-month outlook. The headline index from the report, the HCOB Italy Services PMI® Business Activity Index remained fractionally below the 50.0 no-change mark in September at 49.9 and was little-changed compared to 49.8 in August. Overall, the latest data was indicative of a further fractional decrease in service sector

RBNZ: Official Cash Rate remains at 5.50%

RBNZ: Official Cash Rate remains at 5.50%

The Monetary Policy Committee today agreed to hold the Official Cash Rate (OCR) at 5.50%

Interest rates are constraining economic activity and reducing inflationary pressure as required.

Demand growth in the economy continues to ease. While GDP growth in the June quarter was stronger than anticipated, the growth outlook remains subdued. With monetary conditions remaining restrictive, spending growth is expected to decline further.

Globally, economic growth remains below trend and headline inflation has eased for most of our trading partners. Core inflation has also eased, but to a lesser extent. Weakening global demand is putting downward pressure on New Zealand export volumes and prices. Apart from oil, global import prices have eased.

While the imbalance between supply and demand continues to moderate in the New Zealand economy, a prolonged period of subdued activity is required to reduce inflationary pressure.

There is a near-term risk that activity and inflation do not slow as much as needed. Over the medium term, a greater slowdown in global economic demand, particularly in China, could weigh more on commodity prices and New Zealand export revenue.

The Committee agreed that the OCR needs to stay at a restrictive level to ensure that annual consumer price inflation returns to the 1 to 3% target range and to support maximum sustainable employment.

French services activity falls at sharpest pace since November 2020

French services activity falls at sharpest pace since November 2020

The French service sector continued to weaken at the end of the third quarter, with business activity levels shrinking for the fourth consecutive month. The latest HCOB PMI® survey also signalled a deepening of the contraction as output fell at the sharpest rate since November 2020. Deteriorating demand for services remained a notable feature of the latest data, with falling activity levels in other parts of the economy reportedly weighing on order books. Business confidence meanwhile slumped to its lowest level in almost three years, with companies highlighting their concerns towards future activity. Nevertheless,

ECB’s President Lagarde: Repeats ECB’s ‘Sufficiently Restrictive’ Rate Stance

ECB’s President Lagarde: Repeats ECB’s ‘Sufficiently Restrictive’ Rate Stance

“Our future decisions will ensure that the key ECB interest rates will be set at sufficiently restrictive levels for as long as necessary,” Lagarde told lawmakers Monday in the European Parliament in Brussels. She didn’t specify how lengthy that period may be, saying only that, “it’s a long race that we are in.”

Oil Prices Forecast: OPEC+ Meeting Eyed Amid WTI, Brent Futures Dip

Oil Prices Forecast: OPEC+ Meeting Eyed Amid WTI, Brent Futures Dip

Overview

Oil prices exhibited a slight decline on Wednesday, setting a cautious tone ahead of the anticipated OPEC+ ministerial panel. The global oil market finds itself at a crossroad, balancing tightening supply against the backdrop of rising interest rates that threaten to dampen fuel demand.

Market Dynamics

The modest dip saw Brent crude oil futures settling at $90.86 a barrel, while its American counterpart, West Texas Intermediate crude (WTI), hovered at $89.18 per barrel as of 06:45 GMT.

Trading Derivatives carries a high level of risk to your capital and you should only trade with money you can afford to lose. Trading Derivatives may not be suitable for all investors, so please ensure that you fully understand the risks involved, and seek independent advice if necessary. A Product Disclosure Statement (PDS) can be obtained either from this website or on request from our offices and should be considered before entering into a transaction with us. Raw Spread accounts offer spreads from 0.0 pips with a commission charge of USD $3.50 per 100k traded. Standard account offer spreads from 1 pips with no additional commission charges. Spreads on CFD indices start at 0.4 points. The information on this site is not directed at residents in any country or jurisdiction where such distribution or use would be contrary to local law or regulation.

This market hesitation mirrored broader financial tremors triggered by newly released U.S. job openings data (JOLTS), which soared to a two-year high, propelling Treasury yields alongside.

The ripple effect of this data intensified fears around persistent high interest rates, which, coupled with a strengthening dollar, casts a long shadow on global oil demand, especially from the non-dollar economies.

OPEC+ Stance

Amid these economic ripples, all eyes are on OPEC+’s upcoming meet, with prevailing expectations of an unchanged output policy. This anticipation stems from recent extensions of output cuts by key players, Saudi Arabia and Russia, aimed at stabilizing the market till year-end.

Furthermore, Saudi Arabia’s continuous hiking of its official selling price for November’s Arab Light crude to Asia reflects a tightened supply of medium sour crude, a trend likely to hold sway in the OPEC+ discourse.

Global Supply Concerns

The global supply chain carries its share of uncertainties. The prolonged hiatus in Iraqi oil exports via a Turkish pipeline awaits resolution, despite recent promising talks.

Concurrently, Russia’s indefinite fuel export ban, a measure to stabilize domestic prices and alleviate shortages, adds another layer to the global supply conundrum.

Short-Term Forecast

The forthcoming OPEC+ resolution and pending U.S. crude stockpile data from the Energy Information Administration (EIA) are pivotal.

With a recent industry report showing a drop of 4.2 million barrels in U.S. crude stocks as of September 29, a bearish sentiment looms unless OPEC+ steers a supply hike.

Amid these unfolding scenarios, investors and market stakeholders brace for a period of heightened market sensitivity.

Technical Analysis

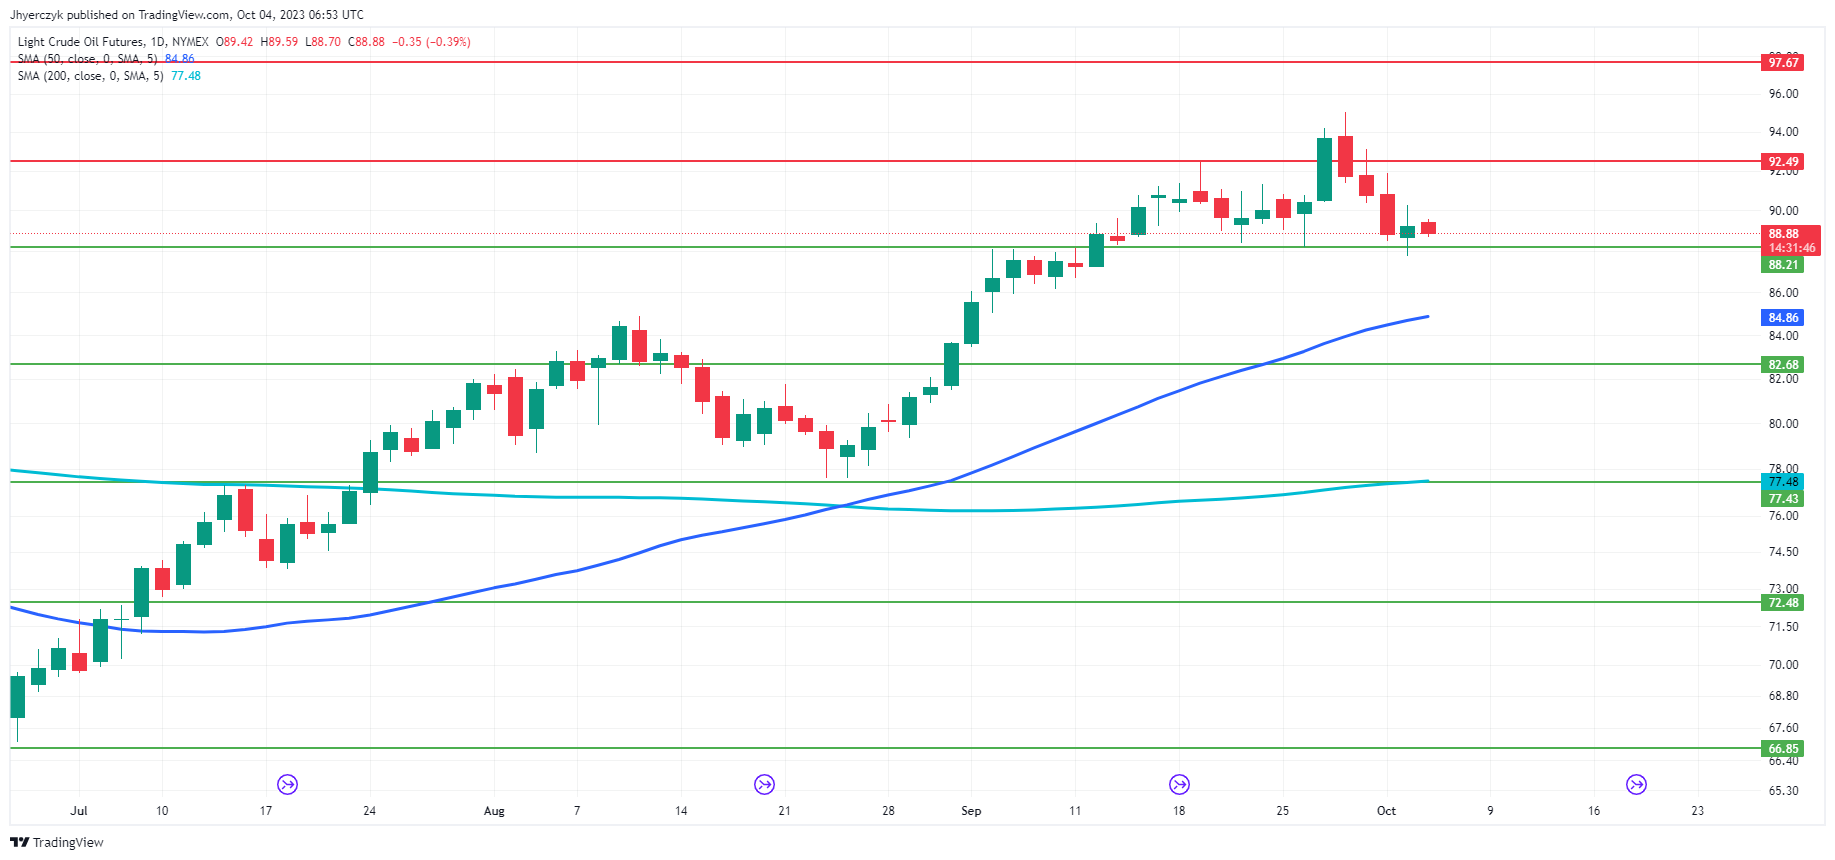
Daily Light Crude Oil FuturesBased on the daily chart data for Light Crude Oil Futures, the current daily price of 88.92 is slightly higher than the minor support level of 88.21, yet trails the previous daily price of 89.23, indicating a minor retracement.

With the price positioned above the 50-day moving average of 84.86 and significantly above the 200-day moving average of 77.48, it reflects a relatively strong standing in the short to mid-term. However, the proximity to the minor resistance level of 92.49 suggests a potential test of this threshold in the near term.

The established main support and resistance levels at 82.68 and 97.67 respectively, underscore a wider trading range, hinting at a cautiously bullish sentiment within the current market framework. Although the market is vulnerable to a near-term break into the 50-day moving average at 84.86 should short-term support fail at 88.21.