How to Trade After a News Release

How to Trade After a News Release

Post-release trading strategies

1. Trend following strategy

This strategy involves the use of multiple time frames, as well as, well-defined levels of support and resistance that come into play after a news release.

Traders can adopt this strategy when the current market price is approaching a well-defined level of support or resistance but isn’t quite there yet. The volatility after the news release has the potential to push the market toward the trendline. If price respects the trendline, traders can look to trade in the direction of the trend and trade the potential bounce.

The following 4 points are of assistance for this type of trade:

  1. Determine trend direction on a daily chart
  2. Draw support and resistance lines
  3. Select a forex time frame anywhere from 1 – 4 hours
  4. Buy near support in uptrend and sell near resistance in downtrend

Keep in mind that news releases have the potential to break through longstanding levels of support and resistance which underscores the importance of using tight stops when pursuing this strategy.

Post-release trend following strategy

2. Dual spike breakout strategy

This strategy involves waiting for market volatility to reveal a range before trading a break of that range and makes use of a five-minute chart. For illustrative purposes this section incorporates the US Non-Farm Payroll (NFP) release as this often has the greatest potential to move the market.

After the NFP release, wait 15-minutes for three five-minute candles to close. Take note of the highest price and the lowest price of the three closed candles. Next, place an entry order to go long at the highest price and an entry to go short at the lowest price. Once an order is triggered, targets can be set at twice the distance of the high/low channel while stops can be set above resistance for short trades and below support for long trades.

The disadvantage of this strategy is that volatility can push price above or below the short-term range, triggering an entry order, and then immediately reversing to hit a stop loss.

This strategy can be applied in the following way:

  1. Customize the chart settings to show 5- minute charts
  2. Take note of the highs and lows of the first three candles
  3. Set entry orders when price breaks above or below the range
  4. Set stops and limits
  5. Delete the unfilled order

Dual spike forex news trading strategy<alt image desc> Dual spike forex news trading strategy

3. News Reversal Strategy

The market can trade in one direction immediately after a major news release only to reverse and trade in the opposite direction.

The news reversal strategy looks to trade the news after the release and focuses on a sudden, sustained reversal in direction after a strong initial move in price.

The reversal could be the result of algorithms or, the market as a whole, feeling that there was an overreaction in price – prompting trades in the opposite direction.

The downside of this strategy is that no reversal takes place and the price continues trading in the direction on the initial spike.

How to implement the news reversal strategy:

  1. Initial spike in price: News with great market moving potential generally lead to a spike in price as the news is released.
  2. Look out for a reversal: Traders can wait 10-15 minutes for the reversal to bring price back to where it was before the release.
  3. Entry: Enter as price breaks above/below pre-release levels.
  4. Set multiple target levels: Traders should consider setting multiple target levels. As one is triggered, traders can take profit on half of the position and adjusting the stop on the remaining position to breakeven.

News reversal trading strategy

Trading forex after the release: Conclusion

Trading the news after the release can be a more conservative way to approach news trading. This is due to the emotions from the news release subsiding allowing a trader time to plan a technical set up for their trade. Regardless of your trading approach to news trading, risk management and utilizing small amounts or no leverage is critical to maintaining capital in your account to make the next trade.

Boost your forex trading knowledge

  • Download our free currency forecasts to stay abreast with the DailyFX expert view on forex market movements.
  • If you’re just starting out on your forex trading journey, download our free New to Forex trading guide to get to grips with the basics.

Trading after the news FAQ section

What type of news is most likely to move the market?

US economic data is so influential within global currency maekets that it is generally seen as the most important news. Additionally, it is important to note that not all news releases lead to increased volatility. Rather, there are a limited number of major news releases that have previously produced the greatest potential to move the market and some of these include:

  • US non-farm payrolls
  • US GDP
  • Us Federal Funds Rate announcement
  • ECB refinancing rate
  • Australian employment change
Oil Prices Forecast: WTI, Brent Crude Shaken by Surging Dollar, US Treasury Yields

Oil Prices Forecast: WTI, Brent Crude Shaken by Surging Dollar, US Treasury Yields

Overview

Oil prices dipped about 1% in early Asian trading on Tuesday, influenced by a strong U.S. dollar, surging U.S. bond yields, and mixed supply cues. Brent futures were down $1.19 cents to $89.52 a barrel, while U.S. WTI crude slipped $1.06 to $87.76 per barrel.

The Dollar and Bond Yields

A soaring U.S. dollar and rising bond yields are casting shadows over the oil market. The dollar rose to a 10-month high, making oil more costly for non-dollar currency holders and potentially dampening demand. Higher bond yields also imply greater storage costs for oil, which could influence traders to further deplete inventories.

Trading Derivatives carries a high level of risk to your capital and you should only trade with money you can afford to lose. Trading Derivatives may not be suitable for all investors, so please ensure that you fully understand the risks involved, and seek independent advice if necessary. A Product Disclosure Statement (PDS) can be obtained either from this website or on request from our offices and should be considered before entering into a transaction with us. Raw Spread accounts offer spreads from 0.0 pips with a commission charge of USD $3.50 per 100k traded. Standard account offer spreads from 1 pips with no additional commission charges. Spreads on CFD indices start at 0.4 points. The information on this site is not directed at residents in any country or jurisdiction where such distribution or use would be contrary to local law or regulation.

Supply Factors

Turkey is resuming operations on a six-months-stalled Iraqi pipeline, adding more supply to the market. Despite this, OPEC+ is unlikely to adjust its current production settings in its upcoming meeting, indicating a persistently tight supply.

Global Economic Signals

Mixed economic data globally adds another layer of uncertainty. While the U.S. economy showed signs of resilience, Euro zone, Germany, and Britain’s manufacturing sectors languish. China’s economic growth predictions for 2024 were cut due to a weak property sector.

Short-Term Forecast: Bearish

Given the rising U.S. dollar and bond yields, along with a mixed global economic outlook and slightly easing supply constraints, the short-term outlook for oil prices appears bearish.

The culmination of these factors suggests a complex interplay of demand and supply variables, making the oil market highly sensitive to macroeconomic indicators.

Technical Analysis

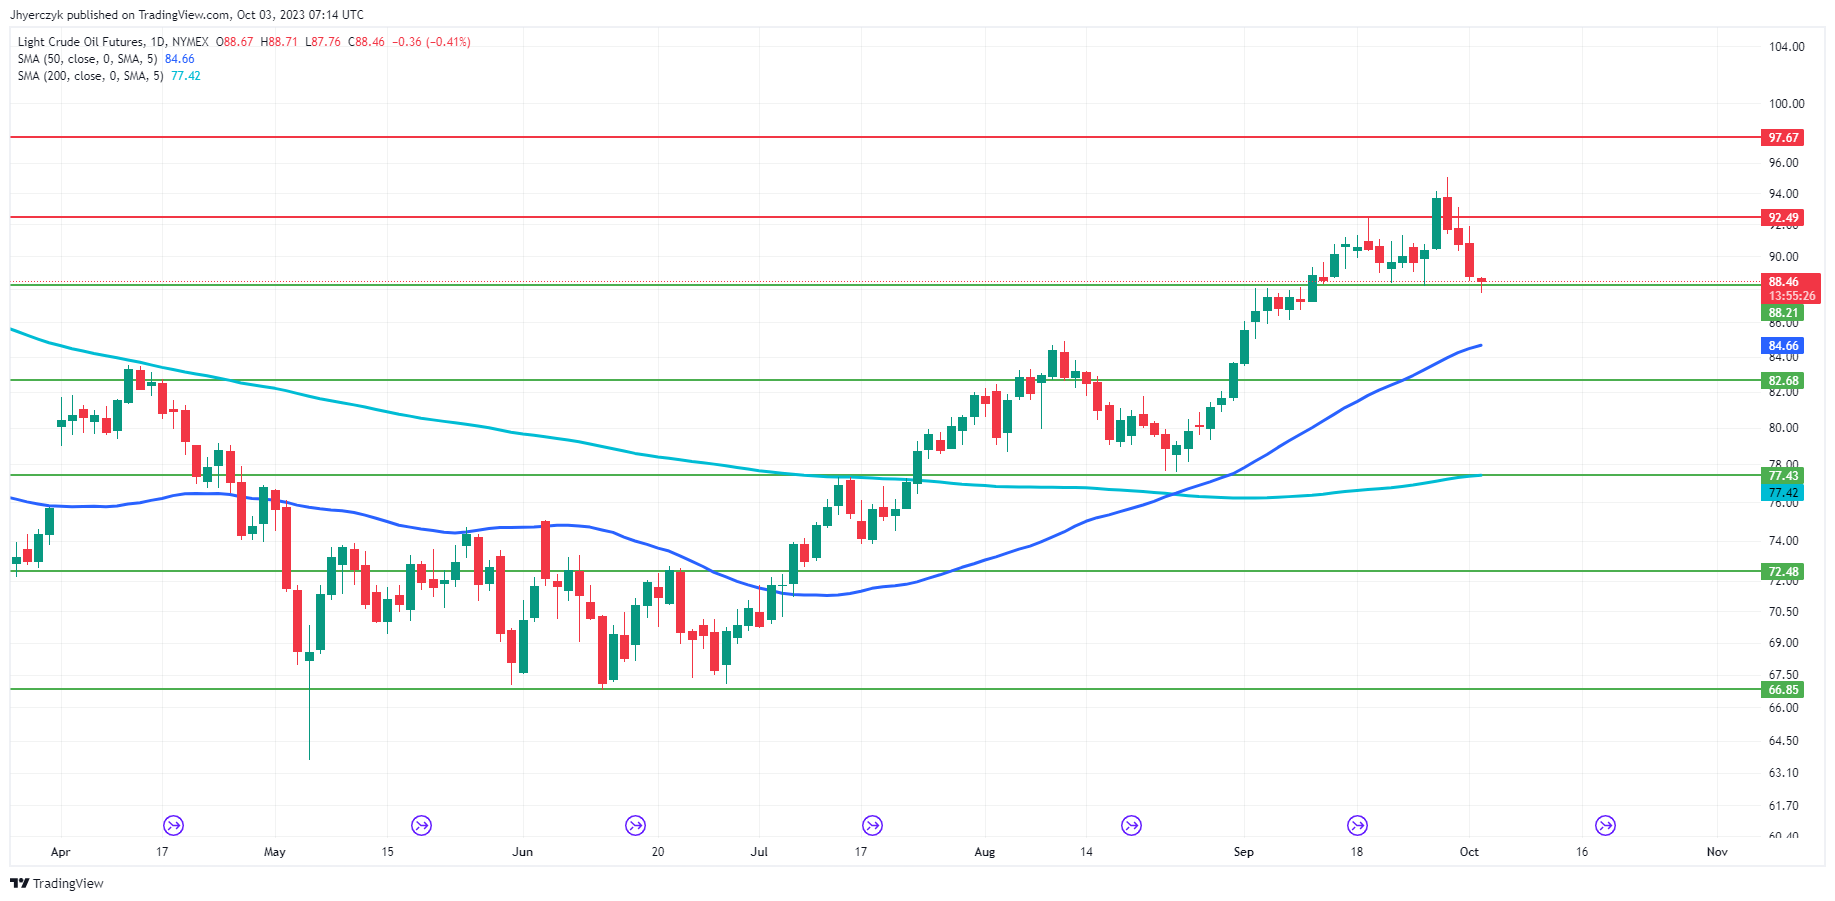
Daily Light Crude Oil Futures

With a current Daily price of 88.40, Light Crude Oil Futures are trading above both the 200-Day moving average of 77.42 and the 50-Day moving average of 84.66. This positioning suggests a longer-term and shorter-term bullish sentiment, underpinning the market’s strength.

However, the market sits dangerously close to the minor support level of 88.21. A breach of this level could potentially change the game. If this minor support is violated, traders may view it as a signal to initiate short positions, which could accelerate selling pressure and drive the price towards the main support at 82.68. Though still bullish in the bigger picture, such a move would indicate weakened momentum and could invite more sellers into the market.

The market’s proximity to minor support is a crucial factor to watch. Failure to hold this level could be a precursor to a bearish turn, even if it’s a shorter-term phenomenon within an overall bullish context.

Overall, while the market sentiment currently leans bullish, a violation of minor support could trigger a downward move towards the main support level, potentially signaling a shift towards bearish sentiment in the near term.

This Key On-chain Metric Could Send Bitcoin (BTC) Price Rally Above $30,000

This Key On-chain Metric Could Send Bitcoin (BTC) Price Rally Above $30,000

Bitcoin (BTC) price briefly broke above the $28,500 territory on Monday as the recent macro events boosted investor confidence across the crypto markets. On-chain analysis examines two vital indicators that could send Bitcoin price rally above the $30,000 mark.

Bitcoin Miners Have Depleted Their Reserves By $280 Million in Two Weeks

The ongoing Bitcoin price rally has been fueled by key macro events including the Fed Rate Pause on September 20 and series of Ethereum Futures ETFs that went live on October 2.

Trading Derivatives carries a high level of risk to your capital and you should only trade with money you can afford to lose. Trading Derivatives may not be suitable for all investors, so please ensure that you fully understand the risks involved, and seek independent advice if necessary. A Product Disclosure Statement (PDS) can be obtained either from this website or on request from our offices and should be considered before entering into a transaction with us. Raw Spread accounts offer spreads from 0.0 pips with a commission charge of USD $3.50 per 100k traded. Standard account offer spreads from 1 pips with no additional commission charges. Spreads on CFD indices start at 0.4 points. The information on this site is not directed at residents in any country or jurisdiction where such distribution or use would be contrary to local law or regulation.

However, as investors began to stack their bags, on-chain data shows that Bitcoin miners have capitalized on the favorable prices to liquidate some of their reserves.

The IntoTheBlock chart below shows that the Miners held 1.94 million BTC in their cummulative reserves as of September 19. But as of Oct 3, that figure has since dropped to 1.93 million. This implies that the miners have sold-off 10,000 BTC in the last 14 trading days.

Bitcoin Miners’ Reserves, October 2023
Bitcoin Miners’ Reserves, October 2023 | Source: IntoTheBlockThe Miners Reserves metric tracks the deposit balances in wallet addresses linked to recognized large scale Bitcoin miners and mining pools. When benchmarked to the current market prices of $27,600 , the 10,000 BTC sale means the miners have offloaded coins worth approximately $280 million in the last two weeks which has slowed down the rally.

Considering that Bitcoin Miners control about 10% of the total 19.5 million BTC in circulation, their trading activities often influence price movement significantly.

Hence, if they cool the current selling frenzy and switch into accumulation mode, they could propel the Bitcoin price rally toward the $30,000 range.

Bitcoin Price Prediction: Breaking the $28,200 Level Could Catalyze Larger Gains

The critical data point analyzed above, points towards a possible Bitcoin price breakout toward  the $30,000 range if the miners flip bullish.

The Global In/Out of Money Around Price (GIOM) data, which depicts the entry price distribution of current Bitcoin investors, also supports this bullish thesis.

It shows that if Bitcoin can break the initial resistance at $28,200, the bulls could potentially push the price breakout toward $30,000.

As shown below, 3.04 million addresses are currently holding 1.56 million BTC bought at the average price of $28,203. If they chose to sell early, the could mount a significant obstacle for the bulls.

But if the miners begin accumulate their block rewards rather than offload them,  the Bitcoin price rally could eventually surpass $30,000 mark as predicted.

Bitcoin (BTC) Price Prediction | GIOM data
Bitcoin (BTC) Price Prediction | GIOM data Source:IntoTheBlockOn the flipside, the bears could negate this narrative Bitcoin price wobbles below $25,000. However, as shown below, 6.54 million addresses had bought 2.45 million BTC at the maximum price of $26,543. Being the second largest accumulation zone, they will likely have enough in the tank to avert the bearish downswing.

But if the BTC loses that critical support level, the price could drop eventually swing below $25,000.

DAX Index, FTSE 100, STOXX 600: Investor Unease Rises Amid Prolonged US Rate Hike Fears

DAX Index, FTSE 100, STOXX 600: Investor Unease Rises Amid Prolonged US Rate Hike Fears

European Markets Navigate Economic Doldrums

European markets were in flux, reflecting investor unease in the face of mixed economic signals. While the Stoxx 600 and DAX Indexes vacillated, gains in banking could not fully offset losses in utilities and healthcare. The market’s fickle behavior comes as investors grapple with the possibility of prolonged high U.S. interest rates, buoying both the dollar and Treasury yields.

The Currency and Yield Effect

The dollar recently reached an 11-month peak, fueled by strong economic data and the passage of a U.S. funding bill to avoid a government shutdown. These developments rippled through European markets, affecting sectors differently. Banks and insurers, which generally benefit from higher interest rates, saw modest gains, contrasting sharply with the utilities sector, which sank to a 10-month low.

Trading Derivatives carries a high level of risk to your capital and you should only trade with money you can afford to lose. Trading Derivatives may not be suitable for all investors, so please ensure that you fully understand the risks involved, and seek independent advice if necessary. A Product Disclosure Statement (PDS) can be obtained either from this website or on request from our offices and should be considered before entering into a transaction with us. Raw Spread accounts offer spreads from 0.0 pips with a commission charge of USD $3.50 per 100k traded. Standard account offer spreads from 1 pips with no additional commission charges. Spreads on CFD indices start at 0.4 points. The information on this site is not directed at residents in any country or jurisdiction where such distribution or use would be contrary to local law or regulation.

Sector-Specific Movements

In the European energy sector, shares of offshore wind developer Orsted and Vestas Wind Systems faced significant declines. The rising costs of capital and commodities have turned the economics of offshore wind projects on their head. Meanwhile, British luxury firm Burberry and German online fashion retailer Zalando saw stock prices dip following downgrades from Deutsche Bank and UBS.

UK Retail and Inflation

UK’s FTSE 100 managed a slight recovery, largely due to a weaker pound boosting dollar earners. However, Boohoo, a fast-fashion retailer, slid notably after cutting its outlook. This comes even as data showed UK shop price inflation slowing, providing a glimmer of relief amid broader economic concerns.

Short-Term Outlook

The current landscape suggests caution. The European and UK markets appear sensitive to both domestic and international cues, particularly from the U.S. While some sectors are finding room to grow, the overall sentiment leans bearish, especially with the looming risk of rising interest rates.

DAX Index Technical Analysis

Daily DAX IndexIn today’s trading, the DAX Index is priced at 15,125.95, which is below both its 200-day and 50-day moving averages, situated at 15,590.26 and 15,766.08, respectively. This places the index in a generally bearish stance, suggesting that sellers are in control.

The index is hovering above the main support level of 15,096.75 but below the minor resistance of 15,472.44, indicating a potential for downside risk. Market sentiment leans bearish, particularly as the index is trading below key moving averages. Traders should exercise caution and consider the bearish context when making trading decisions.

FTSE Index Technical Analysis

Daily FTSE 100 IndexThe FTSE 100 Index currently sits at 7,509.33, positioning it below both the 200-day moving average of 7,640.26 and the 50-day moving average of 7,528.60. This indicates a bearish market sentiment as the index trades under these crucial metrics.

While it hovers above the main support level of 7,438.83, it’s below the minor resistance of 7,640.99. Despite a main resistance set at 7,748.46, the index has yet to show signs of a bullish reversal.

Given these factors, the current market landscape for the FTSE 100 Index is largely bearish, urging traders to proceed with caution with the reaction to the 50-day moving average setting the tone.

Silver Prices Forecast: Spot Silver Nears Six-Month Low as Fed Talks Rate Hikes

Silver Prices Forecast: Spot Silver Nears Six-Month Low as Fed Talks Rate Hikes

Overview

Spot silver (XAG/USD) is grappling with a wave of bearish sentiment as it touches its lowest level in over six months. The strong U.S. dollar and soaring Treasury yields, fueled by hawkish Fed comments, are painting a grim picture for the metal.

The Fed’s Role

Federal Reserve officials have been unwavering in their call for high interest rates to combat inflation, intensifying the downward pressure on silver. Despite this unity, there’s an ongoing debate among officials about the need for another rate hike this year, keeping investors on their toes.

Trading Derivatives carries a high level of risk to your capital and you should only trade with money you can afford to lose. Trading Derivatives may not be suitable for all investors, so please ensure that you fully understand the risks involved, and seek independent advice if necessary. A Product Disclosure Statement (PDS) can be obtained either from this website or on request from our offices and should be considered before entering into a transaction with us. Raw Spread accounts offer spreads from 0.0 pips with a commission charge of USD $3.50 per 100k traded. Standard account offer spreads from 1 pips with no additional commission charges. Spreads on CFD indices start at 0.4 points. The information on this site is not directed at residents in any country or jurisdiction where such distribution or use would be contrary to local law or regulation.

Treasury Yields and Dollar Impact

The greenback’s surge to a 10-month high and Treasury yields nearing historical peaks add another layer of woe for silver, priced in dollars and yielding no interest. This pressure was compounded when the U.S. dodged a government shutdown, leading to a sell-off in safe-haven Treasuries and a boost in yields.

Market Sentiment and Key Levels

Investors are closely watching the $20 per ounce level, previously a support but now a potential threshold for further declines. With a 45% chance of another rate hike this year, and a 42% probability of easing in H1 2024, the market is teeming with uncertainty.

Short-Term Forecast

The short-term outlook for silver is decidedly bearish. Given the Fed’s hawkish posture and strengthening economic indicators, a dip below the $20 mark could be the catalyst for further downside, making the upcoming U.S. Labor Department’s JOLTS report a must-watch event for traders ahead of Friday’s U.S. Non-Farm Payrolls report.

Technical Analysis

Daily Silver (XAG/USD)Silver (XAG/USD) is clearly in bearish territory, as evidenced by its significant drop below the key trend line support at $22.36. Currently trading at $21.17, the asset has not only distanced itself from this pivotal level but also fallen below both the 200-Day and 50-Day moving averages.

This downward momentum is bolstered by its position beneath minor and main support levels, further solidifying the bearish sentiment. Given this technical backdrop, the likelihood of a swift reversal appears slim.

Traders should be prepared for the possibility of continued declines, as the current setup lacks bullish indicators. Overall, the stage seems set for ongoing bearish activity in the Silver market.

Nasdaq Index, Dow Jones, S&P 500 News: Market Walks Fed Tightrope Amid Rising Yields

Nasdaq Index, Dow Jones, S&P 500 News: Market Walks Fed Tightrope Amid Rising Yields

Futures Signal Caution as Treasury Yields Hover High

U.S. stock futures are exhibiting a cautious optimism, moving slightly higher as traders remain watchful of the surging 10-year Treasury yields. S&P 500, Nasdaq 100, and Dow Jones Industrial Average futures all saw modest upticks, reflective of a market still in search of a clear direction.

Market participants are carefully assessing the Federal Reserve’s stance on interest rates. High Treasury yields, nearing their October 2007 peak, indicate that the market anticipates a tighter monetary policy for an extended period. While the Fed’s unity on combating inflation is clear, it masks a deeper debate on future rate hikes, adding another layer of complexity for investors.

Trading Derivatives carries a high level of risk to your capital and you should only trade with money you can afford to lose. Trading Derivatives may not be suitable for all investors, so please ensure that you fully understand the risks involved, and seek independent advice if necessary. A Product Disclosure Statement (PDS) can be obtained either from this website or on request from our offices and should be considered before entering into a transaction with us. Raw Spread accounts offer spreads from 0.0 pips with a commission charge of USD $3.50 per 100k traded. Standard account offer spreads from 1 pips with no additional commission charges. Spreads on CFD indices start at 0.4 points. The information on this site is not directed at residents in any country or jurisdiction where such distribution or use would be contrary to local law or regulation.


Economic Indicators in Focus

Wall Street is keen to move beyond a lackluster September, which saw all three major indices close the month and quarter in the red. Investors are turning their attention to pivotal economic reports, including the upcoming payroll numbers and the start of the earnings season. While optimism exists for strong earnings, there’s a growing sentiment that the market may be too bullish for the remaining quarters of 2023 and 2024.

Risks Loom Large

A pressing concern for the market is the potential impact of rising interest rates on corporate performance. This risk, currently underplayed, could be the most immediate threat to stocks. Additionally, investors await Tuesday’s Job Openings and Labor Turnover Survey (JOLTS), with expectations set at 8.8 million job openings, to gauge the economic landscape.

Short-Term Forecast: Treading Carefully

The market’s short-term outlook could best be described as cautiously optimistic. Traders are wary of the Fed’s next move and are keeping an eye on key economic indicators. The combination of high Treasury yields and uncertainties around economic data and corporate earnings suggests a market that is not quite ready to go full throttle on risk-taking.

Technical Analysis

Daily Nasdaq 100 E-mini FuturesIn the Nasdaq 100 E-mini Futures market, the current daily price of 14996.75 sits between the 50-Day moving average at 15262.36 and the 200-Day moving average at 13689.40. This position suggests a market in a transitional phase, grappling with both bullish and bearish influences.

While the price being above the 200-Day moving average indicates a long-term bullish trend, its placement below the 50-Day moving average could hint at short-term bearish sentiment or consolidation.

Therefore, traders may find themselves in a cautious environment, awaiting more definitive signals to clarify the market’s direction.

Overall, the market sentiment can be described as cautiously optimistic, but vulnerable to a steep break.

RBA Leaves the Cash Rate at 4.10% and Further Rate Hikes on the Table

RBA Leaves the Cash Rate at 4.10% and Further Rate Hikes on the Table

RBA Interest Rate Decision

The Reserve Bank of Australia (RBA) left the cash rate unchanged at 4.10% today. Economists forecast the RBA to hold the cash rate at 4.1%. The hold on interest rates turned investor focus to the RBA Rate Statement.

Salient points from the Rate Statement included,

  • The Board expects higher interest rates to continue delivering a more sustainable balance between supply and demand.
  • Uncertainty about the ‘surrounding’ economic outlook and the supply and demand rebalancing led the Board to leave the cash rate unchanged.
  • While past its peak, Australian inflation remained too high.
  • Service sector inflation and fuel prices continue to keep inflation elevated.
  • The Australian economy is seeing below-trend growth, weighed by the influence of high inflation on real household incomes.
  • Service price inflation remains persistent overseas and could follow a similar trend in Australia.
  • The outlook for household consumption remains uncertain.
  • Globally, stress in the Chinese economy is also contributing to the uncertain outlook.
  • Further policy tightening will hinge on incoming data and the assessment of risks.
  • The Board will focus on the global economy, domestic household spending trends, inflation, and the labor market.

The RBA held back from signaling further rate hikes. However, the Rate Statement supported bets on a higher-for-longer interest rate path to bring inflation to target.

AUD/USD Reaction to the RBA Interest Rate Decision and Rate Statement

Before the RBA interest rate decision, the AUD/USD rose to a pre-statement high of $0.63671 before falling to a low of $0.63397.

However, in response to the RBA decision and Rate Statement, the Aussie Dollar fell to a low of $0.63362 before rising to a post-Rate Statement high of $0.63508.

This morning, the AUD/USD was down 0.21% to $0.63500.

AUD/USD responds to RBA Rate Statement.
031023 AUDUSD 3 Minute Chart

Up Next

Later today, the US labor market will be in the spotlight. The influential US JOLTs Job Openings Report will garner investor interest. An upward trend in job openings would signal tight labor market conditions and support the hawkish Fed interest rate path.

Economists forecast job openings to increase from 8.827 million to 8.830 million in August.

However, investors should also consider FOMC member commentary. A rise in job openings and hawkish Fed comments would fuel another jump in US Treasury yields at the expense of riskier assets.

Gold Prices Bounce Likely Short-Lived As US Rates, China Import Move Both Weigh

Gold Prices Bounce Likely Short-Lived As US Rates, China Import Move Both Weigh

Gold Prices managed a little bounce in Friday’s European trade but remain on course for their worst monthly showing since February of this year as a range of fundamental and technical factors make life very tough for the bulls.

As always these days, the most obvious of those factors is monetary. United States interest rates are set to remain ‘higher for longer’ as the Federal Reserve battles inflation. The latest data suggest it seems to be winning the fight, but there’s no sign of any premature retreat from the field. Indeed, the markets’ base case is that rates will rise by another quarter-percentage-point this year and probably remain above 5% for all of next.

Other central banks are also apparently set to keep their benchmark rates around current levels. Given that, it’s not difficult to find some comparatively tempting risk-free yields in the government bond markets. Of course holding gold yields you nothing, and usually incurs costs, so it’s not hard to see why investors might exit their metal holdings in favor of paper.

The general strength of the US Dollar has been a great feature of the foreign exchange market this year. But that very strength makes Dollar-denominated gold and gold proxies more expensive for those forced to buy them with other currencies.

China Acts To Curb Local Gold Premium

There was some more bad news for gold on Friday as Beijing reportedly opened the door to more gold imports. That move saw Chinese gold prices fall the most in one day since 2020 as the premium on an ounce of gold in China slipped dramatically. From as high as $120 per ounce, that premium slipped to $10. Chinese investors have been very keen to hold gold in the face of strong, specific headwinds in other domestic investment markets- most notably real-estate which had been a previously enticing investment option.

As these headwinds aren’t abating, China looks likely to remain a bright spot for the gold market, but Beijing’s actions have certainly dimmed that light a bit.

Another bright spot could be further signs that inflation in the US is relaxing its grip. Should those start to see intertest-rate forecasts reassessed, and the possible timing of rate cuts brought forward, gold would likely stand to benefit.

The markets will get another important look at US price pressures later in the session with the release of August inflation numbers in the Personal Consumption and Expenditure series. This is known to be one of the Fed’s own preferred indicators, so it will surely draw a crowd.

Gold Prices Technical Analysis

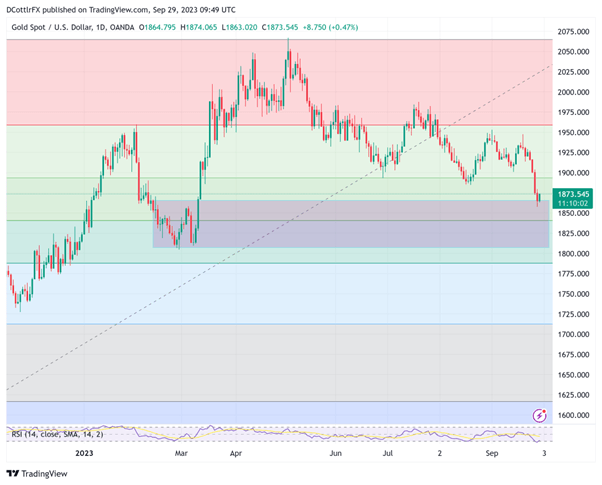
Chart Compiled Using TradingView

A broad meander lower from May’s peaks well above the psychological $2000 mark has become something more urgent in the last two weeks, with gold sliding below the 200-day moving average which had been very closely watched.

Even so, prices are still slightly higher than they were at the start of this year, even if that state doesn’t seem very likely to last. The last three days’ heavy declines have seen support give way at the last significant low, which was August 21’s intraday low of $1884.52.

Prices have also fallen below the second Fibonacci retracement of the rise up to those May peaks from the lows of November last year. That came in at $1893.52, and was broken below on Wednesday. Focus is now back on the broad trading band from the period between February 10 and March 9 into which prices have now retreated. That contains the third retracement at $1840.66, which may struggle to contain the bears in the event that key support around $1850 decisively gives way

Oil Prices Forecast: WTI Surges Amid Tight Supplies & Chinese Demand

Oil Prices Forecast: WTI Surges Amid Tight Supplies & Chinese Demand

Overview

Oil prices witnessed a 2% weekly surge, buoyed by robust holiday demand from China and tight U.S. supply, even as the market speculates on potential supply increments from Saudi Arabia.

Chinese Demand Surge

China’s Golden Week holiday, which started on Friday, has fueled an uptick in oil prices. The boost is attributed to both international and domestic travel. Recent data reveals that the daily flights booked domestically for this year’s Golden Week have increased by 20% compared to 2019 figures, pre-COVID era. Additionally, with the stabilization signs in China’s factory activity as per recent polls, the world’s second-largest economy is likely to experience an uptick in oil demand, reinforcing the bullish sentiment.

Trading Derivatives carries a high level of risk to your capital and you should only trade with money you can afford to lose. Trading Derivatives may not be suitable for all investors, so please ensure that you fully understand the risks involved, and seek independent advice if necessary. A Product Disclosure Statement (PDS) can be obtained either from this website or on request from our offices and should be considered before entering into a transaction with us. Raw Spread accounts offer spreads from 0.0 pips with a commission charge of USD $3.50 per 100k traded. Standard account offer spreads from 1 pips with no additional commission charges. Spreads on CFD indices start at 0.4 points. The information on this site is not directed at residents in any country or jurisdiction where such distribution or use would be contrary to local law or regulation.

U.S. Fundamentals & Market Dynamics

The U.S. has exhibited consistent economic growth, suggesting sustained fuel demand. Simultaneously, tight U.S. supplies, especially with Cushing storage at its lowest since July 2022, offer price support. Notably, with U.S. oil production expected to decelerate, a potential market deficit of over 2mb/d might emerge in the final quarter, given the global demand of 103mb/d.

OPEC+ Anticipation

All eyes are set on the upcoming OPEC+ meeting, scheduled for Oct. 4, for cues on Saudi Arabia’s potential move to enhance oil supply. The recent near-30% price spike this quarter raises speculation on early easing of cuts, particularly by Saudi Arabia.

Short-Term Forecast

Given the current demand-supply dynamics, the market sentiment leans bullish. However, traders are cautious, considering the overbought market scenario and the pivotal OPEC+ meeting’s impending outcome.

Technical Analysis

Daily Light Crude Oil FuturesThe current Daily price of Light Crude Oil Futures stands at $91.73, marginally above its previous close of $91.71. When evaluated against the 200-Day moving average of $77.30, it is trading significantly higher, showcasing a prevailing bullish momentum. This sentiment is further reinforced when comparing it to the 50-Day moving average of $84.25.

The 14-Day RSI reading of 66.48, while leaning towards the overbought territory, still reflects a strong momentum.

In terms of support and resistance, the commodity is trading between the minor support level of $88.21 and minor resistance at $92.49. Given these metrics, the current market sentiment leans bullish for Light Crude Oil Futures.

DAX Index: U.S. and Eurozone Data Propel DAX Stocks; What’s Next?

DAX Index: U.S. and Eurozone Data Propel DAX Stocks; What’s Next?

DAX Thursday Overview

On Thursday, the DAX gained 0.70%. Reversing a 0.25% loss from Wednesday, the DAX ended the day at 15,324.

Crude Oil and US Treasury Yields Offer Respite

On Thursday, the European markets ignored a slump in the Hang Seng Index and the Nikkei. After a pre-European session spike, falling US Treasury yields and a pullback in crude oil prices supported buyer appetite.

Trading Derivatives carries a high level of risk to your capital and you should only trade with money you can afford to lose. Trading Derivatives may not be suitable for all investors, so please ensure that you fully understand the risks involved, and seek independent advice if necessary. A Product Disclosure Statement (PDS) can be obtained either from this website or on request from our offices and should be considered before entering into a transaction with us. Raw Spread accounts offer spreads from 0.0 pips with a commission charge of USD $3.50 per 100k traded. Standard account offer spreads from 1 pips with no additional commission charges. Spreads on CFD indices start at 0.4 points. The information on this site is not directed at residents in any country or jurisdiction where such distribution or use would be contrary to local law or regulation.

Investors also responded favorably to softer-than-expected German inflation numbers.

However, US jobless claims beat forecasts, pushing 10-year US Treasury yields to a session high before reversing. US GDP numbers for Q2 also supported the brief spike in yields. The US economy expanded by 2.1% in the second quarter.

The US equity markets responded to the economic indicators, falling crude oil prices, and the pullback in US Treasury yields.

On Thursday, the NASDAQ Composite Index gained 0.83%. The S&P 500 and the Dow ended the day up 0.59% and 0.35%, respectively.

The Thursday Market Movers

Tech and auto stocks rose on the pullback in US Treasury yields and softer German inflation figures.

MTU Aero led the way, jumping 3.85%, and Infineon Technologies ended the session up 1.93%.

Continental AG rallied 2.74%, with Daimler Truck Holding gaining 1.59%.

Eurozone Inflation

German retail sales and unemployment figures will garner interest early in the Friday session. A pickup in retail sales and steady unemployment numbers may offer early support.

However, Eurozone inflation figures must align with the German inflation numbers from Thursday. Hotter-than-expected Eurozone inflation figures would spook investors before the US session.

Economists forecast the core annual inflation rate to soften from 5.3% to 4.8% in September.

With inflation in the spotlight, ECB President Christine Lagarde is on the calendar to speak today. A reiteration of higher for longer would need consideration but shouldn’t surprise the markets.

While economic indicators will provide direction, crude oil prices and government bond yields need monitoring. An upswing in crude oil prices and government bond yields will likely test buyer appetite.

US Core PCE Price Index and Personal Spending in Focus

After the better-than-expected labor market numbers on Thursday, the focus will shift to the Personal Income & Outlays report.

Sticky inflation, a pickup in consumption, and an uptrend in personal income may fuel bets on a December Fed rate hike. US Treasury yield responses to the numbers will likely dictate the direction of the DAX.

Economists forecast personal income to rise by 0.4% in August (July: +0.2%). However, economists predict the Core PCE Price Index to increase by 3.9% year-over-year (July: +4.2%) and personal spending to rise by 0.4% (July: +0.8%).

The DAX and NASDAQ mini were up 40 and 24 points this morning.

Short-Term Forecast

Near-term trends hinge on the Eurozone and US inflation figures out today. Softer inflation numbers will likely support a pullback in government bond yields. However, investors must consider further spikes in crude oil prices, which would test the appetite for riskier assets.

DAX Technical Indicators

Daily Chart

The DAX remained below the 50-day and 200-day EMAs, affirming bearish price signals. A break below the 15,245 support level would give the bears a look at the 15,058 support level.

Hotter-than-expected Eurozone and US inflation numbers will likely weigh on DAX stocks.

However, a DAX rise to 15,400 would support a move to the 15,459 resistance level and the 200-day EMA. Selling pressure will intensify in the 15,450 – 15,460 range. The 200-day EMA is confluent with the 15,459 resistance level.

The 14-Daily RSI reading of 36.79 indicates a DAX fall through the 15,245 support level before entering oversold territory.

DAX Daily Chart sends bearish price signals.
DAX 290923 Daily Chart

4-Hourly Chart

The DAX, remaining below the 50-day and 200-day EMAs, reaffirms bearish price signals. A DAX fall through the 15,245 support level would bring the 15,058 support level into view.

However, a DAX return to 15,400 would support a break above the 15,459 resistance level to target 15,500.

The 38.63 RSI reading supports a DAX fall through the 15,245 support level before reentering the oversold territory.

4-Hourly Chart affirms bearish price signals.
DAX 290923 4-Hourly Chart