DAX Index, FTSE 100, STOXX 600: Equities Higher as Investors Await Euro Zone Inflation Data

DAX Index, FTSE 100, STOXX 600: Equities Higher as Investors Await Euro Zone Inflation Data

European Markets Respond to Inflation and Sectoral Shifts

European equities experienced a boost this Friday, buoyed by strong performances in the luxury and tech sectors. The close of a tumultuous quarter has seen investors keenly eyeing critical economic data, notably from Germany and France. Despite the gains, the STOXX 600 is on track to shed nearly 2% this quarter, and Germany’s DAX faces a sharper decline.

Central to this quarter’s narrative are Germany’s lackluster retail figures for August, impacted by mounting inflation. Contrasting this, France’s inflation pressures eased unexpectedly in September. As the day progressed, market analysts keenly await the Eurozone’s inflation data, which could further illuminate the ECB’s future strategy.

Trading Derivatives carries a high level of risk to your capital and you should only trade with money you can afford to lose. Trading Derivatives may not be suitable for all investors, so please ensure that you fully understand the risks involved, and seek independent advice if necessary. A Product Disclosure Statement (PDS) can be obtained either from this website or on request from our offices and should be considered before entering into a transaction with us. Raw Spread accounts offer spreads from 0.0 pips with a commission charge of USD $3.50 per 100k traded. Standard account offer spreads from 1 pips with no additional commission charges. Spreads on CFD indices start at 0.4 points. The information on this site is not directed at residents in any country or jurisdiction where such distribution or use would be contrary to local law or regulation.

In the corporate arena, luxury giants like LVMH and Richemont registered significant gains, propelling early trading. Furthermore, Adidas’ stock performance, encouraged by Nike’s robust earnings report, painted an optimistic picture. The tech sector, having grappled with concerns over prolonged high-interest rates, witnessed a rebound, offering a silver lining to its quarterly narrative.

Across the Channel, the UK basked in positive sentiment. Friday’s economic data revision underscored Britain’s commendable post-pandemic recovery, outpacing European mainstays Germany and France. With sectors such as consumer staples leading the rally, and strategic corporate moves like those from Aston Martin and Severn Trent shaping market sentiment, the UK’s resilience seems to shine in an otherwise mixed European scenario.

DAX Index Technical Analysis

The DAX Index, presently priced at 15443.60, sits below both the 50-Day and 200-Day moving averages, positioned at 15807.70 and 15578.58 respectively, indicating a bearish short-term sentiment.The 14-Day RSI stands at 42.28, suggesting a weakened momentum but not yet in oversold territory. In terms of support and resistance levels, the DAX is currently nestled between minor support at 15264.23 and minor resistance at 15472.44.

Given these technical observations, the DAX Index portrays a short-term bearish sentiment, as it remains constricted below pivotal moving averages.

FTSE 100 Technical Analysis

In the latest assessment of the FTSE 100, the index currently stands slightly above its 50-Day moving average of 7535.99 and is just shy of the 200-Day moving average, positioned at 7640.39.The 14-Day RSI, clocking in at 58.75, indicates moderately strengthened momentum but hasn’t yet ventured into overbought territory.

While there’s no explicit trend line support mentioned, the FTSE 100 is nudging close to the trend line resistance of 7703.55. Navigating between minor and main resistance levels, the index portrays a bullish tilt. Given these technical readings and its proximity to key resistances, the market sentiment leans bullish for the FTSE 100 in the short term.

Eurostat Reports: Eurozone Faces Sharp Inflation Decline in September

Eurostat Reports: Eurozone Faces Sharp Inflation Decline in September

Eurozone Inflation Slows in September 2023

In a notable downturn, Eurozone’s annual inflation rate is projected to decrease to 4.3% in September 2023, a significant drop from August’s 5.2%. This recent data stems from a preliminary report by Eurostat, the European Union’s chief statistical authority.

Diving into the inflation’s primary components, the food, alcohol, and tobacco segment is anticipated to record the steepest yearly rate in September, standing at 8.8%, albeit lower than the previous month’s 9.7%. The services sector follows closely, projected at 4.7%, down from August’s 5.5%. Similarly, the non-energy industrial goods category is estimated at 4.2%, falling from 4.7% in the preceding month. Contrastingly, the energy sector depicts a decline of 4.7%, a steeper drop compared to August’s 3.3%.

Both the Core CPI Flash Estimate y/y and the broader CPI Flash Estimate y/y underperformed, falling short of pre-report forecasts. This downward trend suggests cooling economic pressures in the Eurozone.

Conclusively, the slowdown in the inflation rate, particularly in pivotal sectors, indicates a potential easing of economic heat. For investors and policymakers alike, these figures could signal a shift in the Eurozone’s financial landscape, leaning towards a more bearish short-term outlook.

Silver Prices Forecast: Strong Short-covering Rally Ahead of US PCE Data

Silver Prices Forecast: Strong Short-covering Rally Ahead of US PCE Data

Silver’s Interest Rate Dilemma

Silver (XAG/USD) is soaring on Friday. Nonetheless, the market remains in a position to post its most dramatic monthly decline since February, primarily due to the looming prospect of enduring high interest rates. This anticipation builds up as market players await an important U.S. inflation metric, expected later today.

The Dollar, Treasury Yields, and Fed’s Messaging

The XAG/USD trajectory points toward a monthly slump, concurrent with the dollar and 10-year Treasury yields aiming for their most commendable quarterly results in four years. Silver traders are keenly attuned to the Federal Reserve’s communication hinting at a protracted rate stability. Richmond Fed’s President, Thomas Barkin, recently highlighted the uncertainty surrounding future monetary policy shifts.

Trading Derivatives carries a high level of risk to your capital and you should only trade with money you can afford to lose. Trading Derivatives may not be suitable for all investors, so please ensure that you fully understand the risks involved, and seek independent advice if necessary. A Product Disclosure Statement (PDS) can be obtained either from this website or on request from our offices and should be considered before entering into a transaction with us. Raw Spread accounts offer spreads from 0.0 pips with a commission charge of USD $3.50 per 100k traded. Standard account offer spreads from 1 pips with no additional commission charges. Spreads on CFD indices start at 0.4 points. The information on this site is not directed at residents in any country or jurisdiction where such distribution or use would be contrary to local law or regulation.


Economic Data and Inflation Outlook

Recent data underscores the U.S. economy’s unwavering growth momentum in Q2. Market strategists are bracing for the August personal consumption expenditures (PCE) price index – the Fed’s favored inflation yardstick. The overarching investor sentiment revolves around understanding the economic health and the potential trajectory for interest rates. Notably, Neel Kashkari of Minneapolis Fed conveyed his uncertainty on whether the current rate adjustments are sufficient to counter inflation effectively.

Short-Term Silver Outlook

For silver to surpass the $24.00 benchmark, a combination of a subdued dollar and relaxed bond yields is vital. However, given current market dynamics, such a positive twist seems distant.

Technical Analysis

Daily Silver XAG/USDSilver’s (XAG/USD) current predicament in the financial market landscape hinges on several technical indicators.

The metal’s daily price of 23.03 is precisely at its minor support level and has marginally surpassed its recent closing price, indicating a mild upward momentum. However, the current valuation coincides with the 50-Day moving average of 23.46, highlighting a neutral stance.

The 14-Day RSI stands at 46.93, suggesting a slightly weakened momentum.

Notably, with the current price closer to the trend line support of 22.32 than the resistance of 24.83, downside risks seem evident. Given these dynamics, the market sentiment for Silver currently leans bearish.

Gold Prices Forecast: XAU/USD Faces Headwinds Amid Rising Interest Rates

Gold Prices Forecast: XAU/USD Faces Headwinds Amid Rising Interest Rates

Gold’s Prospective Decline Amid Interest Rate Shifts

Gold (XAU/USD) remains steady, teetering on the edge of its most significant monthly drop since February, primarily influenced by the anticipation of prolonged higher interest rates. This sentiment comes ahead of a crucial U.S. inflation report expected later today.

Spot Gold and U.S. Futures

As of 06:40 GMT, spot gold was priced at $1,869.40 per ounce. In contrast, U.S. gold futures witnessed a slight increase, rising by 0.42% to stand at $1,886.00. This movement places gold on the path to experience nearly a 4% decrease for the month.

Trading Derivatives carries a high level of risk to your capital and you should only trade with money you can afford to lose. Trading Derivatives may not be suitable for all investors, so please ensure that you fully understand the risks involved, and seek independent advice if necessary. A Product Disclosure Statement (PDS) can be obtained either from this website or on request from our offices and should be considered before entering into a transaction with us. Raw Spread accounts offer spreads from 0.0 pips with a commission charge of USD $3.50 per 100k traded. Standard account offer spreads from 1 pips with no additional commission charges. Spreads on CFD indices start at 0.4 points. The information on this site is not directed at residents in any country or jurisdiction where such distribution or use would be contrary to local law or regulation.

Dollar, Treasury Yields, and Fed’s Messaging

The dollar and 10-year Treasury yields are steering towards their most impressive quarters in the last four years. The gold market’s response reflects its reception of the Federal Reserve’s indication of extended rate plateaus. Richmond Fed’s President, Thomas Barkin, further added ambiguity by hinting at the uncertainty of monetary policy shifts in the upcoming months.

Economic Growth and Inflation Expectations

Recent data highlighted the U.S. economy’s consistent growth rate in the previous quarter. The financial markets are now aligning their strategies in anticipation of the Fed’s upcoming inflation metric – the August PCE price index.

Short-Term Gold Outlook

For gold to ascend past the $1,900 mark, a combination of a weaker dollar, reduced bond yields, and potentially disappointing inflation results would be necessary. However, given the current financial landscape, such an upward shift seems improbable.

Technical Analysis

Daily Gold XAU/USDGold’s (XAU/USD) current daily price of 1870.16 sits below both its 200-Day and 50-Day moving averages, indicating a potential bearish momentum.

The 14-Day RSI at 30.75 confirms this sentiment, hinting at an oversold market.

With the daily price below the minor support of 1889.37 , there’s a tangible risk of further declines.  Additionally, trend line support is positioned at 1912.41, acting as a critical threshold. Considering these metrics, the prevailing sentiment leans bearish for Gold.

UK GDP Report Offered Relief, with the UK Economy Growing by 0.2% in Q2

UK GDP Report Offered Relief, with the UK Economy Growing by 0.2% in Q2

UK GDP

The UK GDP report drew investor interest this morning. Downward revisions to the UK GDP numbers would fuel fears of a deep and prolonged UK economic recession.

The UK economy grew by 0.2% in the second quarter, consistent with the preliminary estimate of 0.2%. In the first quarter, the economy expanded by 0.3%. Year-over-year, the economy grew by 0.6%, up from a prelim 0.4% and 0.2% growth in the first quarter.

According to the Office for National Statistics,

  • A 1.2% increase in production contributed to the pickup in economic activity.
  • However, the household saving ratio jumped by 9.1% compared with a 7.1% increase in the first quarter. Social benefits, with rising salaries and wages, supported the uptick.
  • As a result, household disposable incomes increased by 1.2% after remaining flat in the previous quarter.
  • In the second quarter, the UK GDP is 1.8% above pre-COVID-19 pandemic levels.
  • While the production sector contributed to growth, the services sector showed no growth in the second quarter.
  • However, consumer-facing services grew by 0.9%.
  • Household consumption increased by 0.5%, softer than 0.7% in the first quarter.

The second quarter GDP figures will likely offer relief. However, recent UK economic indicators signal a more marked deterioration in the UK economy than previously anticipated.

The negative economic outlook may leave the Bank of England in a holding pattern. Notably, Monetary Policy Committee members will likely want to see the effects of rate hikes wash through the economy before deciding on the next move.

GBP/USD Reaction to the UK GDP Report

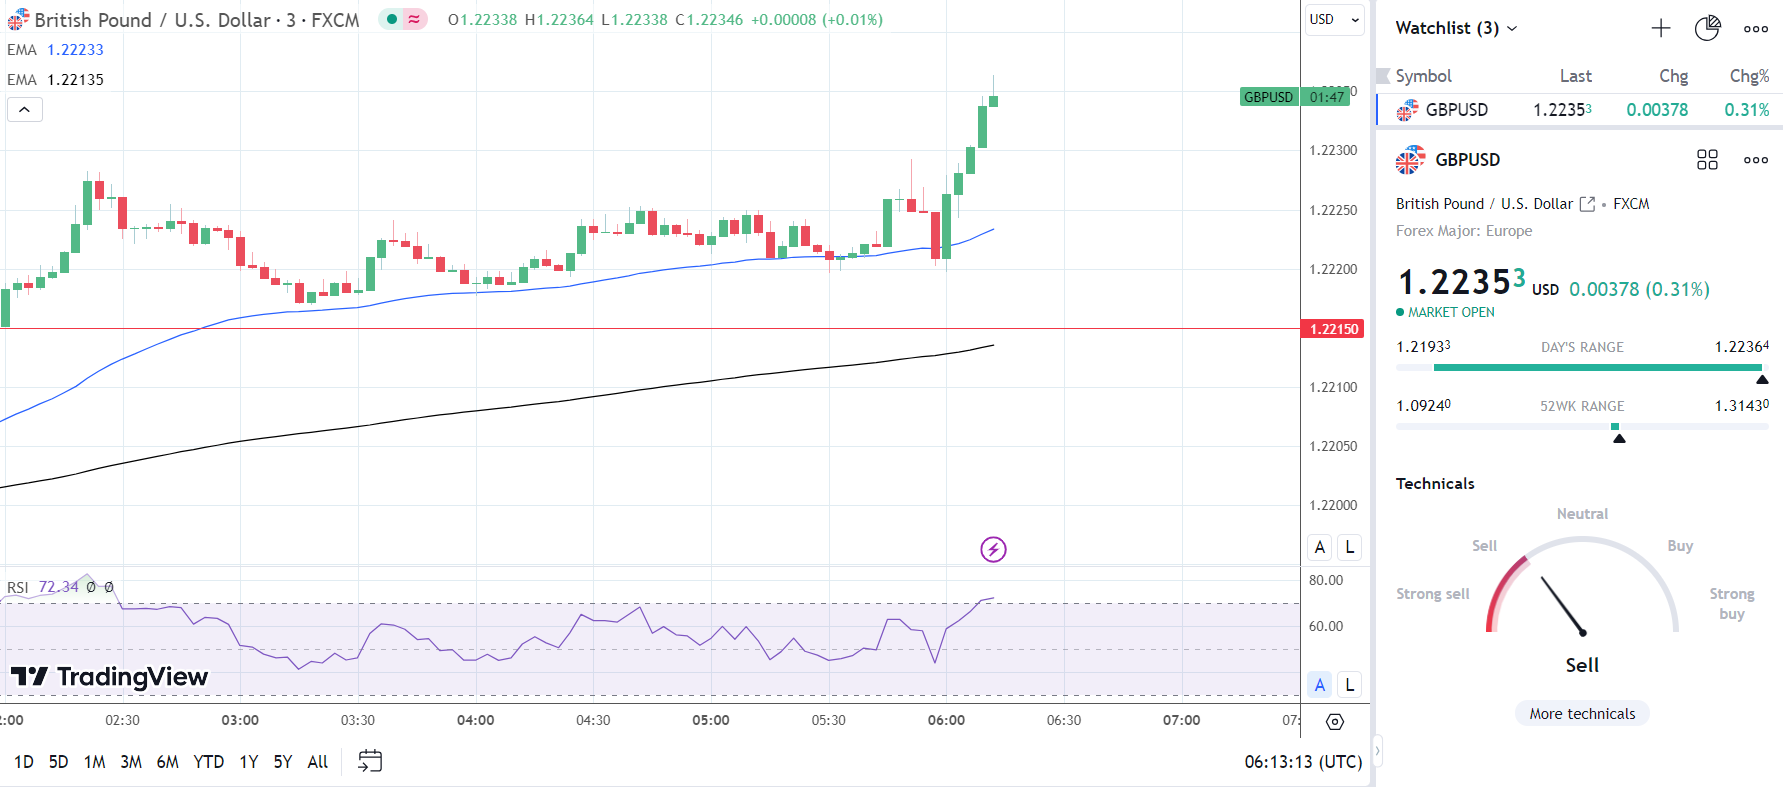
Before the UK GDP Report, the GBP/USD fell to a low of $1.21933 before rising to a pre-stat high of 1.22283.

However, in response to the UK GDP Report, the GBP/USD slipped to a post-stat low of $1.22197 before reaching a high of $1.22364.

This morning, the GBP/USD was up 0.31% to $1.22353.

GBP/USD bounces on UK GDP Report.
290923 GBPUSD 3 Minite Chart

Up Next: The US Personal Income & Overlays

Later today, US inflation and personal spending will likely influence investor sentiment toward the Fed rate path.

Softer-than-forecasted Core PCE Price Index and personal spending figures may ease bets on further Fed rate hikes. However, an upward swing in personal income could signal a positive outlook on consumption.

Economists forecast the Core PCE Price Index to increase by 3.9% year-over-year in August versus 4.2% in July.

Significantly, economists predict personal spending to increase by 0.4% (July: +0.8%) and personal income to rise by 0.4% (July: +0.2%).

Australian Dollar Update: AUD/USD, AUD/JPY Soar but is There Enough Momentum to Sustain?

Australian Dollar Update: AUD/USD, AUD/JPY Soar but is There Enough Momentum to Sustain?

AUD/USD – Daily Chart

Recent performance in the Australian Dollar against the US Dollar and Japanese Yen is setting up an interesting technical landscape. On the daily chart below, AUD/USD surged on Thursday, leaving behind a Bullish Engulfing candlestick pattern. This can at times function as a reversal signal, but further confirmation from here is likely needed.

The pattern emerged as prices were unable to confirm a breakout under the 78.6% Fibonacci retracement level of 0.6382. On top of this, positive RSI divergence had been persisting, showing that downside momentum has been fading. As such, while early, there seems to be early indications of a reversal. But, confirmation is needed.

Keep a close eye on the 50-day Moving Average. The latter may hold as resistance, pivoting prices lower. Otherwise, breaking lower opens the door to facing the November low of 0.6272.

image1.png

AUD/JPY – Daily Chart

Meanwhile, the Australian Dollar is also pushing higher against the Japanese Yen. Not long ago, AUD/JPY confirmed a breakout above a Symmetrical Triangle chart formation. That opened the door to extending the dominant uptrend since earlier this year.

Now, prices are facing the 14.6% Fibonacci retracement level at 95.97 as immediate resistance. Negative RSI divergence is present though, showing that upside momentum is fading. That can precede a turn lower.

Such an outcome would place the focus on immediate support, which seems to be the 23.6% level at 94.93. Otherwise, continuing higher places the focus on revisiting the current 2023 peak of 97.67.

image2.png


EUR/GBP IG Client Sentiment: Our data shows traders are now net-long EUR/GBP for the first time since Sep 21, 2023 10:00 GMT when EUR/GBP traded near 0.87.

EUR/GBP IG Client Sentiment: Our data shows traders are now net-long EUR/GBP for the first time since Sep 21, 2023 10:00 GMT when EUR/GBP traded near 0.87.

EUR/GBP: Retail trader data shows 50.15% of traders are net-long with the ratio of traders long to short at 1.01 to 1. In fact, traders have remained net-long since Sep 21 when EUR/GBP traded near 0.87, price has moved 0.20% lower since then. The number of traders net-long is 1.22% higher than yesterday and 9.21% higher from last week, while the number of traders net-short is 13.39% lower than yesterday and 7.82% lower from last week.

We typically take a contrarian view to crowd sentiment, and the fact traders are net-long suggests EUR/GBP prices may continue to fall.

Our data shows traders are now net-long EUR/GBP for the first time since Sep 21, 2023 10:00 GMT when EUR/GBP traded near 0.87. Traders are further net-long than yesterday and last week, and the combination of current sentiment and recent changes gives us a stronger EUR/GBP-bearish contrarian trading bias.

Asia Day Ahead: Gold at March 2023 low, USD/JPY Hovers Below Key 150.00 Level

Asia Day Ahead: Gold at March 2023 low, USD/JPY Hovers Below Key 150.00 Level

A slight breather in the Treasury yields rally allowed Wall Street to turn in a positive session overnight, while VIX retraced for the second straight day after nearing its key psychological 20 level, which are generally looked upon as the divide between stable or more stressful periods. The rate-sensitive Nasdaq 100 index found room for greater relief (+0.8%) and if it manages to close at or above the current level today, that could help form a weekly bullish pin bar to kickstart next week.

Overnight, the final read for US 2Q gross domestic product (GDP) offered mixed views. A significant downward revision in consumer spending (0.8% vs previous 1.7%) may question how far the current economic resilience may last, but at least for now, the weakness was masked by an upward revision to business fixed investment (7.4% vs previous 6.1%). Overall, that supported a still-resilient 2Q growth expansion of 2.1%, in line with expectations.

Ahead, the US PCE price index data will be on watch, which is expected to display stronger growth in headline inflation (3.5% vs previous 3.3%), but further moderation in the core aspect (3.9% vs previous 4.2%). If it turns out as expected, this may mark a new low in core PCE inflation since October 2021 and provides some validation for current rate expectations that the Fed may not follow through with its last rate hike in November/December.

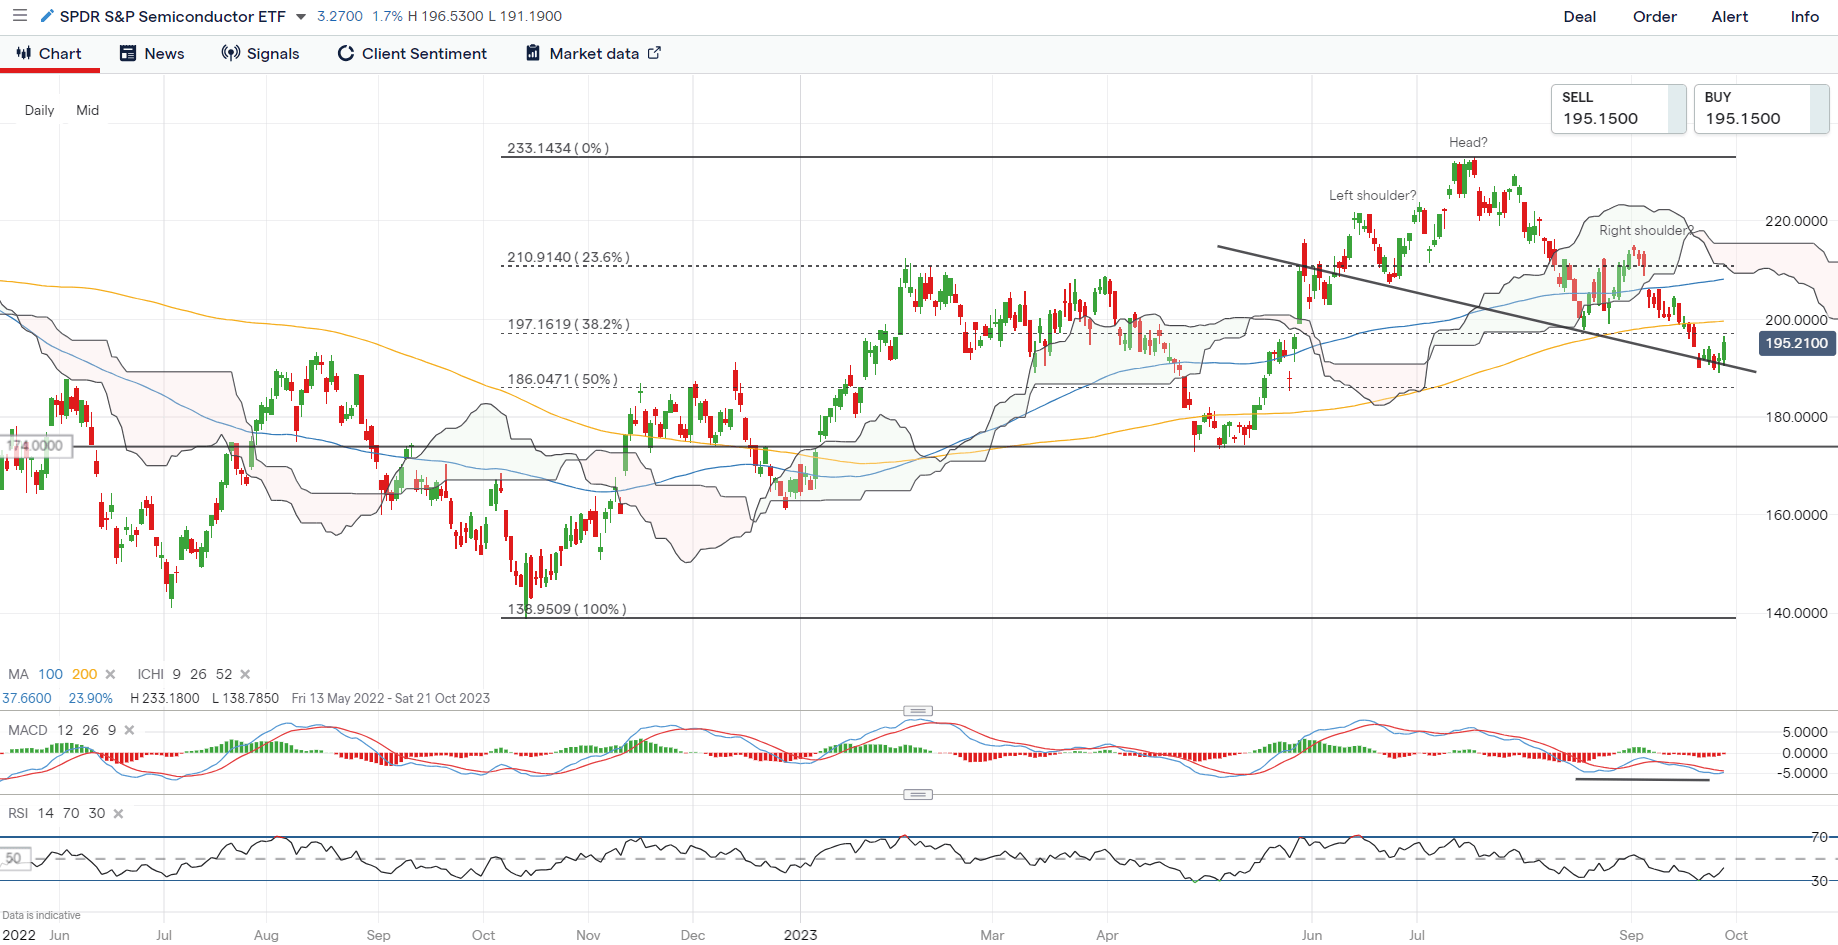
One to watch may be the SPDR S&P Semiconductor ETF, which managed to defend the neckline of a head-and-shoulder formation on the daily chart, while its daily Moving Average Convergence/Divergence (MACD) is attempting for a bullish crossover. A series of resistance still lies ahead for the sector to overcome, with the daily Relative Strength Index (RSI) still trading below the 50 level as an indication of sellers in control. On the upside, immediate resistance may stand at the 200.00 level, while any failure to defend the neckline may pave the way to retest the 174.00 level next.

image1.png

Asia Open

Asian stocks look set for a slight positive open, with Nikkei +0.02%, ASX +0.28% and NZX +0.45% at the time of writing. Given that several markets are closed for holiday today (China and Taiwan closed for Mid-Autumn Festival, South Korea closed for Chuseok), overall sentiments could be more subdued, despite lower bond yields and a weaker US dollar providing room for some near-term relief.

Economic data this morning saw a lower-than-expected core consumer price index (CPI) read in Tokyo (2.5% vs 2.6% forecast), which is generally looked upon as a precursor to the nationwide inflation number. Tokyo’s headline inflation has also turned in softer at 2.8% from previous 2.9%, registering its lowest level since September 2022. The still-declining growth trend in core inflation may not provide the conviction for the Bank of Japan’s (BoJ) ‘sustainable 2% inflation’ condition for a policy pivot just yet, although rate expectations remain firm that the central bank may be forced to abandon its negative interest rate policy in 1Q 2024.

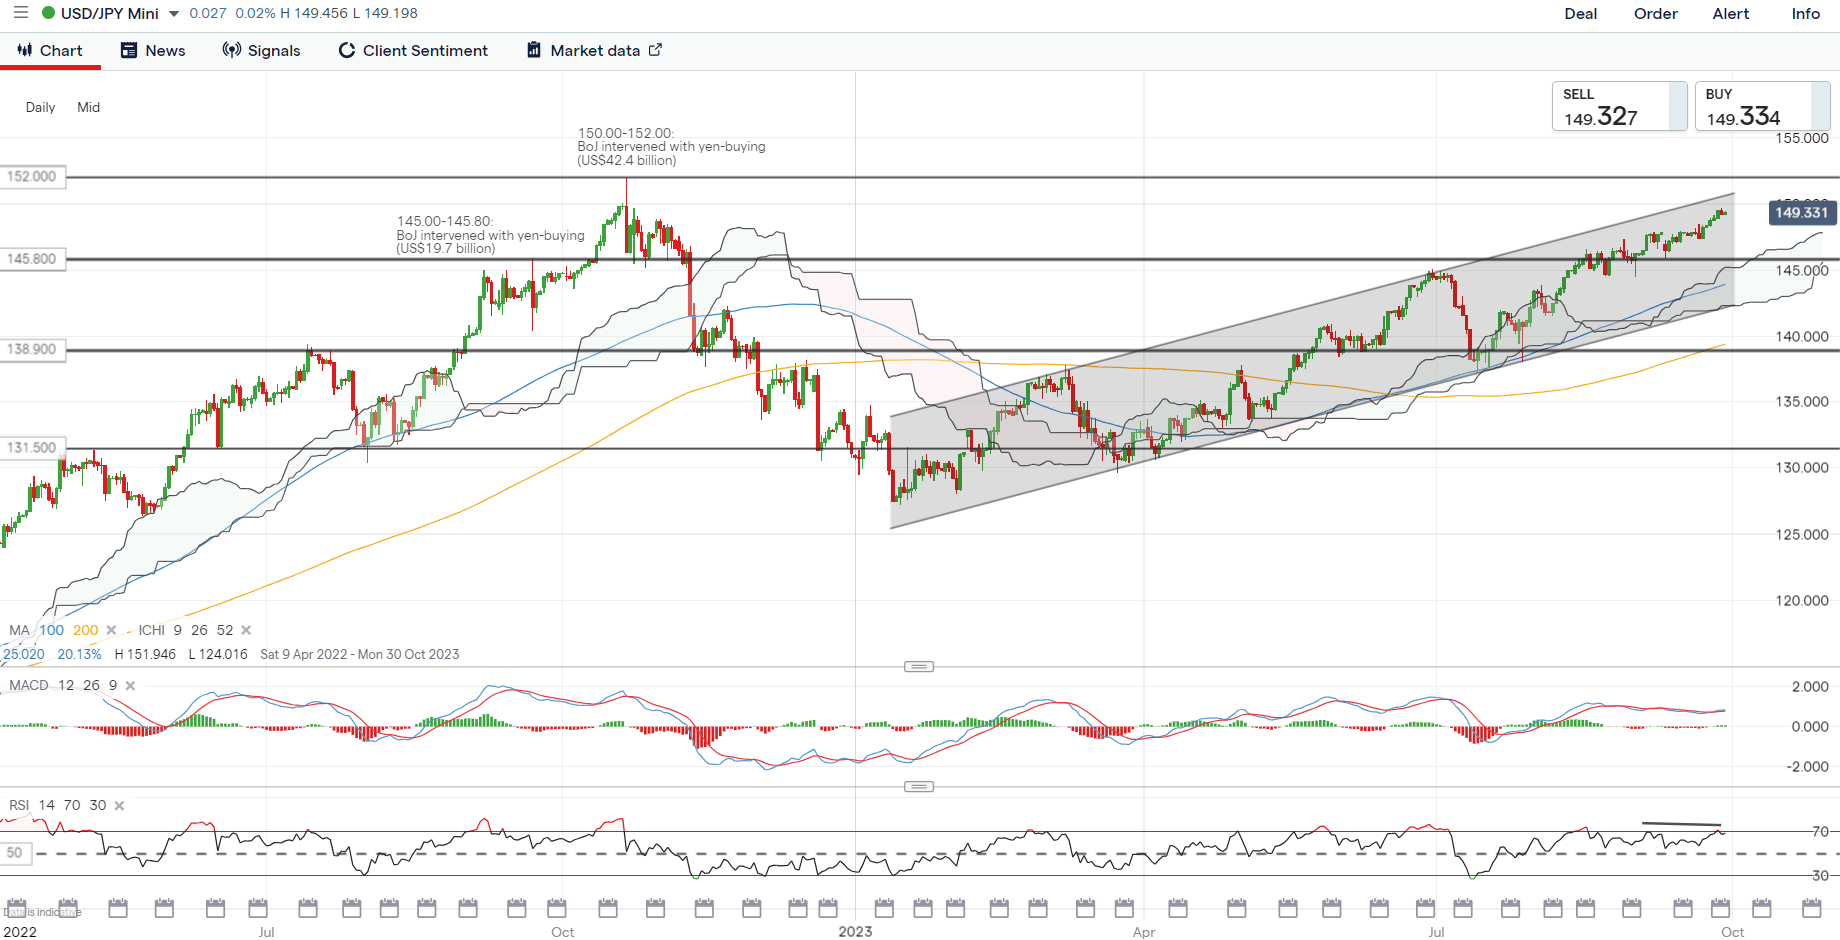
The USD/JPY continues to trade within an upward channel pattern for now, supported by widening US-Japan bond yield differentials in light of the ongoing policy divergence between both central banks. But as the pair nears the key psychological 150.00 level, which marked the Japanese authorities’ intervention efforts back in October 2022, market watchers has grown more wary that they may pull the trigger once more, with the heavy net-short positioning in Japanese yen speculative bets potentially accelerating any move to the downside for the USD/JPY. The 150.00 level remains a key resistance to overcome, while on the downside, the 148.00 may serve as immediate support to hold, followed by the 145.80 level.

image2.png

On the watchlist: Gold prices at March 2023 low

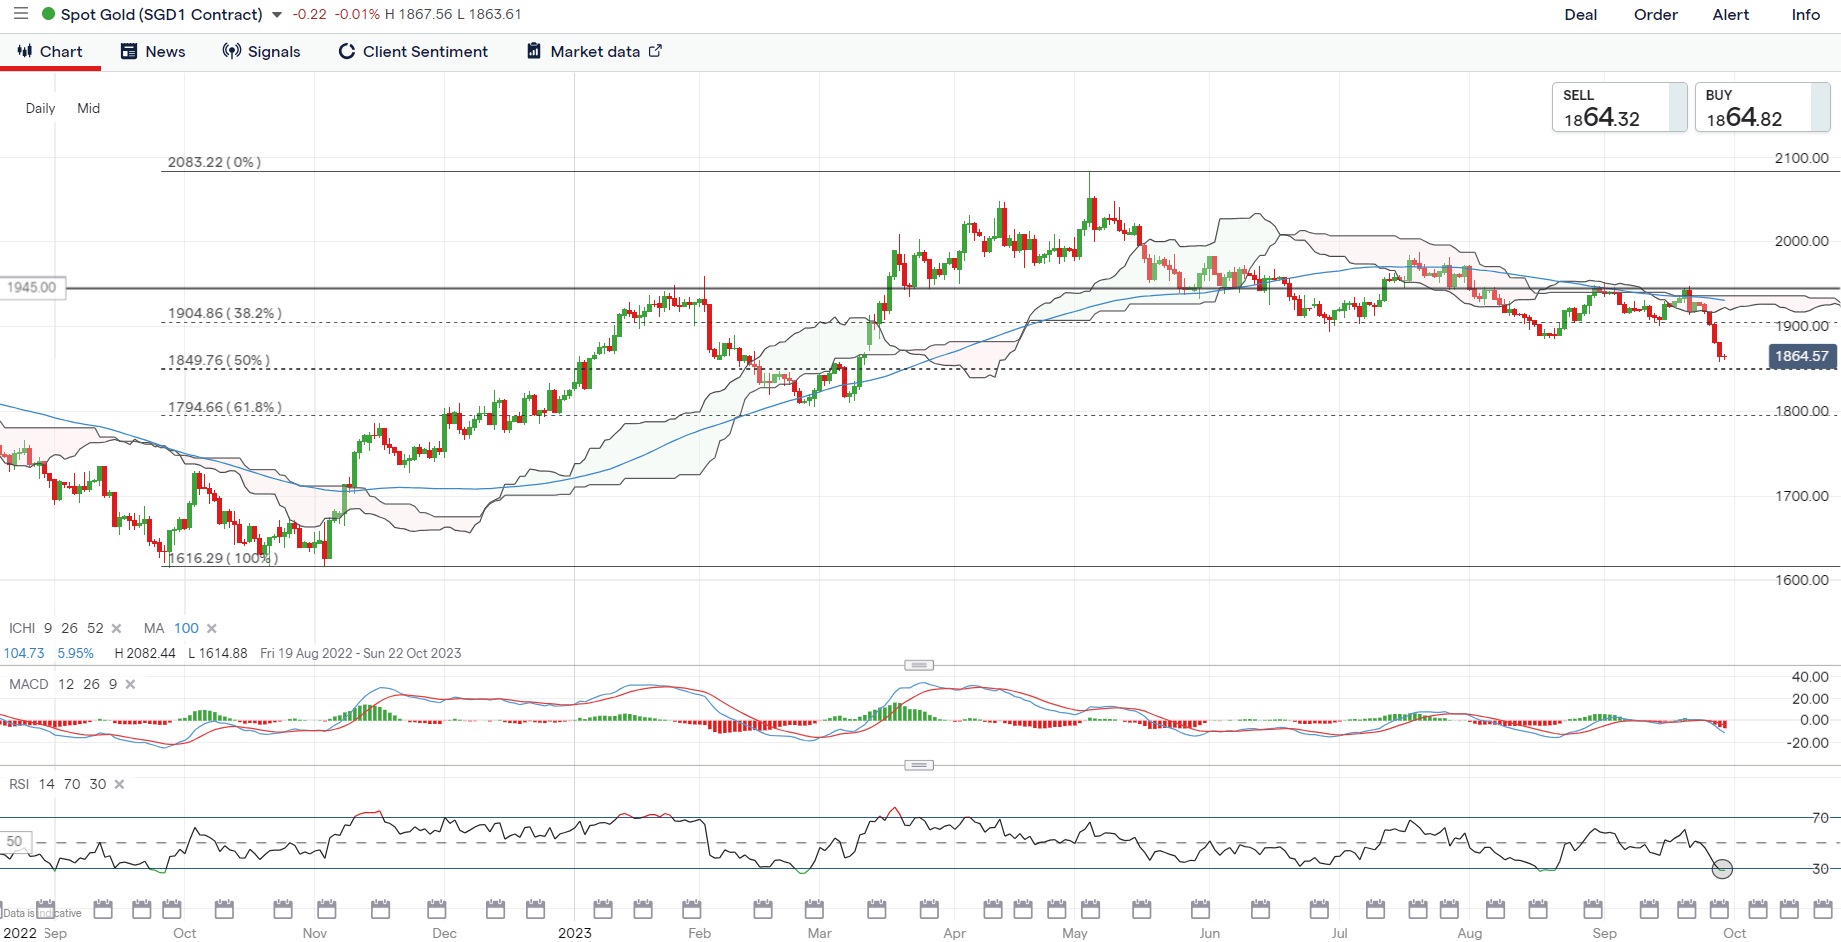
Despite some cooling in the US Treasury yields rally and a weaker US dollar overnight, gold prices did not manage to gain much traction overnight, hovering around its lowest level since March 2023. Near-term technical conditions in oversold levels may translate to an attempt to stabilise ahead, but the broader trend remains downward bias, given the formation of lower highs and lower lows since May 2023.

To reinforce sellers in broader control for now, its weekly RSI continues to trade below the 50 level. Any relief may leave the resistance level at the US$1,900 level on watch for buyers to overcome, with more conviction for buyers potentially having to come from a move back above its 100-day MA.

image3.png

How Do the US Dollar, Gold, S&P 500, and More Trade at the Onset of Recessions?

How Do the US Dollar, Gold, S&P 500, and More Trade at the Onset of Recessions?

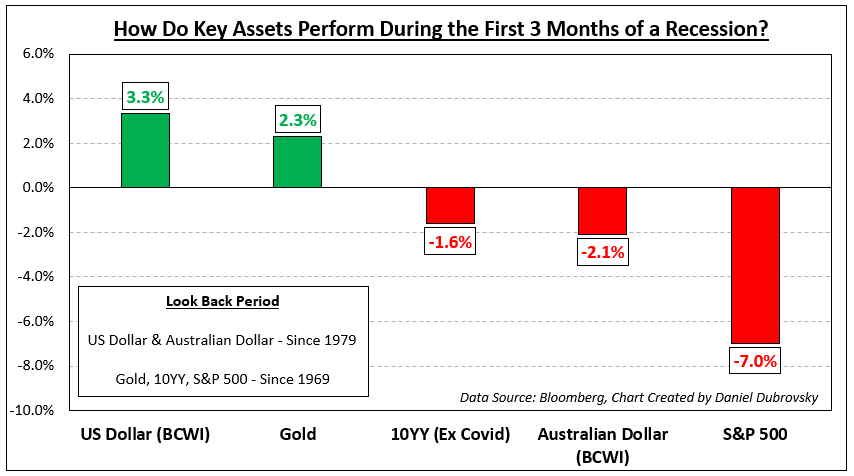
The onset of recessions in the United States typically results in reoccurring financial market trading patterns. While not all of them will be the same, we can look back and see how key assets have performed. This is a special report that analyzes how the US Dollar, gold, S&P 500, Australian Dollar and 10-year Treasury yield traded during the first 3 months of economic downturns.

The length and severity of each recession will vary. This means the usual reaction you might expect from an asset during the onset of a downturn will not always repeat perfectly. For example, during the 2000s housing crash, the US entered a recession in Q4 of 2007. While the stock market declined during these 3 months as one might have expected, peak market volatility occurred much later towards the end of 2008.

Before diving into this topic, I need to set the ground rules, starting with the definition of a recession. In this study, I will be using a GDP-based recession indicator, which attempts to assign dates to downturns based on a mathematical model. This is as opposed to the NBER’s Business Cycle Dating Committee playbook, which can at times be subjective. You can learn more about the indicator I am referencing here.

This definition is also different from the widely referenced two consecutive quarters of negative growth, which is unofficial and often too simplistic, failing to capture other economic trends. For example, in 2022, the economy experienced 2 quarters of negative growth in Q1 and Q2. But, the labor market outperformed.

For analyzing the US and Australian Dollars, I will be using a correlation-weighted currency index instead of an exchange rate. This helps us capture the broader direction of a currency against the world rather than any individual unit. Otherwise, comparing AUD/USD with the DXY Dollar Index runs the risk of placing too much emphasis on the greenback.

Average Snapshot

The chart below is a snapshot of how these assets performed during the onset of recessions ordered from best performing to the worst. The sequence is as follows: US Dollar, gold, 10-year Treasury yield, Australian Dollar and S&P 500. The availability of currency data meant I could only look back to 1979. For the rest of the assets, I was able to look back to 1969. The remainder of this article breaks down the individual performance beginning with the US Dollar.

Average Snapshot

US Dollar

Looking back to recessions since 1979, which adds up to 6, the Bloomberg Correlation-Weighted US Dollar Index rose 3.3% on average in the first 3 months of economic downturns. That is not to say each time it climbed. The up/down ratio is 50%. But, as you can see in the chart below, when the dollar rallies, it tends to do so strongly. During periods when the currency fell, the downside reaction was much weaker. This should come as little surprise. In the currency spectrum, the US Dollar functions as a haven given its status as the world’s reserve currency.

US Dollar

Gold

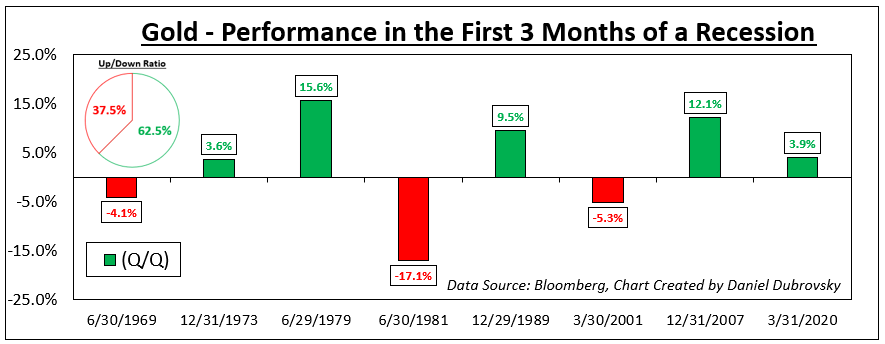
Meanwhile, gold also tends to perform decently at the onset of recessions going back to 1969. On average, the yellow metal returned +2.3% with a win/loss ratio of about 62.5%. Like the US Dollar, the wins were stronger than your average losses, excluding the early 1980s recession (-17.1%). Does this make gold a haven? Remember that gold is not as liquid as a currency. XAU/USD tends to function as an anti-fiat instrument. When the return on cash dwindles, which is what usually happens during recessions, gold becomes relatively more attractive and vice versa.

Gold

10-Year Treasury Yield

From this point forward, we are moving on to assets that underperform. Since 1969, the 10-year Treasury yield has declined by -1.6% on average during the onset of recessions (excluding Covid, which was a major negative outlier that skews the mean). Factoring in Covid though, the up/down ratio is about 29%. Bonds tend to receive a high amount of demand during economic uncertainty due to perceived safety, pushing up the price at the cost of yields.

10-Year Treasury Yield

Australian Dollar

Looking at the Bloomberg Correlation-Weighted Australian Dollar Index, the Aussie returned on average -2.1% during the first 3 months of a US recession since 1979. AUD also has a depressingly low win/loss rate of 16.7%. In currency markets, the Aussie is known for its sentiment-linked status, often closely following equities. Australia’s economy is closely tied to the global business cycle due to commodity exports, making it important to watch growth in the United States. When the latter sneezes, the world can catch a cold, driving up market volatility and negatively impacting the Australian Dollar.

Australian Dollar

S&P 500

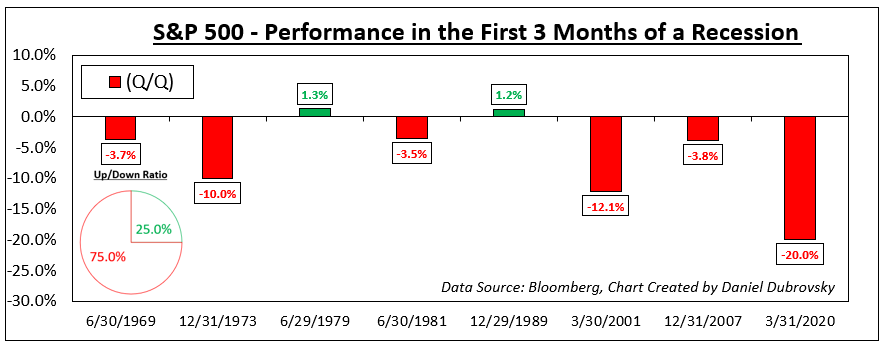
Finally, we arrive at the S&P 500, which is one of the key US benchmark stock indices. Unsurprisingly, the S&P 500 has returned on average -7.0% at the onset of recessions since 1969. But, unlike the Australian Dollar, the win/loss ratio is slightly better at 25%. This is unsurprising. Depending on the severity of the recession, uncertainty plays a key role in how much the stock market declines and how fast it does.

Recessions raise the risk that companies can go out of business and/or lay off workers, resulting in stock market crashes. Often, a bubble popping can lead to a recession, such as the dotcom bust in the early 2000s and the housing market leading in 2008. There are also leading indicators of a recession that you might be interested to learn about.

S&P 500


The Federal Reserve Bank: A Forex Trader’s Guide

The Federal Reserve Bank: A Forex Trader’s Guide

What is the Federal Reserve?

The Federal Reserve is the central bank of the United States. It was founded to create a stable, flexible monetary and financial system for the nation. Its general duties are to set monetary policy and oversee effective economic operation, ultimately serving the public interest.

To meet these top-level directives, the Fed performs five general functions:

  1. Promote maximum employment, stable pricing and moderate interest rates long term
  2. Reduce risk where possible to create a stable financial system
  3. Develop safety within financial institutions
  4. Champion safety within payment and settlement systems
  5. Advocate consumer protection through a supervisory stance.

To execute day-to-day operations, the nation is divided up into 12 Federal Reserve Districts, each of which is served by a separately incorporated Reserve Bank. These districts and member banks operate independently while being supervised by the Federal Reserve Board of Governors.

Who owns the Fed?

The Fed is both a private and public institution. The Board of Governors is a government agency, while the banks themselves are structured like private corporations – member banks hold stock and earn dividends.

Who is the Federal Reserve chairman?

As of August 2019, the chairman of the Federal Reserve is Jerome Powell, who has served in this office since February 5, 2018. He is the 16th person to have held the position and will serve a four-year term. Before his appointment, Mr Powell served as a member of the Board of Governors from May 25, 2012. He also currently serves as Chairman of the Federal Open Market Committee, which looks after monetary policy.

Which banks make up the Fed?

The 12 Federal Reserve Districts, each with their own Reserve Bank, are:

  • Boston
  • New York
  • Philadelphia
  • Cleveland
  • Richmond
  • Atlanta
  • Chicago
  • St. Louis
  • Minneapolis
  • Kansas
  • Dallas
  • San Francisco

How is the Fed held accountable to its functions?

The Fed is accountable to the public, as well as to the US Congress. The Chair and Federal Reserve officials testify in front of Congress, while the system of setting monetary policy is designed to be clear and transparent. In the interests of accountability, the Federal Open Market Committee (FOMC) will publish statements following all annual meetings. All financial statements are audited independently once a year to ensure financial accountability as well.

Key Economic Mandates of the Federal Reserve System

US monetary policy is the core mandate of the Federal Reserve bank. The statutory objectives of this monetary policy are outlined by the Congress and are:

  • Maximum employment: The monetary policy set out by theFOMC should ensure unemployment remains low, working to boost the economy where needed so that businesses thrive, make a profit and hire more staff to grow
  • Price stability: The Fed defines price stability as an inflation rate of 2% in the long term
  • Moderate long-term interest rates: This works alongside price stability – when an economy is stable, long-term interest rates remain at a moderate level

The Fed aims to achieve its monetary policy through its influence over interest rates and the general financial climate. This can lead to volatility of the US Dollar, ahead of Fed announcements and changes to policies.

Federal Open Market Committee

Monetary policy is set by the Federal Open Market Committee (FOMC), which oversees the open market operations of the Federal Reserve System. They set a target for the federal funds rate at FOMC meetings; this is the interest rate that they want banks to offer to each other for overnight loans. While the FOMC doesn’t control the rate, it can influence it in three main ways:

  • Open market operations. This means the buying and selling of government bonds on the open market – selling bonds decreases monetary supply with the aim of increasing interest rates. Buying bonds puts money back into the economy, with the aim of decreasing interest rates
  • Discount rate. This is the rate that banks pay to borrow money from the Fed. When this rate is lower, then it is also more likely the federal funds rate will be lower too
  • Reserve requirements. Banks need to hold a certain percentage of customers’ deposits to cover withdrawals – this is the reserve requirement. When these are raised, banks can’t loan as much money and must ask for higher interest rates. When lowered, banks can loan more money and ask for lower interest rates.

How Does the Federal Funds Rate Affect the US Dollar?

The Fed’s interest rate, also known as the Fed funds rate, is set by the Board of Governors of the Federal Reserve System. The current interest rate and the expectations of future interest rate changes can both affect the value of the US Dollar. If traders anticipate a change in interest rates based on announcements from the Board of Governors, this can cause the Dollar to appreciate or depreciate in value against other currencies.

This table sets out the way in which market expectations and rate changes can affect the value of the dollar:

Market expectations Actual Results Resulting FX Impact
Rate Hike Rate Hold Depreciation of currency
Rate Cut Rate Hold Appreciation of currency
Rate Hold Rate Hike Appreciation of currency
Rate Hold Rate Cut Depreciation of currency

Find out more about the impact of interest rates on the foreign exchange market.

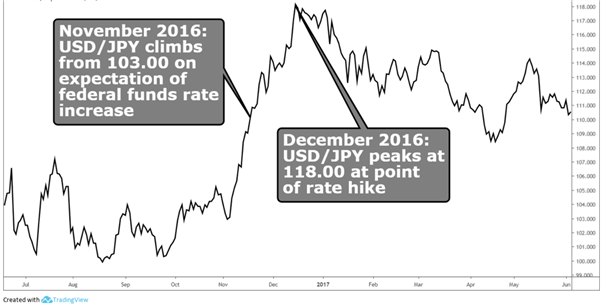
As you can see in the chart below, the Dollar strengthened against the Yen in the leadup to the Fed’s interest rate announcement in December 2016 because it was widely expected that the fed funds rate would increase. The pair peaked at around 118.371 on the day of the announcement, December 14, 2016.

USD/JPY chart before and after Fed hikes in 2016

Chart to show the impact of Fed hikes on USD/JPY

How to Trade the Fed Monetary Policy Decisions

In order to prepare for Fed rate change decisions, traders should follow these two key steps:

  1. Keep up with news from the Fed. The FOMC holds eight regular meetings a year, where policies and interest rates are discussed and agreed upon. Keeping up with news ahead of these meetings is the best way to make predictions about interest rates, and whether to buy or sell the US dollar
  2. Keep with news from the markets. Rest assured that it won’t just be you speculating on interest rates – ahead of Federal Reserve meetings and announcements, many forex traders will be watching what happens very closely. Keep an eye out for others’ predictions and forecasts, and stay well informed enough that you can have your own opinions and add your own logic to that of others

No method of predicting interest rate decisions can ever be completely accurate and surprises do occur. It’s always important to protect yourself when trading forex, so make sure you place stops in advance to ensure you keep your losses to a minimum should the markets move against you.

Remember to stick to your trading plan and never place a trade where you wouldn’t be able to afford the losses. Trades can go both ways. No matter how sure you feel that they will work in your favour, there’s always the chance that they might not.