Crude Oil Price Update: Last Week’s Pause Pushed Retail Traders to Add Upside Bets

Crude Oil Price Update: Last Week’s Pause Pushed Retail Traders to Add Upside Bets

Crude oil prices took a breather last week, leaving WTI little changed by Friday. This meant a pause after weeks of consistent gains. Recent data from IG Client Sentiment (IGCS) shows that there has been a cautious increase in upside exposure in crude oil. IGCS tends to function as a contrarian indicator, with that in mind, could oil aim lower in the near term?

Crude Oil Sentiment Outlook – Bearish

According to IGCS, only 36% of retail traders are net-long crude oil. Since most of them are biased to the downside, this continues to suggest that prices may rally down the road. That said, upside exposure has increased by 7.73% and 1.81% from the last trading day and one week ago, respectively. With that in mind, recent changes in positioning hint that prices might soon reverse lower ahead.

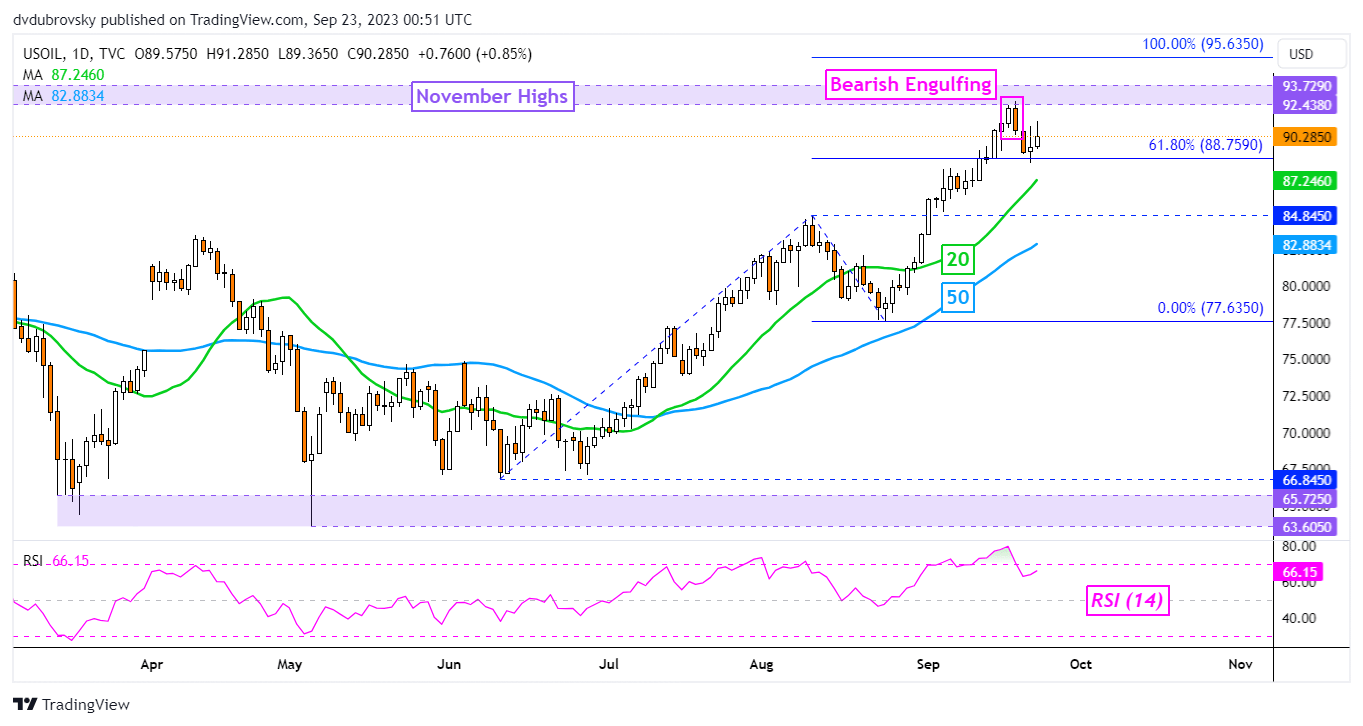
On the daily chart below, WTI has pushed higher over the past 48 hours (trading days). This is somewhat undermining the emergence of a Bearish Engulfing from last week. This followed a rejection of the 61.8% Fibonacci extension level of 88.75, where support was reinforced. As such, this is leaving a neutral technical setting in the very short term.

Key resistance is the 92.43 – 93.72 range, made up of highs from November. Meanwhile, the 20-day Moving Average is creeping higher. The latter may hold as support, maintaining the upside technical bias. Otherwise, a breakout below it subsequently places the focus on the 84.84 inflection zone.

 Crude Oil Daily Chart

image2.png


Asia Day Ahead: Risk mood remains cautious, USD/SGD at nine-month high

Asia Day Ahead: Risk mood remains cautious, USD/SGD at nine-month high

Major US indices attempted to bounce off their respective near-term support last Friday, but gains failed to sustain into the latter half of the session as selling pressures dominate. This came as the Federal Reserve’s (Fed) recent hawkish hold remains the overarching theme for the risk environment, which was further followed up by hawkish Fed officials’ comments to end the week. More notably, Governor Michelle Bowman, a Fed’s voting member, downplayed recent inflation progress and called for the need for additional rate hikes.

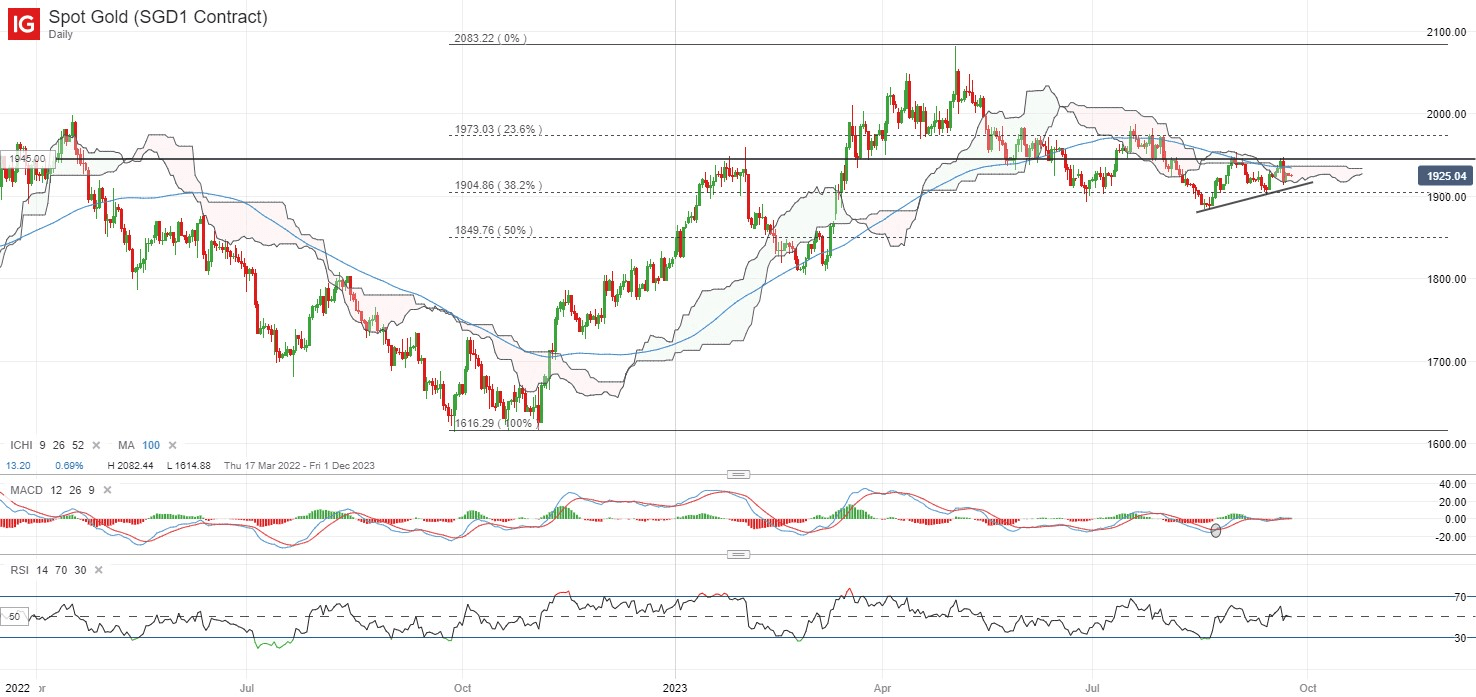
US Treasury yields remain elevated near their 16-year high, despite some cooling on Friday. That kept a lid on gold prices, which have been struggling to overcome a key resistance confluence at the US$1,945 level, where its 100-day moving average (MA) stands alongside its Ichimoku cloud on the daily chart. The formation of a near-term ascending triangle may still reflect buyers attempting to take back some control lately, but the US$1,900 level may have to see some defending ahead. Failure to do so may potentially open the door to retest the US$1,850 level next.

image1.png

Asia Open

Asian stocks look set for a subdued open, with Nikkei +0.13%, ASX -0.54% and KOSPI +0.02% at the time of writing. Despite the downbeat showing in Wall Street, Chinese equities have been resilient, with some dip-buying near key technical support. The Hang Seng Index was up 2.6% last Friday, after retesting its August 2023 low, while the Nasdaq Golden Dragon China Index was also up 2.9% – a divergence in performance from the US session. Profit-taking in outperforming markets, such as in US equities, may drive some potential rotation of capital into Chinese equities for now, where conditions have been far more undervalued while hopes are in place that recent positive economic surprise are reflecting early signs of policy success.

Singapore’s August inflation data will be on watch today. The core pricing pressures are expected to moderate for the fourth straight month to 3.5% from previous 3.8%, while headline inflation could soften to 4% from previous 4.1% as well. Alongside the recent decision from the Fed to keep rates on hold, these factors may allow the Monetary Authority of Singapore (MAS) to further extend its pause on monetary policy tightening at its October meeting, while keeping watch on ongoing economic risks. To recall, Singapore’s non-oil exports have fallen for an 11th straight month in August as a reflection of soft global demand.

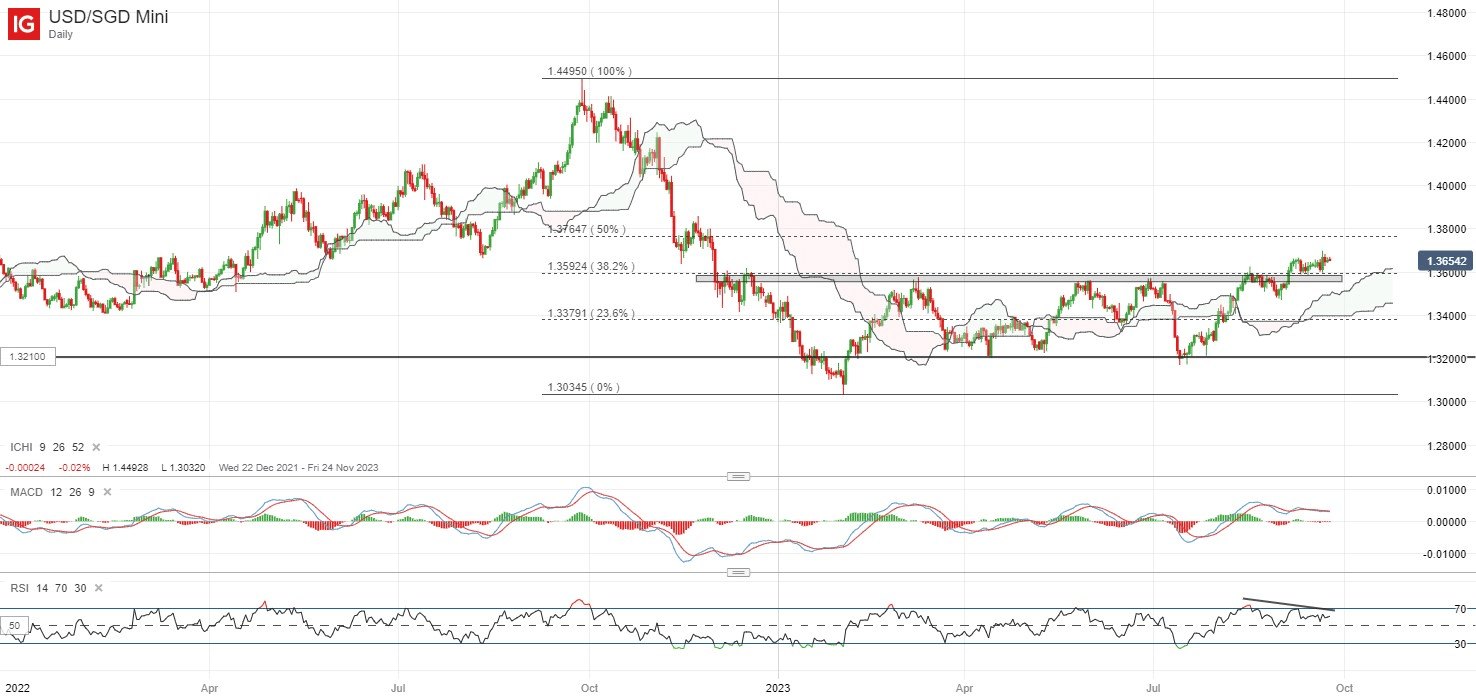
The USD/SGD has delivered a new nine-month high lately on US dollar strength, with the pair overcoming a key resistance at the 1.360 level, which marked the upper edge of a long-ranging pattern since the start of the year. Near-term lower highs on its RSI on the daily chart may point to some exhaustion for now, but the broader upward trend may stay intact as long as the 1.360 level holds. Any success in overcoming its recent tops at the 1.367 level may pave the way for further upside to retest the 1.380 level next.

image2.png

On the watchlist: Dovish takeaway from Bank of Japan (BoJ) meeting keeps USD/JPY at its 10-month high

Comments from the BoJ Governor on Friday have served as a pushback to recent hawkish bets, with patience in policy normalisation being the key takeaway from the BoJ meeting. Uncertainty over the economic outlook and wanting to see more on the ‘sustainable 2% inflation’ condition for a policy pivot are factors highlighted for more wait-and-see, at least for now, although rate expectations continue to price for an end to its negative interest rates in 1Q 2024.

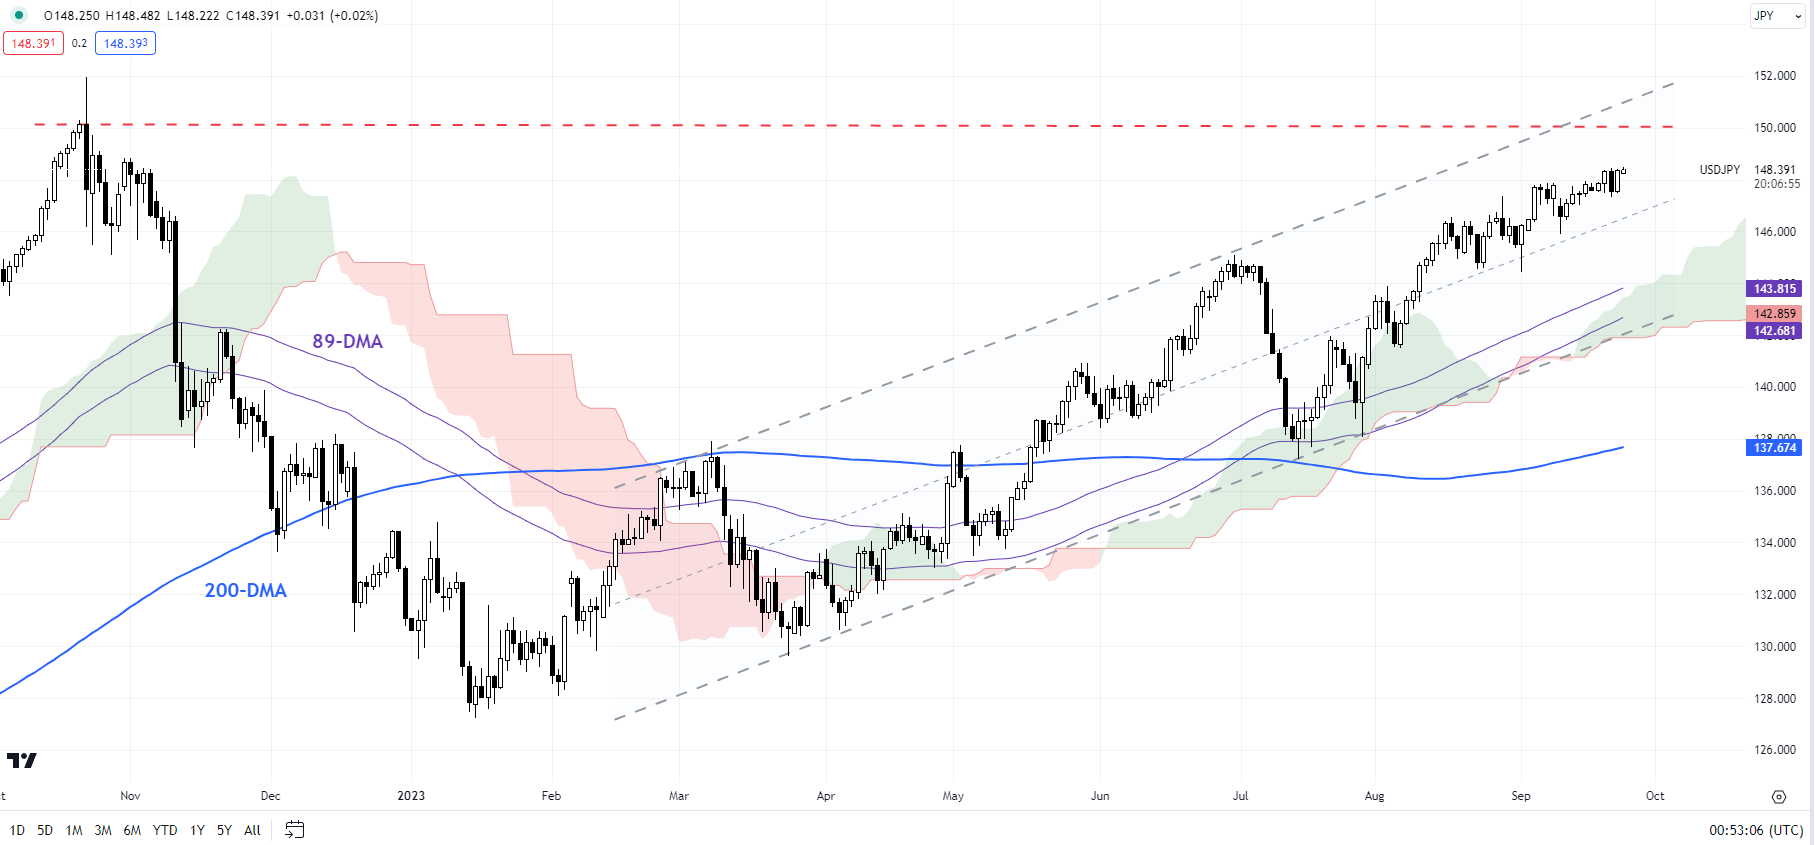
The USD/JPY has held firm at its 10-month high, as the Fed-BoJ policy divergence was reinforced. While the lower highs on the daily Relative Strength Index (RSI) may still point to some near-term exhaustion, the prevailing trend for USD/JPY remains upward-bias, with an ascending channel pattern in place since the start of the year. Further upside may leave the 150.00 level as a key resistance to overcome while on the downside, the 145.80 level will be an immediate support to defend for the bulls

Japanese Yen After BOJ: What Has Changed in USD/JPY, EUR/JPY, AUD/JPY?

Japanese Yen After BOJ: What Has Changed in USD/JPY, EUR/JPY, AUD/JPY?

The status quo by the Bank of Japan (BOJ) at its meeting last week reasserts the prevailing weakness in the Japanese yen.

JPY surrendered some of its gains after the Bank of Japan (BOJ) kept its ultra-loose policy settings intact at its meeting on Friday, in line with expectations. For more details, see “Japanese Yen Tumbles as BOJ Maintains Status Quo: USD/JPY Eyes 150,” published September 22.

BOJ’s persistent ultra-easy monetary policy diverges from its peers where central banks remain hawkish. Moreover, the broader growth outlook has converged, leaving little relative growth advantage to trigger a material appreciation in JPY. This suggests that unless the global central bank takes a step back from the hawkishness and/or BOJ steps up its hawkishness, the path of least resistance for the yen remains sideways to down. See “Japanese Yen’s Slide Pauses but for How Long? USD/JPY, EUR/JPY, MXN/JPY Price Setups,” published September 4.

In this regard, the key focus is on whether Japanese authorities intervene – USD/JPY is now in the band that triggered intervention in 2022. Skeptics argue that unless some of the currency drivers shift in favor of the yen, intervention could stall the bearish trend of the Japanese currency but may not be enough to reverse the course.

USD/JPY 240-Minute Chart

image1.png

C

Recommended by Manish Jaradi
Improve your trading with IG Client Sentiment Data
Get My Guide

USD/JPY: Upward momentum has slowed

On technical charts, USD/JPY appears to be struggling to extend gains. Despite that, USD/JPY continues to hold above vital support levels. For instance, on the 240-minute charts, USD/JPY has been trending above the 200-period moving average since July. A break below the moving average, which coincides with the mid-September low of 146.00 would be a warning sign that the two-month-long uptrend was changing. A fall below the early-September low of 144.50 would put the bullish bias at risk. On the upside, USD/JPY is approaching a stiff ceiling at the 2022 high of 152.00. Above 152.00, the next level to watch would be the 1990 high of 160.35.

EUR/JPY Daily Chart


image2.png

EUR/JPY: Rally stalls, but isn’t over

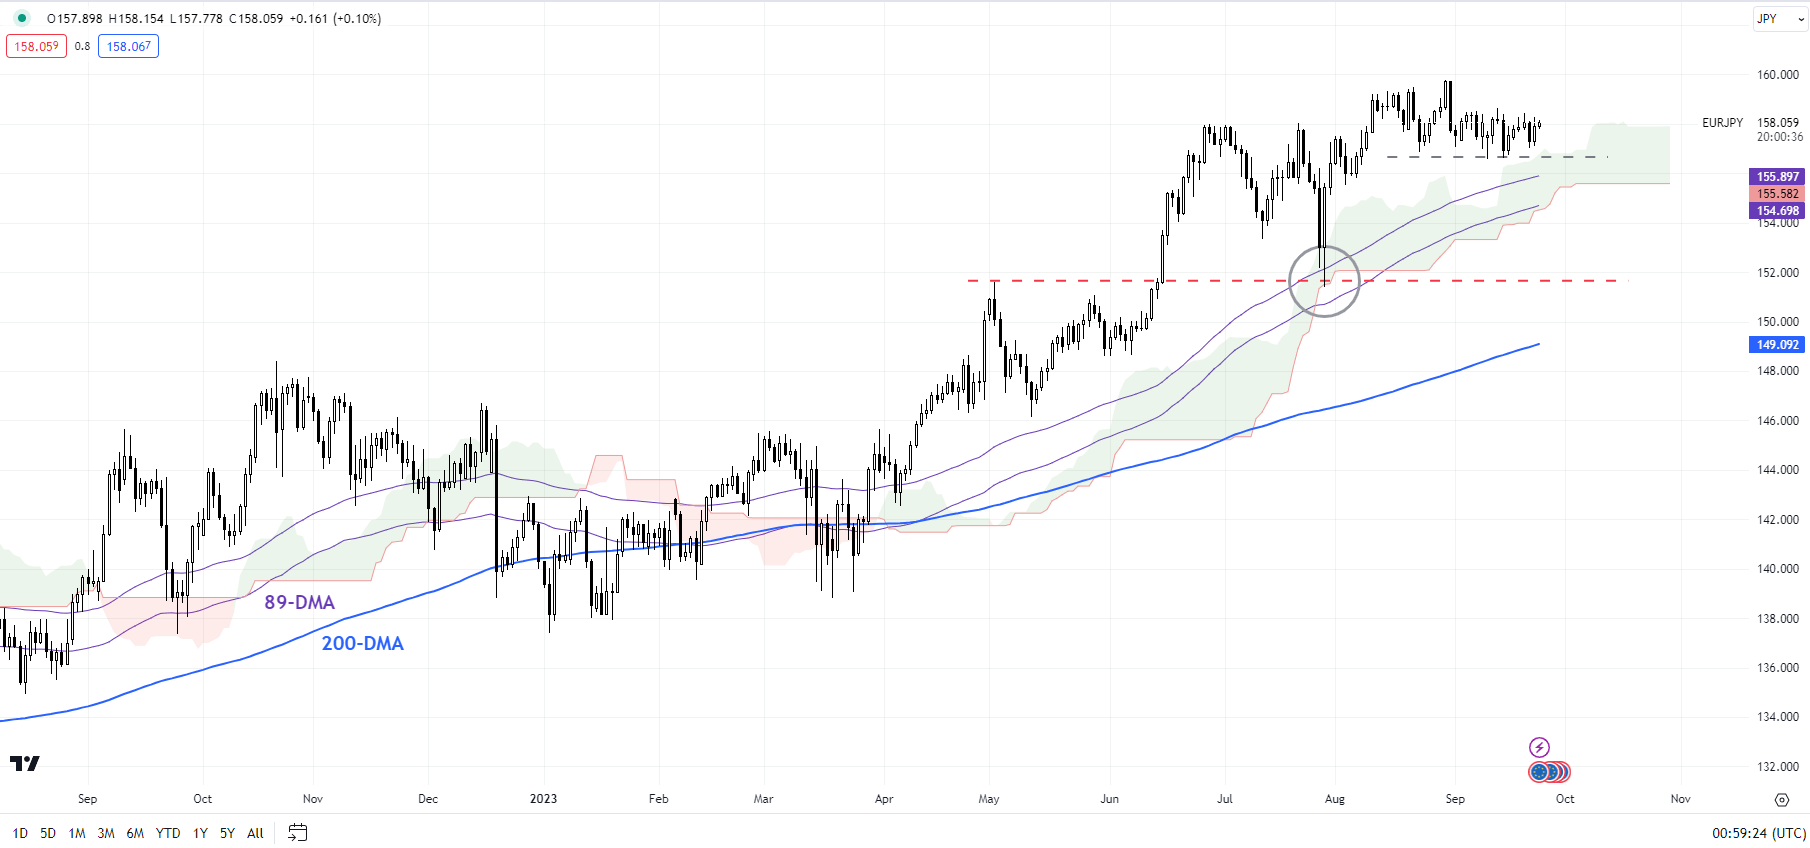
EUR/JPY rally has stalled in recent weeks. However, the evidence suggests the broader uptrend remains unaffected despite the consolidation for two reasons: the cross continues to hold above the Ichimoku cloud on the daily chart and the 89-day moving average, signaling that the trend remains up. Also, the cross hasn’t decisively broken any vital pivot support, including the June high and the late-August low (around 156.50-158.00).

AUD/JPY Daily Chart

image3.png

AUD/JPY: Beginning to flex muscles

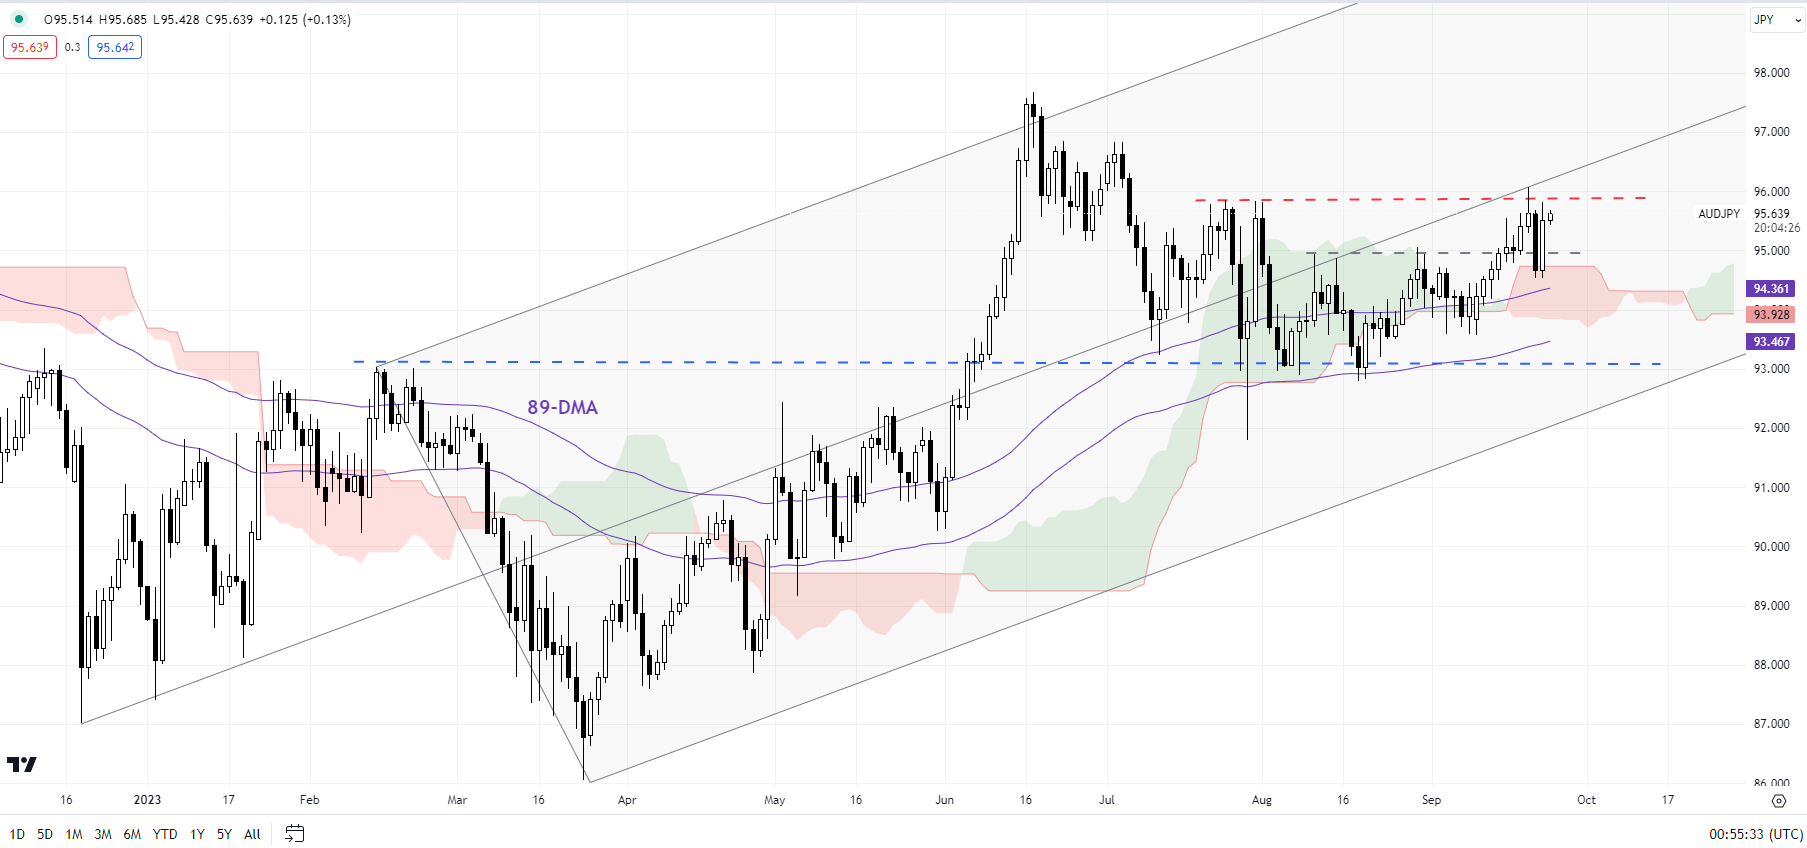
AUD/JPY’s break last week above a minor resistance on a horizontal trendline since August that came at 95.00 confirms that the immediate downward pressure has faded. This follows a rebound from strong converged support, including the 89-day moving average, the February high, and the lower edge of the Ichimoku cloud on the daily charts. Zooming out, despite the weakness since June, the cross continues to hold within a rising pitchfork channel since the end of 2022. Any break above the initial resistance at the July high of 95.85 could pave the way toward the June high of 97.70.

How to Short Sell a Stock When Trading Falling Markets

How to Short Sell a Stock When Trading Falling Markets

Shorting a stock involves selling a borrowed stock in the anticipation of buying the same stock back at a lower future price and pocketing the difference. Short selling is a normal part of an active trader’s plan as it presents traders with the ability to benefit from an advancing market and a declining one. This article makes use of examples to explain what short selling is, why it is important and lists the top things to consider when short selling stocks.

What is short selling and why do it?

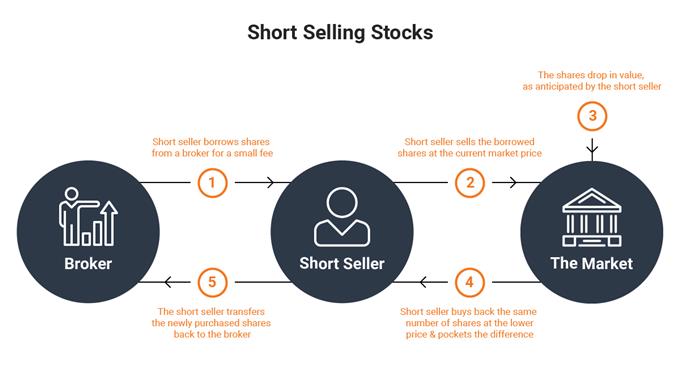
Short selling is the process of borrowing shares via a broker, selling those shares at the current market price and later buying the shares back at a lower price in order to return the shares to the broker.
How to short sell stocks

Why short stocks? The answer to this question is multi-layered but in general, shorting stocks presents an opportunity trade a decline in a share’s price.

To some, short selling seems rather unethical because you are essentially taking a stance that a company’s share price will fall, which could result in large scale retrenchments affecting many households in the process. To others, this represents an opportunity to speculate in on over-valued stocks or to benefit from the largescale selling of unscrupulous companies.

Nowadays, in addition to retail traders, there are well-established hedge funds that focus on short selling, or ‘shorting’ various companies. Some short sellers publish research on companies that are alleged to have reported misleading figures in the publication of financial statements or where there is sufficient evidence of corrupt business practices.

Before diving into the world of short selling, we recommend you review the stock market basics.

What does shorting a stock involve?

At this stage it may be helpful to differentiate between short selling stocks in the underlying market (non-leveraged) and shorting (selling or taking a short position) via a broker offering leverage.

The traditional approach has been set out above, where the short seller borrows shares from a broker, sells the shares and later buys the shares back at a discount to return to the broker.

However, the emergence of leverage trading has simplified this process to the point where shorting a stock is simply a matter of clicking the ‘sell’ button for the desired stock on an online platform.
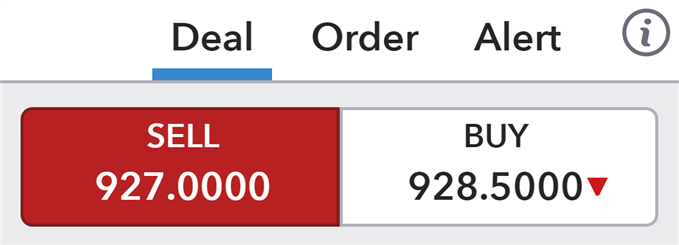
Deal ticket for shorting a stock

Shorting a stock in this way involves:

  1. A regulated broker: It is crucial to trade with a regulated broker offering little to no leverage.
  2. Liquidity/Borrow: In order to short a stock, the broker must have sufficient ‘borrow’. Borrow refers to having a pool of liquidity providers willing to lend the necessary shares to the broker for its internal hedging requirements. In the absence of borrow, brokers can no longer facilitate short selling and will disable the short selling function until sufficient borrow returns to the market. More liquid stocks tend to provide greater borrow than illiquid stocks.
  3. Set risk parameters: When there is sufficient borrow, carry out the necessary analysis, set stops and limits and hit the ‘sell’ button on the online platform.

How to short sell a stock

The following steps can be followed when shorting a stock:

  1. Select the desired market
  2. Confirm a down-trending market
  3. Predetermine stop losses and limits (risk-to-reward ratio)
  4. Enter the short trade
  5. The trade is complete once the stop or limit is hit

Traders can make use of the 200-day moving average or use trend lines to evaluate whether the stock is in a trending environment.

The short selling process can be made clearer by using actual figures in the form of a practical example.

Short selling example

Let’s say a short seller wishes to sell 10 shares of Apple Inc as he believes the share price is going to drop in the near future. If the price of Apple is $200 and the margin requirement is 50%, that means the trader would effectively be controlling $2000 ($200 x 10 shares) worth of Apple shares while only putting up $1000 ($2000 x 0.5) as margin.

The short seller sets the target at a price of $170 and a stop at $210 to establish a 1:3 risk-to-reward ratio. If price hits the target, the short seller could gain near $300 ($30 x 10 shares), minus any financing fees and commissions.

Nominal trade value = $2000

Margin = 50% ($1000)

Gain after taking profit = $300 ($30 x 10 shares)

Potential loss: $100 ($10 x 10 shares)

This example also presents the ideal scenario but financial markets are often unpredictable and do not move as reliably as presented here. It is for this reason that traders should adopt sound risk management practices from the outset.

Traits of Successful Traders

Traits of Successful Traders
Recommended by Richard Snow
Why do traders lose money? Don’t fall into this trap
Get My Guide

What are the risks when short selling stocks?

When learning how to short sell stocks it is crucial to keep the following in mind:

  • Potential for unlimited losses –Short positions without stops, theoretically have the potential for unlimited losses. There is no limit to the price of a share can rise to which further underscores the importance of stops.
  • Short squeeze –A short squeeze occurs when short traders witness a rise in price (contrary to what was expected) leading to losses that eventually force traders to buy (to close the trade) at a higher price and take a loss. Price gains more upward momentum as more short sellers buy to close their positions.

Below is an example of a short squeeze using the US 500 (S&P 500):
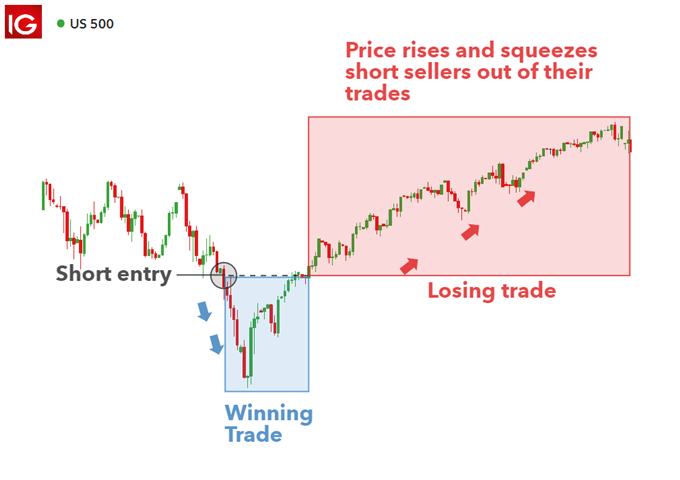
short squeeze when short selling

  • Unborrowable stock – In plummeting markets, even the most liquid shares can become unborrowable and therefore, prevent the opening of any new short positions. Traders need to keep this in mind but should also not allow this to force them into a rushed entry.

Short Selling Stocks: Key Takeaways

Shorting a stock has been made a lot easier with the advancements in technology and forms a part of a trader’s skillset. However, unlike the forex market, stock traders are faced with the unique problem of unborrowable stocks that prohibit any shorting of stocks. Traders should only consider initiating a short trade after conducting the necessary technical and/or fundamental analysis while adhering to sound risk management practices.

Understanding Defensive Stocks

Understanding Defensive Stocks

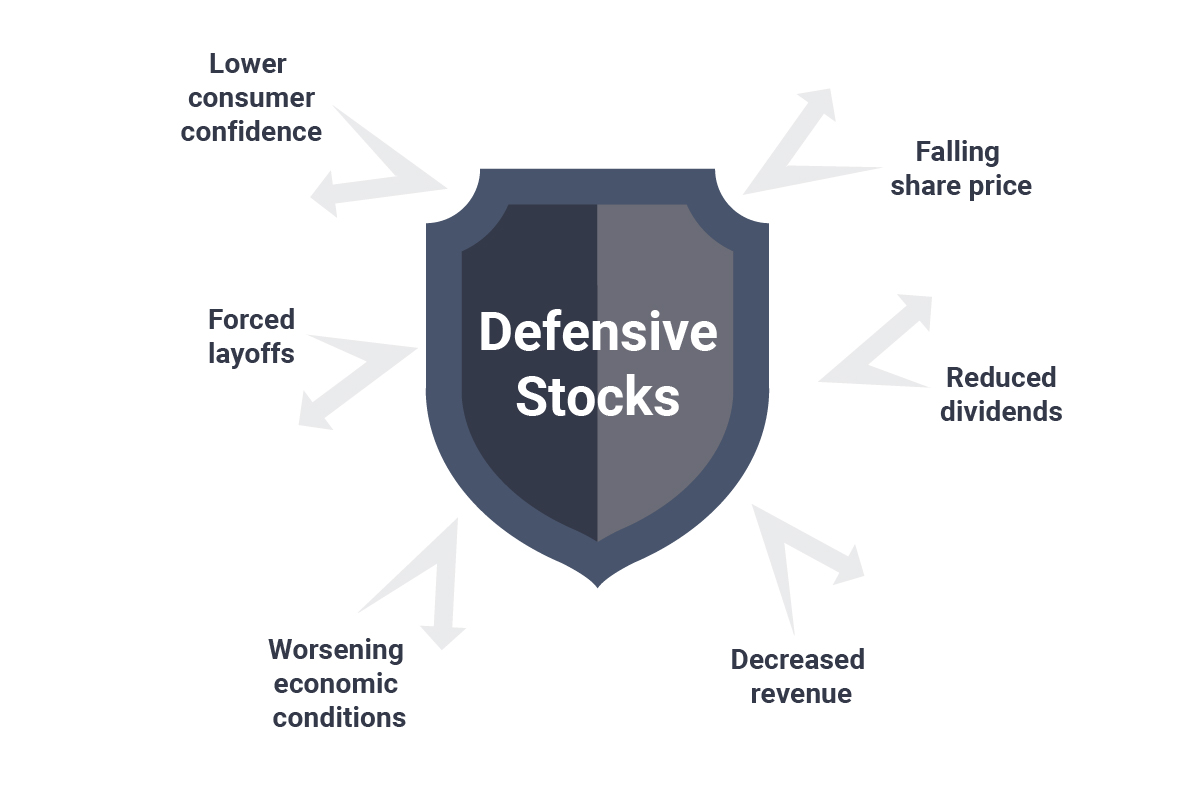
The word ‘defensive’ does not exactly appeal to most people looking for a stock in which to invest, but defensive stocks have proven critically important when navigating stock market volatility and more importantly, market crashes. Their biggest appeal is that they tend to shield investors during financial recessions or crashes as diversification reduces the correlation of investments held within a portfolio.

However, defensive stocks are not just useful during recessions; they can also appeal to traders with lower risk tolerances (i.e. looking for less volatility in their investments) simply looking to preserve their capital. This article explains what defensive stocks are, why they are useful and how traders or investors can benefit from trading them.

If you are new to stock trading, you may want to read about stock market basics, for an introduction into the world of stock trading.

What is a Defensive Stock

Defensive stocksDefensive stocks, also known as ‘non-cyclical stocks’ or ‘safe haven stocks’ comprise of companies that experience little variation in earnings and dividend payouts regardless of the state of the overall economy. Therefore, a defensive stock provides consistent dividends and stable earnings across market conditions. In general, this is because defensive stocks produce goods or services that are considered to be essential, meaning that the demand for these goods/services remain rather consistent.

It is important to note that holding defensive stocks provides no guarantee against negative returns; however, defensive stocks have historically weathered economic recessions better than cyclical stocks, which tend to track momentum of the underlying economy in the near-term.

What are the most defensive stocks

Defensive stock examples can be found within the utility, healthcare and consumer staples stock market sectors and generally exhibit the following characteristics:

  • Strong balance sheets – Companies that maintain a low debt to equity ratio are better equipped to meet their debt repayments under difficult market conditions.
  • Low beta – The ‘beta’ of a stock measures the correlation of the stock relative to the broader market. A beta close to 1 means that the stock performs similarly to the broader stock market and a low beta (close to 0) has less association with the broader market. Defensive stocks have beta values that are either close to 0 or have a negative beta.
  • P/E Ratio – A price-to-earnings ratio or P/E ratio, is a well-known formula used to value a stock. A P/E ratio can also help to identify a defensive stock as they generally have a low price/earnings ratio. Stocks with lower P/E ratios are often indicative of defensive stocks because investors are not forced to pay a premium to own a stock with massive earnings growth potential. Instead, the ratio is low because earnings growth is steady, or close to zero, justifying a lower price relative to earnings.

For a full list of safe haven stocks for each of the three stock market sectors, read our article on safe haven stocks.

Defensive stock example

The stock market affects the economy in many ways and none more so than a severe recession or market crash. Market crashes like the Global Financial Crisis in 2008/2009 result in mass retrenchments, forced liquidations of large companies and government bailouts for sectors that pose a systemic threat should they fail.

During times of economic turbulence, investors attempt to shield themselves from assets that are declining in value and some of the worst performing assets tend to be cyclical stocks – stocks that are strongly correlated to the underlying economy. However, defensive stocks have often outperformed the overall equity market during market crashes with their desirable non-cyclical qualities.

An effective way to illustrate the tendency of defensive stocks to outperform during times of turbulence is to compare the performance of a defensive stock to its broader equity market’s performance over the same timeframe. For defensive stocks traded in the United States, you’ll want to look at the relative performance compared to one of the major indices, the Dow Jones Industrial Average, the S&P 500, or the NASDAQ 100.Below is a chart of the S&P 500 during the 2008/09 financial crisis. It is clear to see that the US equity market, as a whole, experienced a drastic decline. The S&P 500, due to its components, has a large weighing in cyclical stocks that suffered tremendously during this time – driving the index lower.

S&P500 showing the decline in the US stock marketTo the contrary, Gilead Sciences, a biopharmaceutical company, managed to endure the financial crisis and come out at similar levels at whichit entered. Their share price rose sharply, dropped sharply and then consolidated to leave the share price a lot better off than most cyclical stocks. Intuitively, this makes sense: consumers will demand healthcare and drug treatments regardless of the state of the economy. To this end, biopharmaceutical and healthcare stocks tend to be defensive stocks as they are counter-cyclical in nature.

Gilead Sciences Inc outperforming the marketIt is crucial to note that defensive stocks do not necessarily rise in value during economic downturns. They may rise, hold value or even decline, nevertheless, they are desirable because they tend to outperform the wider stock market during crashes.

Other defensive assets

Thankfully defensive assets are not restricted to the equity market but expand to other markets such as the forex market, the commodity market and the bond market.

Safe-haven currencies:

US Dollar, Euro, Japanese Yen and Swiss Franc are often regarded as safe haven currencies because they tend to be negatively correlated with stocks during market crashes. In general, these defensive currencies have current account surpluses, strong financial systems, relatively low government debt to GDP, stable economic growth and sufficient liquidity among other desirable characteristics. It’s crucial to note that safe haven currencies won’t necessarily have all these characteristics but will certainly benefit from most of them.

Defensive commodities: Gold is universally recognized as a safe-haven metal because there will always be a demand for the metal (i.e. jewelry and some industrial uses) and its supply is naturally limited to the amount of gold that can be mined in all the earth. This is different to currencies because central banks can increase the supply of money via monetary policy which runs the risk of reducing the value of the currency through inflation. Of course, little needs to be said about gold’s special place in monetary affairs throughout human economic history.

US Government bonds:

When stocks fall, traders and investors often purchase US government bonds in an attempt to transfer funds from a risky asset to a more stable asset. Government bonds tend to be low return investment vehicles that are backed by the US government and are considered among the safest bonds in the world due to the strength of the US economy and stability of the US government.

Defensive stocks FAQ section

Are defensive stocks only beneficial during recessions?

While defensive stocks have historically outperformed cyclical stocks in recessions, they provide value in the good times too. Defensive stocks are relatively cheap allowing investors to snap them up at great prices when cyclical stocks are advancing. Furthermore, defensive stocks can provide an important benefit in diversifying a stock portfolio, even during economic booms.

NASDAQ 100, Dow Jones, S&P 500 News: A Rocky Path Amidst Rate Concerns, Shutdown Fears

NASDAQ 100, Dow Jones, S&P 500 News: A Rocky Path Amidst Rate Concerns, Shutdown Fears

The stock market is navigating through tumultuous waters, with futures pointing higher on Friday, but ominous clouds linger, threatening steep losses as the week concludes.

Dow Jones Industrial Average futures are making subtle gains, signaling a possible respite from the three-day losing streak that has plagued major stock averages, a response to the Federal Reserve’s signal of higher interest rates lingering on the horizon.

Trading Derivatives carries a high level of risk to your capital and you should only trade with money you can afford to lose. Trading Derivatives may not be suitable for all investors, so please ensure that you fully understand the risks involved, and seek independent advice if necessary. A Product Disclosure Statement (PDS) can be obtained either from this website or on request from our offices and should be considered before entering into a transaction with us. Raw Spread accounts offer spreads from 0.0 pips with a commission charge of USD $3.50 per 100k traded. Standard account offer spreads from 1 pips with no additional commission charges. Spreads on CFD indices start at 0.4 points. The information on this site is not directed at residents in any country or jurisdiction where such distribution or use would be contrary to local law or regulation.

However, the specter of a government shutdown, soaring bond yields, and looming rate hikes have cast a shadow over investor confidence, potentially heralding more losses as the month concludes.

At 12:20 GMT, the blue chip Dow Jones Industrial Average futures are trading 34394.00, up 57.00 or +0.17%. Benchmark S&P 500 futures and Nasdaq 100 futures climbed 0.31% and 0.54% respectively.

Interest Rates and Bond Yields

Market participants are keenly attuned to the Federal Reserve’s maneuverings, as it navigates the delicate balance of interest rates. Bond yields have surged, with the 10-year Treasury yield reaching its zenith since 2007, reflecting anticipations of an additional rate hike in 2023. The elevated levels of interest rates could potentially amplify pressure on risk assets like equities, impacting market dynamics and investor strategies significantly.

Market Performance and Concerns

Despite the cautious optimism reflected in the subtle rise in futures, the market is poised to witness its worst weekly performance since March, with the S&P 500 and Nasdaq Composite bearing the brunt of the losses. The potential government shutdown further complicates the intricate tapestry of market dynamics, potentially denting consumer confidence and decelerating economic momentum, as the prospect of higher rates for longer resonates through the financial landscape.

Companies in Focus

In this tumultuous financial climate, several companies are emerging into the limelight. British pharmaceutical giant AstraZeneca is reveling in positive results from a drug trial, leading to a surge in shares, while Chinese e-commerce behemoths like Alibaba and JD.com are benefiting from China’s contemplation to relax foreign investment caps. However, not all companies are enjoying a favorable trajectory, with Deere experiencing a dip after a downgrade, citing concerns over slowing growth in large agricultural equipment.

Market Outlook: Navigating Uncertain Waters

In the face of complex signals from financial entities and unfolding geopolitical events, the investment community treads carefully, seeking potential amidst the chaos. With prevailing apprehensions about looming interest rate escalations, potential government standstills, and global regulations, the market’s direction remains cautious.

Manufacturing PMI Remains In Contraction Territory

Manufacturing PMI Remains In Contraction Territory

On September 22, S&P Global released flash PMI reports for September. Manufacturing PMI increased from 47.9 in August to 48.9 in September, compared to analyst consensus of 48. Numbers below 50 show contraction.

Services PMI declined from 50.5 to 50.2, while analysts expected that it would increase to 50.6. Composite PMI decreased from 50.2 to 50.1 due to the slowdown of the services sector but remained in the positive territory.

S&P Global commented: “U.S. businesses signaled a broad stagnation in output at the end of the third quarter as manufacturers and service providers alike indicated muted demand conditions.”

According to S&P Global, September performance data showed the worst performance across the private sector since February.

Treasury yields have moved lower after the release of PMI reports. Bond traders take some profits off the table after the recent move. It remains to be seen whether Fed will be less hawkish due to PMI data.

U.S. Dollar Index moved away from session highs as traders reacted to the PMI reports. Profit-taking served as an additional negative catalyst for the American currency.

Gold settled above the $1925 level as traders focused on weaker dollar and falling Treasury yields.

SP500 is moving higher as some traders bet on a rebound after the strong pullback. It should be noted that the rebound is not strong, although PMI reports may provide additional support to stocks. At this point, weak economic data is bullish for stocks as Fed policy outlook is the key catalyst for markets.

Oil Prices Forecast: Russian Export Ban Elevates Global Oil Price Concerns

Oil Prices Forecast: Russian Export Ban Elevates Global Oil Price Concerns

Global Supply Concerns Drive Oil Prices Higher

Rising tensions have pushed oil prices higher as Russia’s ban on fuel exports raises alarms over tightening global supply. This comes even as apprehensions surrounding U.S. interest rate hikes that might impact demand linger.

Brent futures experienced a 0.5% climb to reach $93.80 a barrel, and U.S. West Texas Intermediate crude (WTI) futures saw a 0.7% increase, positioning at $90.26 a barrel. Despite this, the benchmarks are set for a marginal weekly fall after a robust gain of over 10% in the prior three weeks. A notable factor in this trend is the OPEC+’s decision to uphold production cuts.

Trading Derivatives carries a high level of risk to your capital and you should only trade with money you can afford to lose. Trading Derivatives may not be suitable for all investors, so please ensure that you fully understand the risks involved, and seek independent advice if necessary. A Product Disclosure Statement (PDS) can be obtained either from this website or on request from our offices and should be considered before entering into a transaction with us. Raw Spread accounts offer spreads from 0.0 pips with a commission charge of USD $3.50 per 100k traded. Standard account offer spreads from 1 pips with no additional commission charges. Spreads on CFD indices start at 0.4 points. The information on this site is not directed at residents in any country or jurisdiction where such distribution or use would be contrary to local law or regulation.

Monetary Policies and Oil Demand Worries

On the backdrop of the Russian fuel export ban, oil trade remains volatile. This uncertainty is a result of conflicting sentiments—supply anxieties due to the Russian move versus concerns about dwindling demand courtesy stricter monetary regimes in the U.S. and Europe.

With the U.S. Federal Reserve’s announcement to retain interest rates but assume a firmer hawkish stance, predictions indicate a rise to between 5.50-5.75% by the end of the year. This move stokes fears about hampered economic growth and the resulting reduced fuel demand. Moreover, with the U.S. dollar reaching its peak since early March, oil and similar commodities become pricier for those transacting in other currencies.

Central Banks’ Rate Stance

Not just the U.S. Federal Reserve, but the Bank of England also refrained from altering interest rates after a series of hikes. However, the Bank doesn’t seem complacent about the recent dip in inflation.

Meanwhile, a European Central Bank (ECB) governing council member hinted at the possibility of stable interest rates in their upcoming policy meeting. Norway stood out as its central bank not only hiked its benchmark rate but also hinted at another increase in December.

Outlook on Supply and Demand Dynamics

Amid the monetary policy shifts and geopolitical moves, oil prices have displayed resilience due to persistent concerns about the supply side. With global supply worries looming large, especially as we head into Q4, oil’s stronghold continues.

This sentiment is further cemented by the fact that U.S. crude stocks, particularly at Cushing (the WTI delivery hub), are at a historic low since July 2022, as OPEC+ remains firm on their production cut strategy.

Short-Term Forecast

Given the intricacies of central bank decisions, geopolitical tensions, and supply-side challenges, the short-term outlook for oil remains bullish. Traders and investors are advised to keep a keen eye on OPEC+ moves and monitor global monetary policy shifts to navigate this complex landscape.

Technical Analysis

4-Hour Light Crude Oil Futures

The current 4-hour price of $90.28 is slightly above the previous 4-hour price of $89.92, indicating a modest uptick. The price is well above the long-term 200-4H moving average of $84.41 but only slightly above the short-term 50-4H moving average of $89.82, suggesting an intermediate bullish stance. The 14-4H RSI stands at 52.65, denoting marginally strong momentum without being overbought.

As for support and resistance, the commodity price lies between the main support area of $84.89-$83.81 and the main resistance area of $90.10-$93.74. Given the positioning between these crucial levels and the RSI reading, the current market sentiment appears cautiously bullish.

DAX Index: PMI Focus as Services Sector Feels the Squeeze

DAX Index: PMI Focus as Services Sector Feels the Squeeze

DAX Thursday Overview

On Thursday, the DAX slid by 1.33%. Reversing a 0.75% gain from Wednesday, the DAX ended the day at 15,572.

Higher for Longer Theme to Set the Tone

The higher-for-longer interest rate outlook continued to push government bond yields higher.

Trading Derivatives carries a high level of risk to your capital and you should only trade with money you can afford to lose. Trading Derivatives may not be suitable for all investors, so please ensure that you fully understand the risks involved, and seek independent advice if necessary. A Product Disclosure Statement (PDS) can be obtained either from this website or on request from our offices and should be considered before entering into a transaction with us. Raw Spread accounts offer spreads from 0.0 pips with a commission charge of USD $3.50 per 100k traded. Standard account offer spreads from 1 pips with no additional commission charges. Spreads on CFD indices start at 0.4 points. The information on this site is not directed at residents in any country or jurisdiction where such distribution or use would be contrary to local law or regulation.

While central banks enter the ‘pause phase,’ the higher for longer mantra has erased hope for a more accommodative policy outlook.

Eurozone Consumer Confidence reflected expectations of elevated interest rates amidst a deteriorating macroeconomic environment. The Eurozone consumer confidence index fell from -16.0 to -17.8.

US Jobless Claims Spooks Investors

US jobless claims fell from 221k to 201k, according to figures out on Thursday. The labor market numbers aligned with the upbeat FOMC economic projections, supporting the more hawkish interest rate path.

The US equity markets responded to the labor market numbers, with the NASDAQ Composite Index sliding by 1.82%. It was also a grim session for the Dow and S&P 500, which saw losses of 1.08% and 1.64%, respectively.

The Thursday Market Movers

Four stocks bucked the bearish trend, including Commerzbank, which gained 0.50%. CFO projections on interest income resonated.

However, investor sentiment toward Fed monetary policy and the German economic outlook left the broader market in negative territory. BASF and Sartorius AG slid by 4.86% and 4.17%, respectively. Siemens Energy (-3.09%), Bayer (-2.82%), and Adidas (-2.40%) were also among the biggest losers.

Euro Area Private Sector PMIs in the Spotlight

German and Eurozone private sector PMIs for September will draw investor interest today. A more marked contraction across the manufacturing and services sector would weigh on buyer appetite.

Economists forecast the German services PMI to decline from 47.3 to 47.2 and the manufacturing PMI to rise from 39.1 to 39.5. Eurozone projections follow a similar trend. Economists forecast the Eurozone services PMI to fall from 47.9 to 47.7 and the manufacturing PMI to increase from 43.5 to 44.0.

With the services sector contributing over 60% to the Eurozone economy, the DAX will show more sensitivity to the services PMIs. A more marked contraction would further support a prolonged economic recession.

US Services PMI to Conclude a Volatile Week

US private sector PMIs will also need consideration. A hotter-than-expected US services PMI would support a more hawkish Fed interest rate path. The prospects of further Fed rate hikes and reducing chances of a 2024 Fed rate cut have weighed on the appetite for riskier assets.

Economists forecast the services PMI to increase from 50.5 to 50.6.

Short-Term Forecast

A more hawkish Fed policy outlook and the threat of a higher-for-longer Eurozone interest rate environment leave the DAX on the defensive. Euro area and US services PMIs will influence buyer appetite today and likely support the near-term bullish trend reversal.

DAX Technical Indicators

Daily Chart

The DAX sat below the 50-day EMA while remaining above the 200-day EMA, sending bearish near-term but bullish longer-term price signals.

A break above the 15,663 resistance level would support a DAX move to the trend line and 50-day EMA. Selling pressure will likely intensify at 15,830. The 50-day EMA is confluent with the trend line.

To break above the 15,663 resistance level, private-sector PMIs would need to exceed forecasts.

However, weaker services PMIs would support a DAX move toward the 200-day EMA and the 15,459 support level. Buying pressure will build at 15,470, with the 200-day EMA confluent with the 15,459 support level.

The 14-Daily RSI reading of 41.47 supports a DAX break below the 200-day EMA and 15,459 support level before entering oversold territory.

DAX Daily Chart sends mixed price signals.
DAX 220923 Daily Chart

4-Hourly Chart

The DAX, sitting below the 50-day and 200-day EMAs, sends bearish price signals. A DAX break above the 15,663 resistance level would support a move to the 50-day EMA.

However, a fall to 15,500 would give the bears a run at the 15,459 support level.

The 38.15 RSI reading supports a DAX break fall to 15,500 before entering overbought territory.

4-Hourly Chart sends bearish price signals.
DAX 220923 4-Hourly Chart
EUR/USD Forecast: PMIs Pose Risks; Euro Navigates Uncertainty

EUR/USD Forecast: PMIs Pose Risks; Euro Navigates Uncertainty

Thursday Overview

On Thursday, the EUR/USD slipped by 0.02%. Following a 0.18% loss on Wednesday, the EUR/USD ended the day at $1.06579. The EUR/USD fell to a low of $1.06167 before rising to a high of $1.06736.

Private Sector PMIs and ECB Chatter in Focus

After the ECB rate hike, possibly for a final time, investor focus will be firmly on the macroeconomic environment. Manufacturing and Services PMIs for France, Germany, and the Eurozone will influence the EUR/USD pair.

Trading Derivatives carries a high level of risk to your capital and you should only trade with money you can afford to lose. Trading Derivatives may not be suitable for all investors, so please ensure that you fully understand the risks involved, and seek independent advice if necessary. A Product Disclosure Statement (PDS) can be obtained either from this website or on request from our offices and should be considered before entering into a transaction with us. Raw Spread accounts offer spreads from 0.0 pips with a commission charge of USD $3.50 per 100k traded. Standard account offer spreads from 1 pips with no additional commission charges. Spreads on CFD indices start at 0.4 points. The information on this site is not directed at residents in any country or jurisdiction where such distribution or use would be contrary to local law or regulation.

Economists forecast modest increases in the manufacturing PMIs. However, economists predict a more marked contraction across the euro area services sector.

Economists predict the Eurozone manufacturing PMI to rise from 43.5 to 44.0 and the services PMI to fall from 47.9 to 47.7. The services PMIs will influence the EUR/USD more, with the euro area services sector accounting for more than 60% of GDP.

A more marked decline in service sector activity would put the euro area at risk of a prolonged recession. An elevated interest rate environment curbs consumer spending, further impacting service sector activity.

Beyond the numbers, ECB Chief Economist Philip Lane and ECB Executive Board member Luis de Guindos are on the calendar to speak. Lane will have more influence on the EUR/USD. A deviation from the higher-for-longer interest rate outlook would move the dial.

US Services PMI to Affirm Sentiment Toward Fed Policy Outlook

US private sector PMIs will draw investor interest later today. The services PMI will have more influence on sentiment toward Fed policy bets.

US services sector activity contributes over 75% to GDP. A pickup in service sector activity would fuel demand-driven inflation. Higher interest rates would curb consumption and ease demand-driven inflationary pressures.

Economists forecast the services PMI to increase from 50.5 to 50.6 in September. Hotter-than-expected services PMI numbers would also support bets on the Fed delaying rate cuts until 2025.

Short-Term Forecast:

Monetary policy and economic divergence remain firmly tilted in favor of the US dollar. However, an unexpected contraction across the US services sector could change the narrative. Near-term EUR/USD trends hinge on the services sector PMIs.

EUR/USD Price Action

Daily Chart

The EUR/USD positioned below the 50-day and 200-day EMAs is indicative of bearish price signals.

A more marked contraction across the euro area services sector would support a EUR/USD break below the $1.06342 support level. A break below the support level would bring sub-$1.06 into play.

However, an unexpected contraction across the US services sector would support a EUR/USD return to 1.07. The EUR/USD would need a sharp rise in service sector PMIs to support a move toward the $1.07635 resistance level.

The 14-period Daily RSI at 35.78 supports a EUR/USD break below the $1.06342 support level before entering oversold territory.

EUR/USD Daily Chart sends bearish price signals.
EURUSD 220923 Daily Chart

4-Hour Chart

The EUR/USD remains below the 50-day and 200-day EMAs, reaffirming the bearish price signals. A break above the 50-day EMA would support a EUR/USD return to $1.07.

However, a EUR/USD fall through the $1.06342 support level would bring sub-$1.06 into play.

The 14-period 4-Hourly RSI at 45.67 supports a EUR/USD fall through the $1.06342 support level before entering oversold territory.

4-Hourly Chart affirms bearish price signals.
EURUSD 220923 4 Hourly Chart