NASDAQ 100, Dow Jones, S&P 500 News: Eyes on U.S. Jobs Data and Federal Reserve Signals

NASDAQ 100, Dow Jones, S&P 500 News: Eyes on U.S. Jobs Data and Federal Reserve Signals

Market Awaits Crucial U.S. Jobs Data Amid Mixed Economic Signals

Stock futures on Friday pointed towards a positive opening, setting a hopeful tone as August drew to a close and investors braced for crucial U.S. employment figures. The Dow Jones Industrial Average futures suggested an opening climb by 120 points, an increment of 0.3%. Mirroring this optimism, the S&P 500 and Nasdaq 100 futures edged higher by 0.3% and 0.2%, respectively.

Treasuries React to Anticipated Labor Market Insights

In the fixed income sphere, U.S. Treasury yields inched upwards. The primary driver behind this movement is the impending August jobs report, scheduled for a 12:30 GMT release. Market experts, taking their cue from a Dow Jones poll, anticipate that the U.S. economy expanded its workforce by 170,000 positions in the past month. The broader trading community is holding its collective breath, hoping this report will indicate a significant economic deceleration. Such a slowdown might convince the Federal Reserve to reconsider its stance on imminent benchmark interest rate hikes.

Trading Derivatives carries a high level of risk to your capital and you should only trade with money you can afford to lose. Trading Derivatives may not be suitable for all investors, so please ensure that you fully understand the risks involved, and seek independent advice if necessary. A Product Disclosure Statement (PDS) can be obtained either from this website or on request from our offices and should be considered before entering into a transaction with us. Raw Spread accounts offer spreads from 0.0 pips with a commission charge of USD $3.50 per 100k traded. Standard account offer spreads from 1 pips with no additional commission charges. Spreads on CFD indices start at 0.4 points. The information on this site is not directed at residents in any country or jurisdiction where such distribution or use would be contrary to local law or regulation.

Federal Reserve’s Next Move: Speculations Abound

The financial streets are rife with speculation on the Federal Reserve’s next course of action. A dominant sentiment is the anticipation of at least one more rate increase from the central bank. Fueling this theory is the recent surge in commodity prices, expected to impact personal consumption expenditures and the consumer price index figures for the upcoming months. As one analyst put it, “If inflation remains stubborn or even rises slightly, it may trigger more aggressive action from the Fed. The exact timing, be it September or October, remains the market’s big question.”

Corporate Performance Highlights

In the corporate sector, positive earnings reports buoyed spirits. MongoDB, a leading database software producer, and tech giant Dell Technologies witnessed their shares leap by 6% and 9% in after-hours trading, respectively, both surpassing earnings expectations. Not to be left behind, athletic wear brand Lululemon Athletica enjoyed a 2% stock price hike post its commendable earnings announcement.

Reflecting on a Turbulent August

In a retrospective glance, August painted a picture of volatility for the stock market. Even though there were multiple upbeat trading sessions which reduced the month’s losses, major indexes reported a downturn. The S&P 500 retreated by 1.77%, the tech-heavy Nasdaq decreased by 2.17%, and the Dow Jones Industrial Average, encompassing 30 significant stocks, declined by a substantial 2.36%.

In light of these developments, the short-term forecast leans towards cautious optimism. While positive corporate earnings provide a silver lining, all eyes remain fixed on the Federal Reserve’s imminent decisions in the wake of the upcoming jobs report.

Dax Index: How Hawkish ECB Sentiments and Mixed Fed Signals Shape the Dax Market

Dax Index: How Hawkish ECB Sentiments and Mixed Fed Signals Shape the Dax Market

DAX Resumes Uptrend on Central Bank Bets

On Thursday, the DAX gained 0.35%. Reversing a 0.24% gain from Wednesday, the DAX ended August down 3.04% to 15,947.

German Economy Flashes Red Amidst Hawkish ECB Sentiment

Private sector PMI numbers from China and German retail sales painted a gloomy economic backdrop.

Trading Derivatives carries a high level of risk to your capital and you should only trade with money you can afford to lose. Trading Derivatives may not be suitable for all investors, so please ensure that you fully understand the risks involved, and seek independent advice if necessary. A Product Disclosure Statement (PDS) can be obtained either from this website or on request from our offices and should be considered before entering into a transaction with us. Raw Spread accounts offer spreads from 0.0 pips with a commission charge of USD $3.50 per 100k traded. Standard account offer spreads from 1 pips with no additional commission charges. Spreads on CFD indices start at 0.4 points. The information on this site is not directed at residents in any country or jurisdiction where such distribution or use would be contrary to local law or regulation.

German unemployment numbers also weighed, with sticky Eurozone inflation numbers supporting hawkish ECB policy bets. With hotter-than-expected Eurozone inflation numbers, the ECB monetary policy meeting minutes green-light a September ECB rate hike.

US Personal Income and Outlays Report Sends Mixed Fed Signals

In contrast, US economic indicators failed to boost the chance of a September Fed rate hike. The US Personal Income and Outlays Report reported a surge in personal spending and a modest increase in the Core PCE Price Index. However, personal income came in cooler. The mixed numbers left investors to await the US Jobs Report before making a decisive move.

According to the CME FedWatch Tool, the chances of the Fed delivering a September rate hike stood at 11.0% versus 10.0% one day earlier.

The US equity markets had a mixed reaction to the Thursday economic calendar. On Thursday, the S&P 500 and Dow fell by 0.16% and 0.48%, respectively. The NASDAQ Composite Index bucked the trend, rising by 0.11%.

The Thursday Market Movers

Bank and auto stocks limited the upside for the DAX on Thursday. Economic indicators raised more red flags. Commerzbank and Deutsche Bank were the worst performers, falling by 1.74% and 1.35%, respectively.

Volkswagen (-0.34%), Porsche (-0.12%), and BMW (-0.09%) also ended the day in negative territory.

Today’s Session

Economic indicators from China will set the tone this morning. The all-important China Caixin Manufacturing PMI caught the markets by surprise. The PMI jumped from 49.2 to 51.0 in August. Economists forecast a modest increase to 49.3. Weak overseas demand remained a concern despite the pickup in domestic business.

Later this morning, manufacturing PMI numbers for Spain and Italy and finalized PMIs for France, Germany, and the Eurozone will draw interest.

Barring a marked revision to the German PMI, we expect the Eurozone PMI to have more impact on buyer appetite. According to flash numbers, the Eurozone Manufacturing PMI increased from 42.7 to 43.7 in August.

The DAX Futures was up 25 points this morning on the better-than-expected Manufacturing PMI from China.

US Jobs Report to Have the Final Say of the Week

The US Jobs Report will garner interest this afternoon. Investors eased bets on Fed interest rates in response to the weaker-than-expected US JOLTs and ADP reports. However, the US Personal Income and Outlays Report left mixed signals, with spending and inflation up but income down.

A pickup in wage growth and a steady unemployment rate should put a final Fed rate hike on the table. Economists forecast an unemployment rate of 3.5% and wage growth of 4.4%.

Beyond the economic indicators, investors should monitor the news wires for central bank chatter. Reaction to this week’s economic calendar would draw interest.

Short-Term Forecast: Precarious Moment for the DAX

Rising bets on a September ECB rate hike and a grim macroeconomic environment leave the DAX under pressure. However, an end to the Fed monetary tightening would cushion the downside. The US Jobs Report needs to materially improve the chances of a Fed rate hike to leave the DAX at sub-$15,750.

DAX Technical Indicators

Daily Chart

On Thursday, resistance at 16,007 left the DAX at sub-16,000. However, the DAX broke through and held above the 50-day EMA, a bullish price signal. The DAX would need the US Jobs Report to reveal a softer wage growth and a modest increase in unemployment to retest resistance at 16,007.

However, a hotter-than-expected US Jobs Report would send the DAX down through the 50-day EMA to bring the trend line and 15,663 support band into play.

Considering the 14-Daily RSI at 53.70, the DAX has room to run before hitting overbought territory. However, the US Jobs Report needs to be DAX-friendly to support further gains.

DAX Daily Chart sends bullish price signals.
DAX 010923 Daily Chart

4-Hourly Chart

On Thursday, the DAX broke through the 200-day EMA to test the 16,007 resistance band. Notably, the 50-day EMA narrowed on the 200-day EMA, bringing a bullish cross into play. Euro area manufacturing sector PMIs and the US Jobs Report must be DAX-friendly to support a breakout from the 16,007 resistance band.

A hotter-than-expected US Jobs Report would likely see the DAX fall through the EMAs to target the trend line and 15,663 support band. We expect strong support at 15,663, with the support band and trend line crossing.

Considering the 60.70 RSI reading, the DAX has more room to run before entering overbought territory.

4-Hourly Chart affirms bullish price signals.
DAX 010923 4-Hourly ChartFor a look at the economic events, check out our economic calendar.

Don’t miss a thing! Sign up for a daily update delivered to your inbox
Silver Prices Forecast: Spot Value’s Rise Amid Waning US Interest Hopes

Silver Prices Forecast: Spot Value’s Rise Amid Waning US Interest Hopes

Silver’s Response to Economic Indicators

As the week winds down, spot silver hovers at $24.56 an ounce, anticipating a weekly rise exceeding 1%. Concurrently, U.S. silver futures display bullish sentiment, marked at $24.94. The catalyst? Decreasing prospects for U.S. interest rate hikes this year. With the U.S. non-farm payrolls (NFP) report on the horizon, the silver market is abuzz.

Economic Climate and the Fed’s Stance

Recent economic data from the U.S. portrays a mix of apprehension and hope among investors. July witnessed an all-time low in job openings, and the second quarter’s economic growth lagged behind predictions. These factors, in conjunction with the Federal Reserve’s ambiguous position on inflation, have dampened the U.S. dollar and Treasury yields. This softening is augmenting silver’s allure. Federal Reserve Chairman Jerome Powell’s insights on the persistent high inflation rates further complicate the picture, suggesting potential rate hikes.

Trading Derivatives carries a high level of risk to your capital and you should only trade with money you can afford to lose. Trading Derivatives may not be suitable for all investors, so please ensure that you fully understand the risks involved, and seek independent advice if necessary. A Product Disclosure Statement (PDS) can be obtained either from this website or on request from our offices and should be considered before entering into a transaction with us. Raw Spread accounts offer spreads from 0.0 pips with a commission charge of USD $3.50 per 100k traded. Standard account offer spreads from 1 pips with no additional commission charges. Spreads on CFD indices start at 0.4 points. The information on this site is not directed at residents in any country or jurisdiction where such distribution or use would be contrary to local law or regulation.

Jobs Data and Market Dynamics

Silver’s market dynamics are tightly knit with employment figures. The ADP’s August report showed a disappointing 177,000 new jobs, falling short of the Dow Jones’ 200,000 estimate. This could be a precursor for the NFP’s revelations, which have the potential to further influence the silver market. With Treasury yields already in decline, a subpar jobs report could amplify silver’s sheen.

Treasury Yields and Silver’s Appeal

The trajectory of U.S. Treasury yields is intrinsically tied to silver’s rise. With forecasts predicting a 3% decline by the week’s close, silver’s attraction is only poised to grow, especially considering the Federal Reserve’s hesitance towards imminent interest rate modifications.

Short-Term Outlook:  Bullish

Despite looming economic uncertainties, the immediate forecast for silver tilts towards bullish. The impending NFP report possesses the ability to redefine the narrative. However, for the time being, silver is on track for a second successive week of gains.

Technical Analysis

4-Hour Silver (XAG/USD)Silver (XAG/USD) on the 4-hour chart is currently trading at 24.59, having risen from its previous position of 24.45. The commodity finds itself trading above both the 200-4H moving average of 23.85 and the 50-4H moving average of 24.21, suggesting a bullish trend.

The 14-4H RSI registers at 58.05, signifying a momentum build-up, albeit not in overbought territory yet.

With the primary support zone set between 22.70 to 22.28 and resistance between 25.00 to 25.27, the price is closer to its resistance levels. This places the market sentiment for Silver (XAG/USD) in a bullish realm.

Gold Prices Forecast: XAU/USD Rises as NFP Report Looms Amid Soft U.S. Data

Gold Prices Forecast: XAU/USD Rises as NFP Report Looms Amid Soft U.S. Data

Gold Market Watches Fed’s Next Move

Spot gold (XAU/USD) hovered at $1,942.22 per ounce by early Friday morning GMT, setting itself up for over a 1% weekly gain. U.S. gold futures were also bullish, trading near $1,970. The commodity’s strong showing comes on the back of weakened prospects for U.S. interest rate hikes this year, particularly as market participants await the U.S. non-farm payrolls (NFP) report due later in the day.

U.S. Economic Indicators Point to Slowing Activity

The general mood among investors appears cautious but optimistic, as economic indicators from the U.S. this week have largely been softer than expected. Job openings in July hit their lowest level in 2.5 years, and second-quarter economic growth was slightly less robust than previously projected. These metrics have led to a softening of the U.S. dollar and Treasury yields, both contributing factors to gold’s rising attractiveness.

Trading Derivatives carries a high level of risk to your capital and you should only trade with money you can afford to lose. Trading Derivatives may not be suitable for all investors, so please ensure that you fully understand the risks involved, and seek independent advice if necessary. A Product Disclosure Statement (PDS) can be obtained either from this website or on request from our offices and should be considered before entering into a transaction with us. Raw Spread accounts offer spreads from 0.0 pips with a commission charge of USD $3.50 per 100k traded. Standard account offer spreads from 1 pips with no additional commission charges. Spreads on CFD indices start at 0.4 points. The information on this site is not directed at residents in any country or jurisdiction where such distribution or use would be contrary to local law or regulation.

Treasury Yields and The Dollar Index

The decline in U.S. Treasury yields has played a pivotal role in gold’s recent upward trajectory. Treasury yields are set to conclude the week approximately 3% lower, largely owing to subdued inflation data. The declining yields have boosted the allure of gold, a non-interest-bearing asset, especially as the Federal Reserve seems unlikely to adjust interest rates in the near term.

NFP Report Could Be a Game Changer

The upcoming NFP report could further solidify gold’s bullish run. If the report prints a lower-than-expected number of new jobs, it’s likely to push Treasury yields even lower, thereby adding another layer of shine to gold. On the flip side, a stronger report could put a damper on the current rally.

Short-Term Forecast: Bullish

Given the week’s economic data and the diminishing likelihood of an imminent rate hike by the Fed, the short-term outlook for gold prices remains bullish. Of course, this could change with the release of the NFP report, but as it stands, gold is on track for its second consecutive week of gains

China Caixin Manufacturing PMI Hits 51 Despite Weak Overseas Demand

China Caixin Manufacturing PMI Hits 51 Despite Weak Overseas Demand

China Caixin Manufacturing PMI Impresses

The Caixin Manufacturing PMI increased from 49.2 to 51.0 in August. Economists forecast the PMI to rise to 49.3.

According to the August survey,

  • Market conditions supported an increase in new domestic orders.
  • However, new orders from overseas continued to fall, albeit at a less marked pace.
  • The upswing in new orders led to a pickup in production, though firms remained cautious about stockpiling.
  • Nonetheless, manufacturers increased staff levels on expansion plans. The rate of job creation was the most marked since March 2010.
  • Rising prices for raw materials pushed input prices higher for the first time since February.
  • Despite the upswing in input prices, firms reduced output prices amidst increased competition for new business.
  • Optimism across the manufacturing sector deteriorated in August, with sentiment declining to an 11-month low.

While the return to growth was positive, weakness in overseas demand remains a concern. The Chinese economy will need more than domestic demand to support an economic recovery.

AUD/USD Reaction to the China Caixin Manufacturing PMI

Before the China Caixin Manufacturing PMI Report, the AUD/USD fell to a low of $0.64739 before striking a pre-stat high of $0.64999.

However, in response to the Caixin survey, the AUD to USD rose to a post-stat high of $0.64917 before falling to a low of $0.64814.

This morning, the Aussie Dollar was up 0.01% to $0.64850.

AUD/USD responds to the China Caixin Manufacturing PMI
Up NextThe US Jobs Report will be in the spotlight this afternoon. With the markets divided on Fed interest rate goals, US wage growth and unemployment figures could refuel bets on a final rate hike.

Economists forecast average hourly earnings to increase by 4.4% year-over-year in July. Despite the disappointing ADP and JOLTs numbers, economists expect a US unemployment rate of 3.5%.

ISM Manufacturing and finalized S&P Global Manufacturing PMIs will also draw interest. Investors will likely consider any data points that can influence Fed monetary policy bets.

Indices on Track for Second Week of Gains: FTSE 100, Nasdaq 100, DAX 40

Indices on Track for Second Week of Gains: FTSE 100, Nasdaq 100, DAX 40

FTSE 100, DAX 40, Nasdaq 100 Analysis and Charts

​​​FTSE 100 on track for second week of gains

​The FTSE 100, which slid back to its breached July-to-August downtrend line on Thursday, is bouncing off it ahead of US Non-Farm Payrolls on Friday. ​The UK blue chip index looks to be on track for a second week of gains as investors positively interpreted the weaker US growth and employment data out this week as dovish with regard to monetary policy. ​The 55-day simple moving average (SMA) at 7,482 is back in focus, as is this week’s high at 7,510.

​Minor support can now be found along the breached July-to-August downtrend line at 7,425 ahead of more significant support made up of the May, June, and early August lows at 7,437 to 7,401.

FTSE 100 Daily Chart

​​DAX 40 is expected to end the week on a positive note

​The DAX 40 continues its advance as China’s manufacturing activity unexpectedly expanded in August, boosting Asian stock markets, except Australia’s AU200. ​Thursday’s high at 16,044 and the 10 August high at 16,062 remain in sight. These highs need to be exceeded for a medium-term bullish reversal to be confirmed.

​Minor support comes in at the 15,895 high seen last week, ahead of Wednesday’s low at 15,821. ​Further support comes in along the breached one-month resistance line, now because of inverse polarity a support line, at 15,685.

DAX 40 Daily Chart

​​Nasdaq 100 is losing upside momentum ahead of US NFP data

​The Nasdaq 100’s five consecutive days of gains take place among diminishing upside momentum as investors brace themselves for today’s US Non-Farm Payrolls. Nonetheless, the index regained most of its August losses within the past week as investors pursued a more dovish Fed outlook. ​Were this week’s high at 15,576 to be exceeded, the late July high at 15,807 would be in focus, together with the July peak at 15,932.

​Slips should find support around last week’s high at 15,369. Minor support below this level is seen along the 55-day simple moving average (SMA) at 15,236.

Nasdaq 100 Daily Chart

Gold Price Outlook: XAU/USD Faces Key Technical Intersection as Retail Traders Sell

Gold Price Outlook: XAU/USD Faces Key Technical Intersection as Retail Traders Sell

Gold prices remain over 3 percent higher compared to the middle of August. Since then, retail traders have continued to increase downside exposure. This can be seen by taking a look at IG Client Sentiment (IGCS), which often functions as a contrarian indicator. With that in mind, could the yellow metal extend its recent winning streak?

Gold Sentiment Outlook – Bullish

The IGCS gauge shows that about 65% of retail traders are net-long gold. Since most of them are biased to the upside, this continues to hint that prices may decline down the road. But, downside exposure has increased by 4.61% and 42.15% compared to yesterday and last week, respectively. With that in mind, despite overall positioning, recent changes in exposure hint that the current price trend may extend higher.

XAU/USD Daily Chart

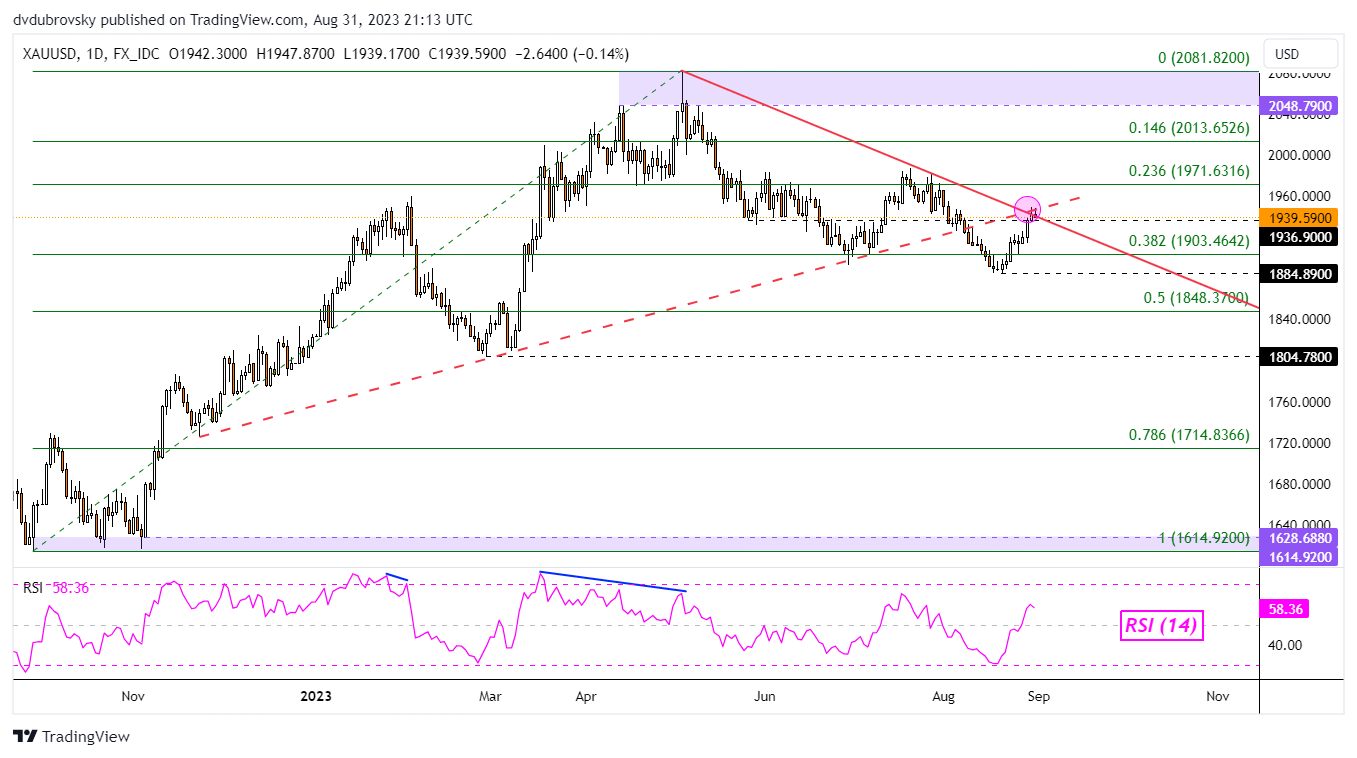
On the daily chart, gold prices are facing the next critical technical test. It is the intersection of a falling trendline from May and former rising support from the end of last year – highlighted as the pink circle in the daily chart below. A hold at resistance would open the door to extending the downtrend since earlier this year.

That would place the focus on near-term support which is the 38.2% Fibonacci retracement level of 1903.46. Beyond that sits the August swing low of 1884.89. Clearing the latter opens the door to resuming broader losses since May. Otherwise, pushing above resistance offers an increasingly bullish technical outlook, placing the focus on the 23.6% Fibonacci retracement level of 1971.63.

XAU/USD Daily Chart

Crude Oil Price Climbs on Russia News and EIA Data as it Eyes New Highs

Crude Oil Price Climbs on Russia News and EIA Data as it Eyes New Highs

The crude oil price climbed higher going into Friday’s trading session after reports emerged that Russia would extend cuts to production and inventory data revealed another drop in stockpiles.

It is being reported overnight that Russia will announce new parameters of a deal with its OPEC+ partners next week according to Deputy Prime Minister Alexander Novak.

On the flipside, the latest data also shows that China and India imported less oil in July.

Thursday’s US Energy Information Agency (EIA) weekly petroleum status report revealed a massive drop of -10.584 million barrels for the week ended August 25th, much lower than the -3.267 million anticipated and -6.135 prior.

It comes hot on the heel of the American Petroleum Institute (API) inventory report the day before that showed -11.486 million fewer barrels in stock for the same week. Again, that was well below the -2.9 million forecast.

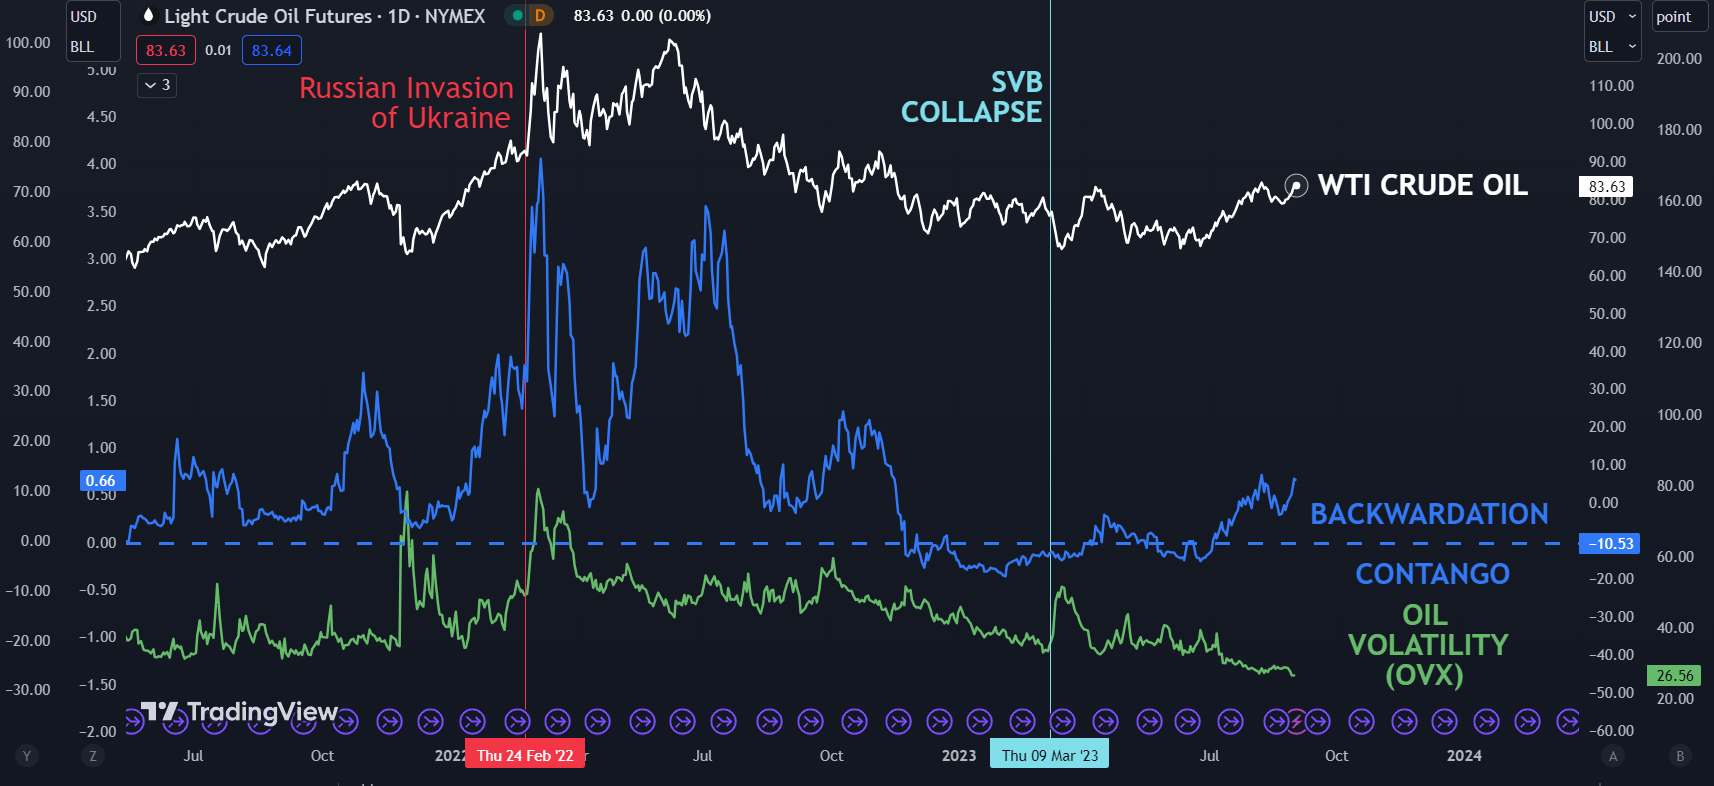
Backwardation between the front 2 WTI futures contracts had been moving in a bullish direction for crude and might support the case that demand in the US is robust for now.

At the same time, the OVX index continues to languish at its lowest level since 2019 which may indicate that the market is non-plussed about the run-up in prices.

The OVX index measures volatility in the WTI oil price in a similar way that the VIX index gauges volatility on the S&P 500.

At the start of trading on Friday, the WTI futures contract is a touch above US$ 83.50 bbl while the Brent contract is trading near US$ 86.80 bbl at the time of going to print.

The August peak was US$ 84.89 for WTI and US$ 87.37 for Brent. Live prices can be found here.

The markets appear to be somewhat at a crossroads after soft US data earlier in the week led to speculation that the Fed might not need to be as aggressive in its tight monetary policy stance.

Later today US non-farm payrolls (NFP) will be released could provide a catalyst for oil price volatility. A Bloomberg survey of economists is forecasting that 170k jobs were added in August and that the unemployment rate will remain steady at 3.5%.

The weekly Baker Hughes rig-count report is also likely to get some attention.

For more information on how to trade oil, click on the banner below.

WTI CRUDE OIL, RBOB CRACK SPREAD, BACKWARDATION AND VOLATILITY (OVX)

image1.png


How Do the US Dollar, Gold, S&P 500, and More Trade at the Onset of Recessions?

How Do the US Dollar, Gold, S&P 500, and More Trade at the Onset of Recessions?

The onset of recessions in the United States typically results in reoccurring financial market trading patterns. While not all of them will be the same, we can look back and see how key assets have performed. This is a special report that analyzes how the US Dollar, gold, S&P 500, Australian Dollar and 10-year Treasury yield traded during the first 3 months of economic downturns.

The length and severity of each recession will vary. This means the usual reaction you might expect from an asset during the onset of a downturn will not always repeat perfectly. For example, during the 2000s housing crash, the US entered a recession in Q4 of 2007. While the stock market declined during these 3 months as one might have expected, peak market volatility occurred much later towards the end of 2008.

Before diving into this topic, I need to set the ground rules, starting with the definition of a recession. In this study, I will be using a GDP-based recession indicator, which attempts to assign dates to downturns based on a mathematical model. This is as opposed to the NBER’s Business Cycle Dating Committee playbook, which can at times be subjective. You can learn more about the indicator I am referencing here.

This definition is also different from the widely referenced two consecutive quarters of negative growth, which is unofficial and often too simplistic, failing to capture other economic trends. For example, in 2022, the economy experienced 2 quarters of negative growth in Q1 and Q2. But, the labor market outperformed.

For analyzing the US and Australian Dollars, I will be using a correlation-weighted currency index instead of an exchange rate. This helps us capture the broader direction of a currency against the world rather than any individual unit. Otherwise, comparing AUD/USD with the DXY Dollar Index runs the risk of placing too much emphasis on the greenback.

Average Snapshot

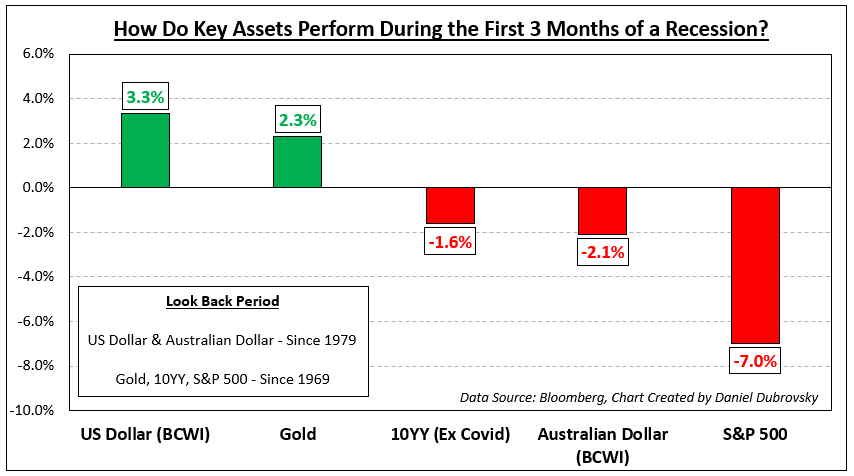
The chart below is a snapshot of how these assets performed during the onset of recessions ordered from best performing to the worst. The sequence is as follows: US Dollar, gold, 10-year Treasury yield, Australian Dollar and S&P 500. The availability of currency data meant I could only look back to 1979. For the rest of the assets, I was able to look back to 1969. The remainder of this article breaks down the individual performance beginning with the US Dollar.

Average Snapshot

US Dollar

Looking back to recessions since 1979, which adds up to 6, the Bloomberg Correlation-Weighted US Dollar Index rose 3.3% on average in the first 3 months of economic downturns. That is not to say each time it climbed. The up/down ratio is 50%. But, as you can see in the chart below, when the dollar rallies, it tends to do so strongly. During periods when the currency fell, the downside reaction was much weaker. This should come as little surprise. In the currency spectrum, the US Dollar functions as a haven given its status as the world’s reserve currency.

US Dollar

Gold

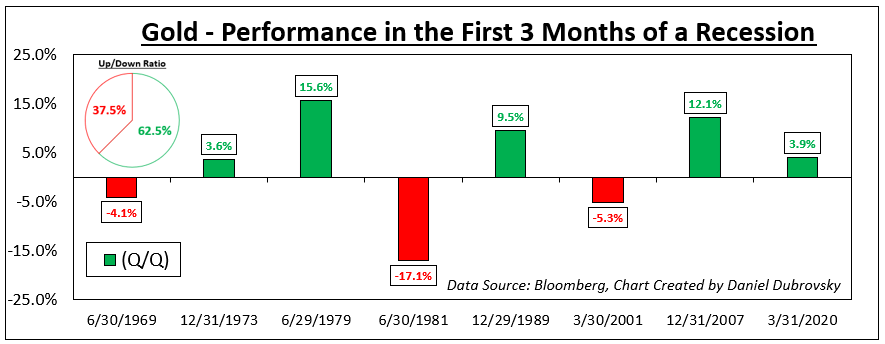
Meanwhile, gold also tends to perform decently at the onset of recessions going back to 1969. On average, the yellow metal returned +2.3% with a win/loss ratio of about 62.5%. Like the US Dollar, the wins were stronger than your average losses, excluding the early 1980s recession (-17.1%). Does this make gold a haven? Remember that gold is not as liquid as a currency. XAU/USD tends to function as an anti-fiat instrument. When the return on cash dwindles, which is what usually happens during recessions, gold becomes relatively more attractive and vice versa.

Gold

10-Year Treasury Yield

From this point forward, we are moving on to assets that underperform. Since 1969, the 10-year Treasury yield has declined by -1.6% on average during the onset of recessions (excluding Covid, which was a major negative outlier that skews the mean). Factoring in Covid though, the up/down ratio is about 29%. Bonds tend to receive a high amount of demand during economic uncertainty due to perceived safety, pushing up the price at the cost of yields.

10-Year Treasury Yield

Australian Dollar

Looking at the Bloomberg Correlation-Weighted Australian Dollar Index, the Aussie returned on average -2.1% during the first 3 months of a US recession since 1979. AUD also has a depressingly low win/loss rate of 16.7%. In currency markets, the Aussie is known for its sentiment-linked status, often closely following equities. Australia’s economy is closely tied to the global business cycle due to commodity exports, making it important to watch growth in the United States. When the latter sneezes, the world can catch a cold, driving up market volatility and negatively impacting the Australian Dollar.

Australian Dollar

S&P 500

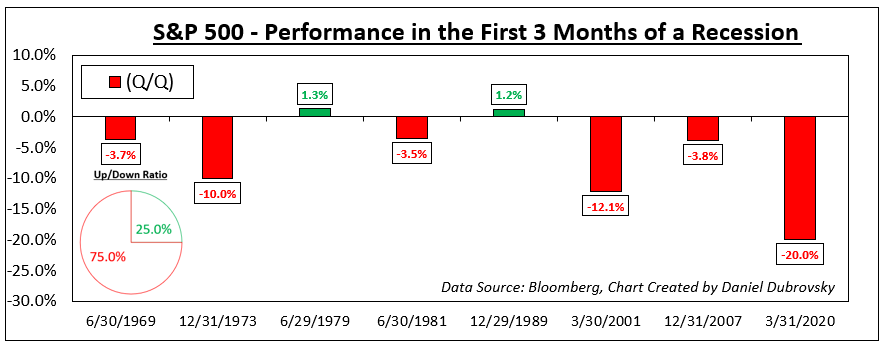
Finally, we arrive at the S&P 500, which is one of the key US benchmark stock indices. Unsurprisingly, the S&P 500 has returned on average -7.0% at the onset of recessions since 1969. But, unlike the Australian Dollar, the win/loss ratio is slightly better at 25%. This is unsurprising. Depending on the severity of the recession, uncertainty plays a key role in how much the stock market declines and how fast it does.

Recessions raise the risk that companies can go out of business and/or lay off workers, resulting in stock market crashes. Often, a bubble popping can lead to a recession, such as the dotcom bust in the early 2000s and the housing market leading in 2008. There are also leading indicators of a recession that you might be interested to learn about.

S&P 500

The Mystery of Bearish Engulfings: Do they Reliably Predict Forex Price Reversals?

The Mystery of Bearish Engulfings: Do they Reliably Predict Forex Price Reversals?

A Bearish Engulfing (BE) is a candlestick pattern that can be identified when looking at virtually any financial trading instrument. All you need is an opening, high, low and closing price. As implied by the name, technicalists will often use these as signals that an upward-trending market might be readying to reverse. But as you might have heard past performance is not always indicative of future results.

This is not a report about the intricacies of Bearish Engulfings: which you may learn more about here. Rather, the purpose of this educational content is to test their effectiveness using price and price alone. This will come from the foreign exchange market (forex). At the end of the article, I will go over the key takeaways and some of the limitations of this study. In the meantime, let us set some ground rules.

Identifying Bearish Engulfings – EUR/USD, GBP/USD, USD/JPY, AUD/USD, USD/CAD

Almost 37,000 candles were analyzed between EUR/USD, GBP/USD, USD/JPY, AUD/USD and USD/CAD using daily data since 1995 from TradingView. One of the reasons why I chose the foreign exchange market is because of its unparalleled liquidity, especially amongst the major pairs. This helps produce smoother price action compared to other markets, such as stocks and cryptocurrencies.

How did I identify Bearish Engulfings? It was based on a set of rules I coded to search over each candle to recognize if it was valid. For this study, I focused on a near-term horizon, which translates to 20 days before and after an engulfing. In total, there are too many rules to go over. Instead, let us look at some of the most important ones:

Bearish Engulfing Detection Rules

  1. The Bearish Engulfing body must meet a minimum size requirement, it cannot be too small
  2. The body of the candle before the BE (the pre-candle) cannot be too small relative to the BE body
  3. Rather than the pre-candle low, the BE must close under the pre-candle open
  4. Before the BE, there must be the appearance of an uptrend (no downtrends or flat price action)
  5. The pre-candle close must also be a 20-day high close, with some cautious room for error

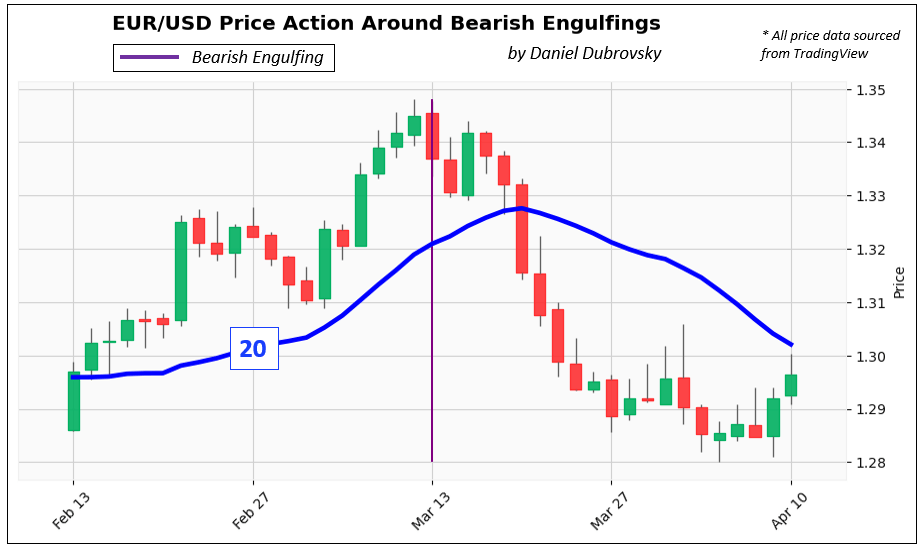
Limitations to these rules and subjectivity will be discussed at the end of this report. In the meantime, the chart below is an example of a detected EUR/USD Bearish Engulfing pulled on March 13th, 2005. This serves as an example of a clean one. Notice how the price was trending higher before the BE and the pre-candle close was a 20-day high close. After the BE, the price turned lower as one would expect.

In total, the code detected slightly over 200 Bearish Engulfings from a possible almost 37,000 candles. Of course, not all of them were as clean as the one below. If you would like to watch how some of the other cases appeared, I highly encourage you to check out this link to a Twitter thread I made that displays some of the Bearish Engulfings in each pair.

Identifying Bearish Engulfings – EUR/USD

37,000 Candles, Over 200 Bearish Engulfings, How Do the Trends Look Like?

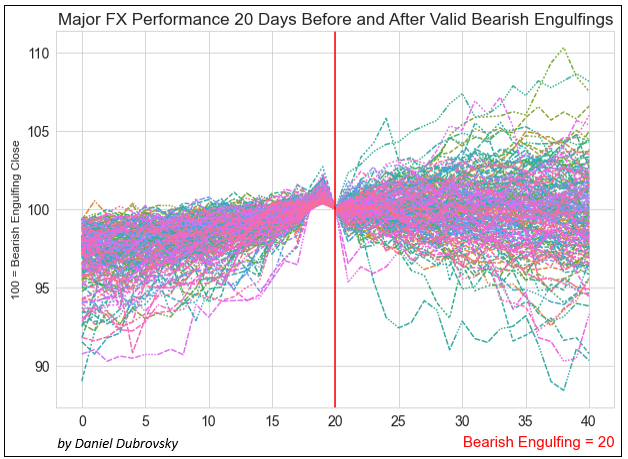
Below is a chart that plots each Bearish Engulfing trend 20 days before and after its appearance. To make sure that every trend was in the same scale range, each BE (close) was indexed to 100 as a starting point.

In the period leading into the BE, you can see how the trends were rising with a consistent pattern and range. Then, the day before the BE was always the peak. This is what creates the dip into the BE, which represents the close under the pre-candle.

What happens after the Bearish Engulfing? The trends continue for 20 days and with each passing period, spread out in a cone or triangle-like fashion. The right side also exhibits a larger dispersion of prices (variance) than the left, with a wide range of peaks and troughs. At first glance, this speaks to randomness and pours cold water on the idea of Bearish Engulfings as consistent reversal signals. But we need to take a closer look.

37,000 Candles, Over 200 Bearish Engulfings, How Do the Trends Look Like?

How Does the Average Bearish Engulfing Trend Look Like?

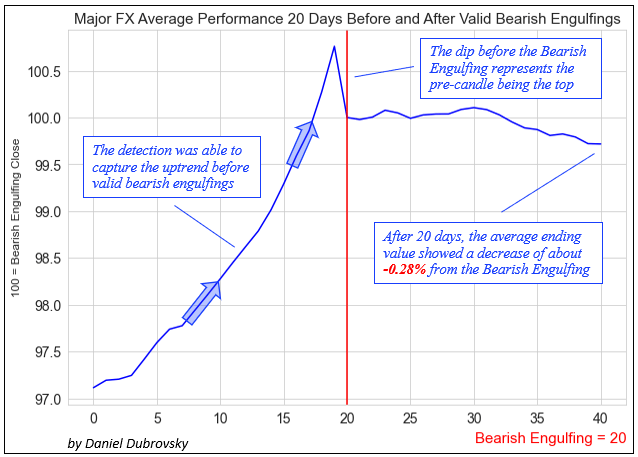
That is where the next chart comes in, which is the average Bearish Engulfing trend. This visualization confirms that the code was able to consistently capture the uptrend before the BE. Just like with the previous chart, you can see the top right before the BE before the price fell to 100, representing the dip into the engulfing. After the engulfing, prices continued lower, finishing -0.28% on average 20 days after the BE. So, it appears that there is a slight downward bias in the post-BE trend. I would argue that this is not the most important takeaway from this analysis.

How Does the Average Bearish Engulfing Trend Look Like?

Bearish Engulfings: Reversal or Topping Signal?

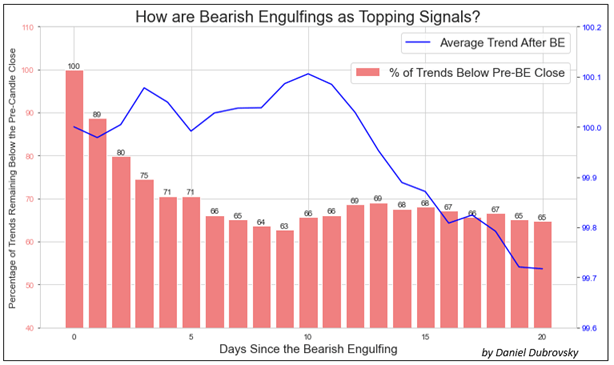
The last chart overlays the average Bearish Engulfing series, with the percentage of trends that closed below the pre-candle for each day. For example: after 5 days, 71% of trends remained below the pre-candle close. After 10 days, this number shrank to 66%, then rose to 68% on the 15th day and finally ending at 65% on the 20th day. In other words, on average, about two-thirds (2/3) of trends remained below the top after one month.

Here is a fun fact: after 20 days, the ending price observations created a statistically significant normal distribution. This means we can alternatively use a Cumulative Distribution Function (CDF) to calculate the probability of a series in this sample finishing below the top. And just like with the results mentioned earlier, that clocks in at roughly 65% as well.

Bearish Engulfings: Reversal or Topping Signal?

What’s the Verdict on Bearish Engulfings?

After analyzing almost 37,000 candles between EUR/USD, GBP/USD, USD/JPY, AUD/USD and USD/CAD, identifying at least 200 Bearish Engulfings, it seems that this candlestick pattern functions better as a topping signal than a reversal one. While the average trend finished almost -0.3% after 20 days, 2/3 of them remained below the top. In other words, if we can identify valid Bearish Engulfings in this market, it might be worth paying attention to. But, let us go over some study limitations.

Study Limitations

While Bearish Engulfings can be observed universally between markets, understand that a specific subset of the forex market was analyzed for this study, and it might be the most relevant to the pairs studied. Furthermore, this is based on a sample of a little over 200 Bearish Engulfings. More might be needed to enhance the validity of this study, (or even disprove it).

As much as I tried to keep this study as objective as possible, there is some inherent subjectiveness in technical analysis. For example, while most people can universally agree on the dimensions of a Bearish Engulfing and how they appear, the background in which they form is more fluid. In this sample, I considered if the BE closed under the pre-candle open and not the pre-candle low. Some may debate that the latter is more proper.

Another important factor is the timeframe. This was conducted on daily data, but you could theoretically analyze different layers of time horizons. That also includes the duration you measure before and after the engulfing. This study was focused on near-term price action, but you could also analyze broader trends, such as 40 days before and after the Bearish Engulfing