Australian Dollar Languishes Near Lows After RBA Pauses Again. Lower AUD/USD?

Australian Dollar Languishes Near Lows After RBA Pauses Again. Lower AUD/USD?

The Australian Dollar struggled to gain traction on Tuesday after the RBA left its cash rate at 4.10% as widely anticipated by the interest rate market and economists.

The Aussie had been battling going into the decision on slight risk aversion sentiment with equity markets seeing a soft day.

The ASX S&P 200 slid slightly lower from the open but steadied in the afternoon session and was little changed after the RBAs announcement.

The accompanying statement on the monetary policy decision by Governor Philip Lowe cited notable risks around services inflation, the uncertainty around the laggard effects of tighter policy, household consumption and the economic outlook for China given the problems in its property sector.

The statement noted, “Some further tightening of monetary policy may be required to ensure that inflation returns to target in a reasonable timeframe, but that will continue to depend upon the data and the evolving assessment of risks.”

This was Mr Lowe’s last decision as Governor, and he will hand over the reins in a fortnight to Michele Bullock.

Ms Bullock has been the Deputy Governor of the bank since April 2022 and has been with the institution since 1985. She has a reputation as a leading economist in her own right.

The appointment is mostly viewed as a steady transfer of leadership at a critical time for monetary policy at the RBA and her recent remarks point toward a similar approach to that of her predecessors.

Going into today’s monetary policy decision, AUD/USD had been slipping lower as the US Dollar strengthened across the board, despite a holiday there overnight.

Perhaps undermining the Aussie, headline current account figures missed estimates earlier today. However, on closer inspection, the statistics could be seen as neutral, given the upward revisions to the prior reading.

In addition, net exports as a percentage of GDP were robust through the second quarter. This points towards another stellar trade surplus that will be released on Thursday.

AUSTRALIAN DATA TODAY
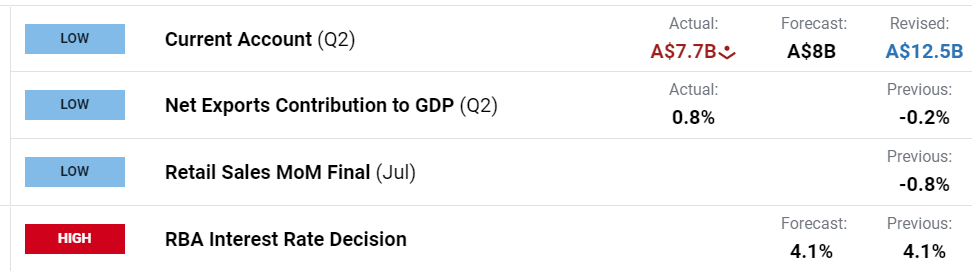
image1.png

Elsewhere in Asia today, China’s attempts to reignite its economy continue to struggle to get off the ground with the Caixin services PMI missing estimates today, further highlighting the RBA’s concerns.

It came in at 51.8 for June, rather than the 53.5 anticipated and 54.1 previously. The composite PMI was 51.7 against 51.9 prior.

On Wednesday, 2Q Australian quarter-on-quarter GDP is forecast to be 0.3% against 0.2% previously.

Annual GDP to the end of July is anticipated to be 1.8% against the prior read of 2.3% as the base effect kicks in.

The full economic calendar can be viewed here.

AUD/USD 1 MINUTE CHART PRICE REACTION TO RBA HIKE

Live prices can be found here.
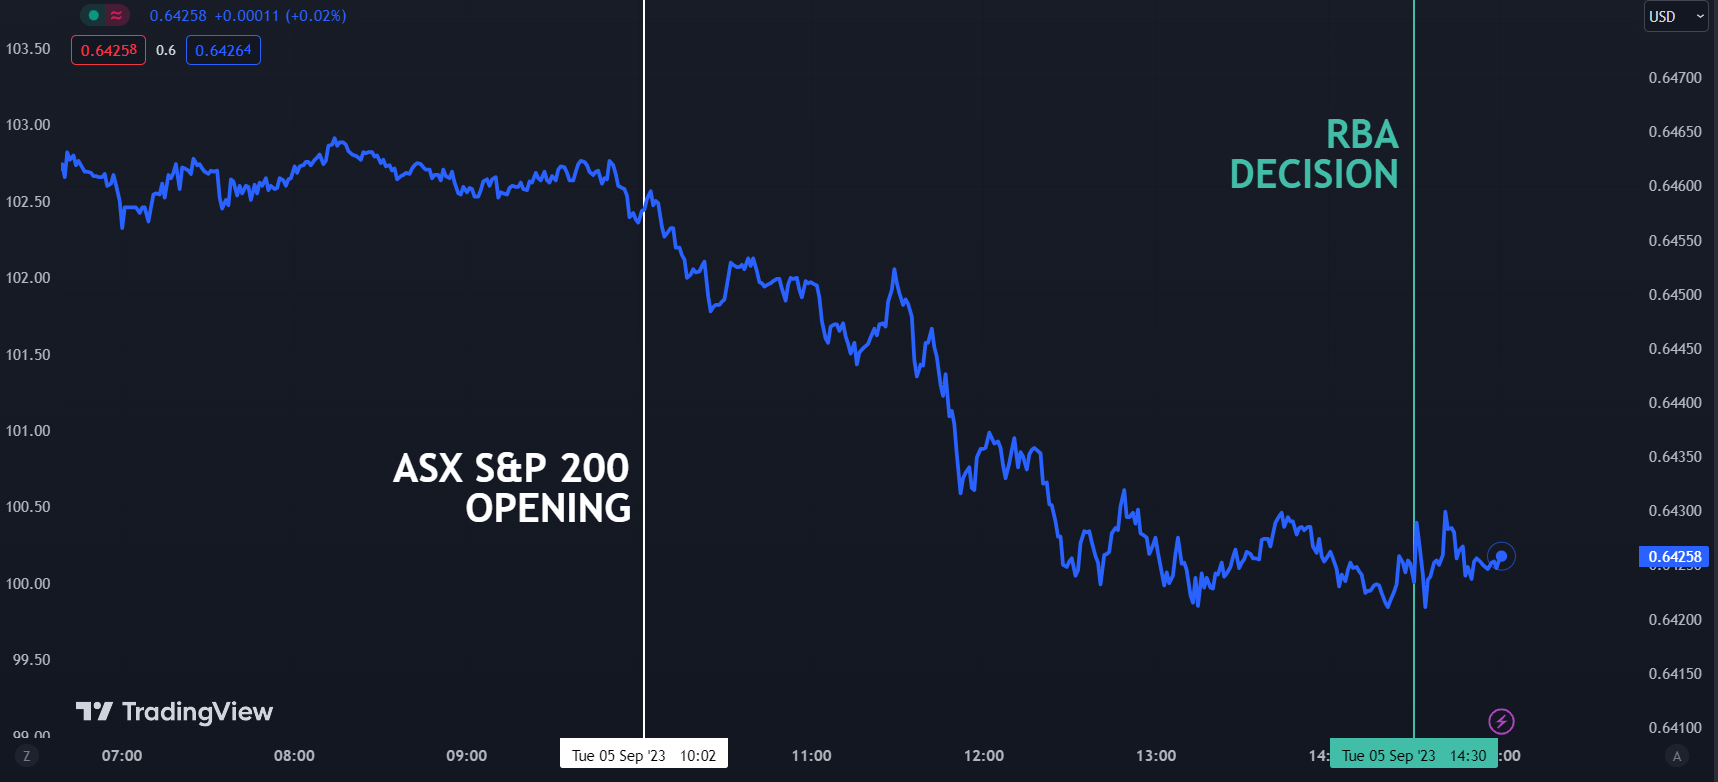
image2.png


Bitcoin & Ethereum Influenced by Thick Cloud Cover; BTC/USD & ETH/USD Price Setups

Bitcoin & Ethereum Influenced by Thick Cloud Cover; BTC/USD & ETH/USD Price Setups

BITCOIN: Not out of the woods yet

Last week’s early bounce was short-lived after the Securities and Exchange Commission (SEC) delayed making any decision on Bitcoin ETF applications. While many remain hopeful of an eventual blessing from the agency, the optimism isn’t being reflected on the technical charts of BTC/USD just yet.

BTC/USD Weekly Chart

image1.png

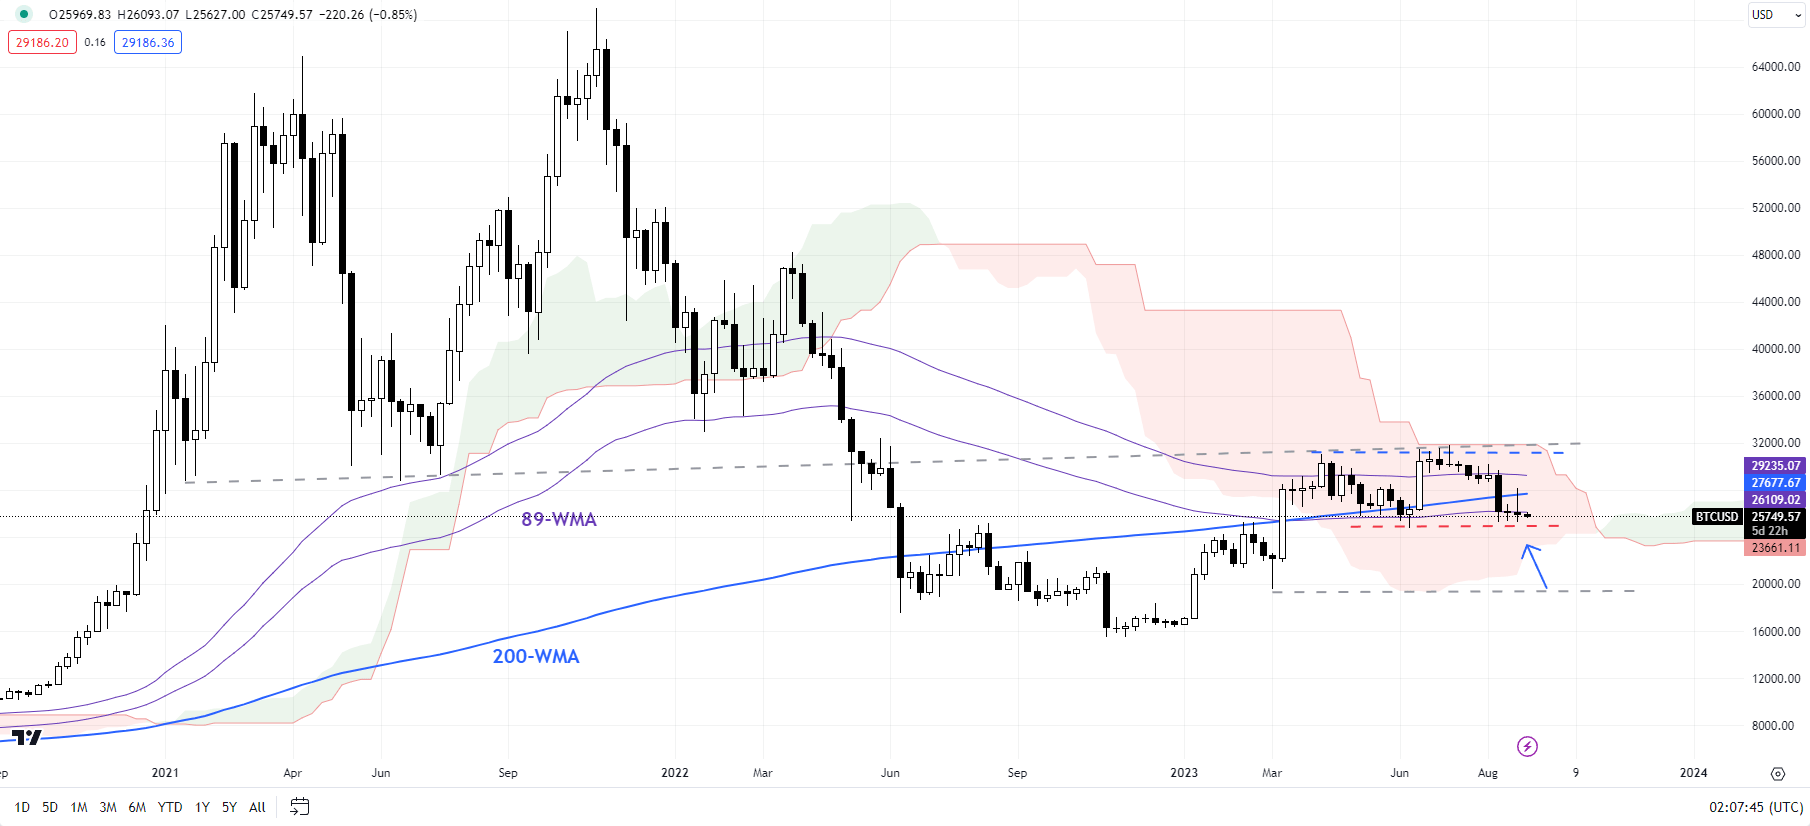
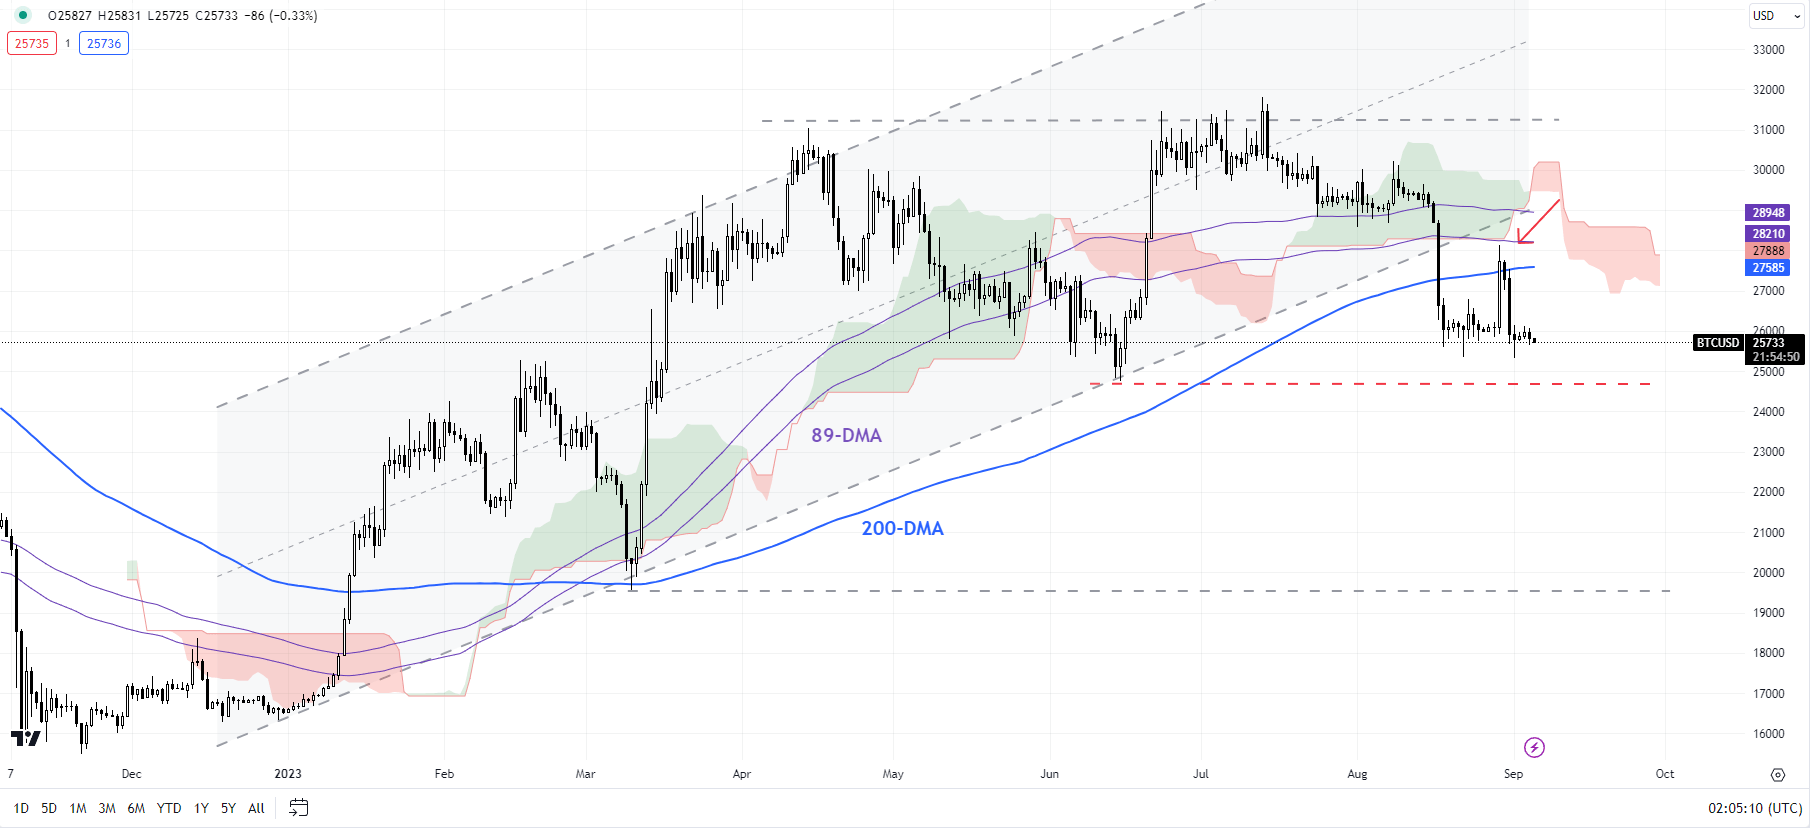
BTC/USD is now testing key support at the June low of 24750 – this support is crucial as a break below would disrupt the higher-highs-higher-lows sequence since late 2022. Furthermore, such a break would trigger a double top (the April and July highs), pointing to a deeper retracement toward the March low of 19550.

BTC/USD Daily Chart

image2.png

The recent weakness follows an inability to rise past the upper edge of the Ichimoku cloud on the weekly charts, roughly coinciding with a slightly upward-sloping trendline from 2021 and the 89-week moving average. For more discussion, see “Bitcoin & Ethereum Hold Ground Ahead of US CPI: BTC/USD & ETH/USD Price Setups,”published August 10.

ETH/USD Weekly Chart

image3.png

ETHEREUM: Looking vulnerable

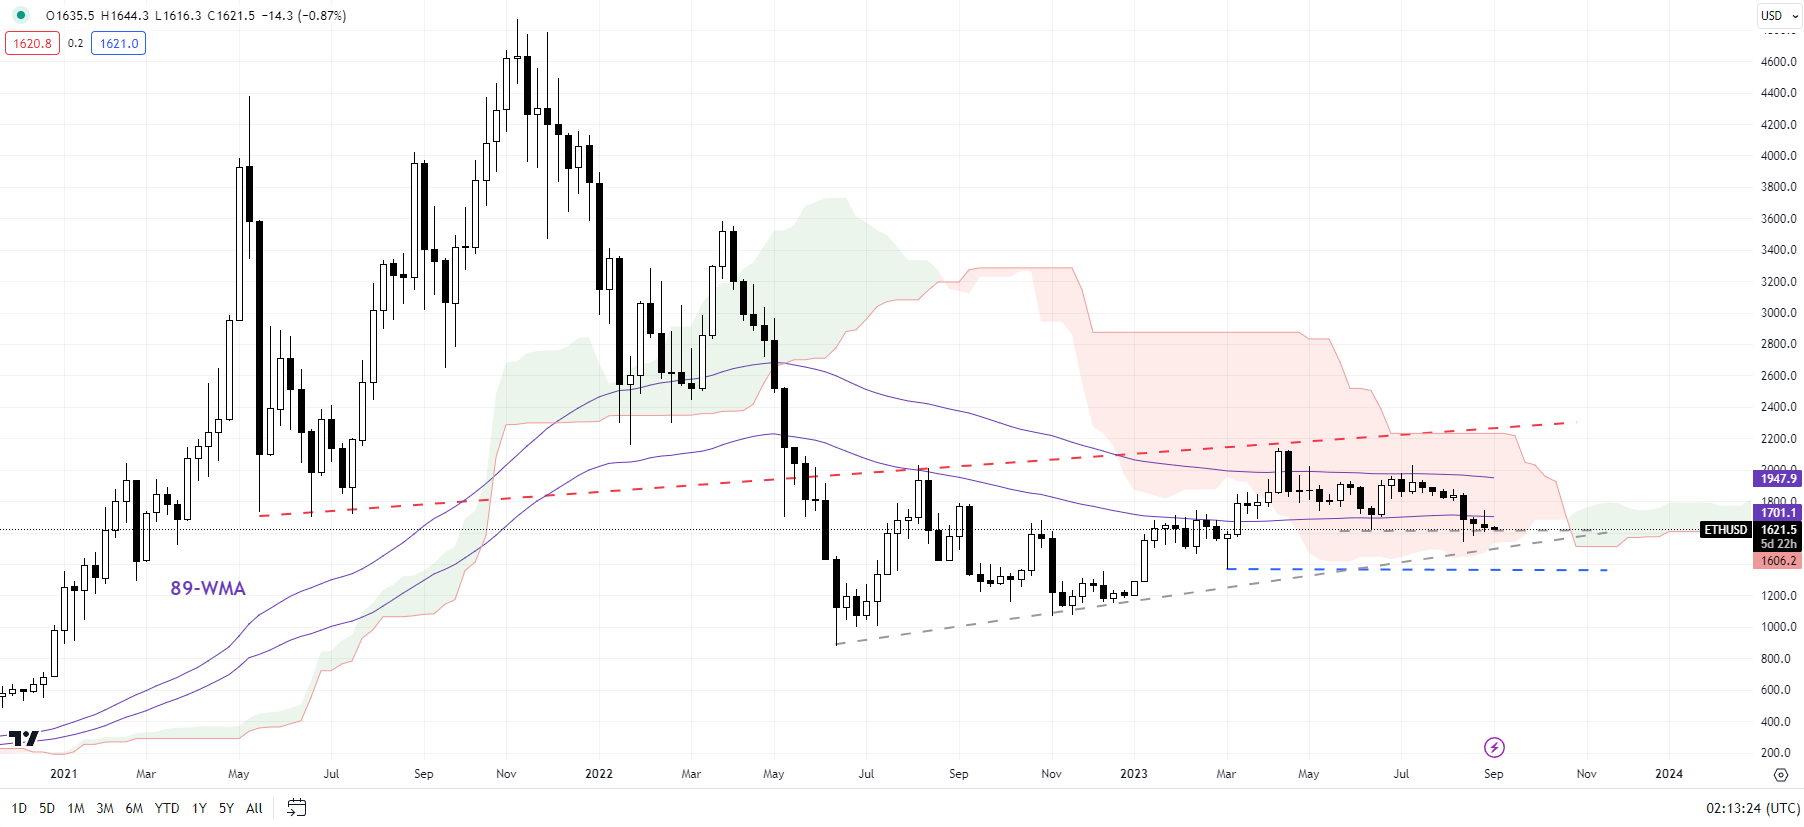
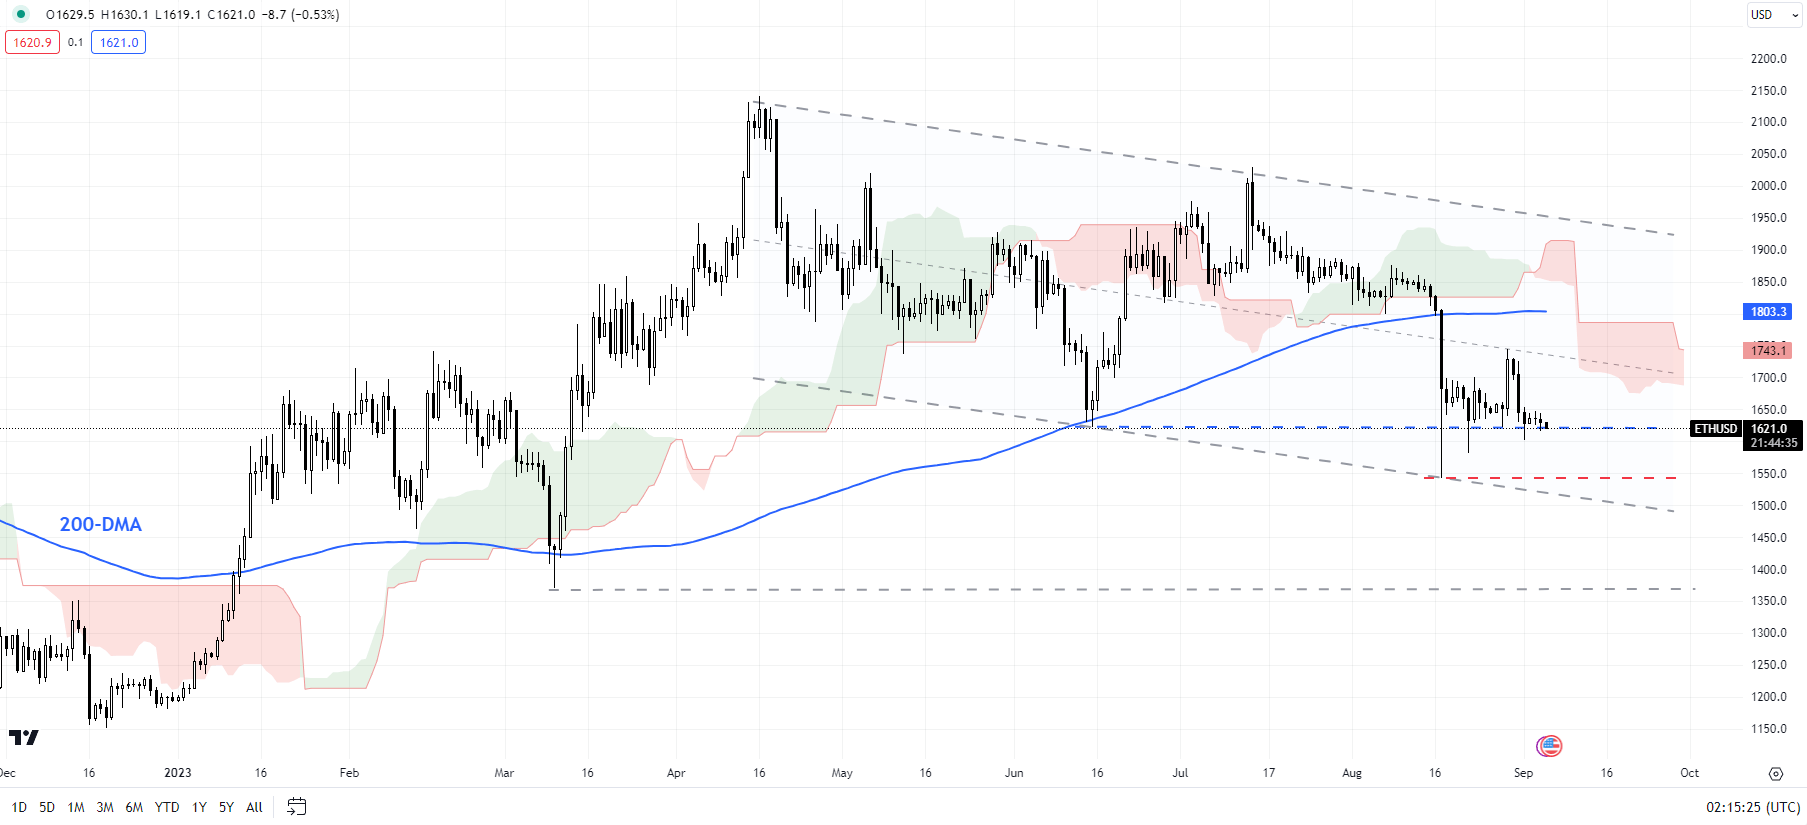
Ethereum appears to be struggling to hold above a vital floor at the June low of 1620. This support is crucial for the broader recovery from the end of 2022 to continue. Any break below would confirm that the bullish bias had dissipated. Such a fall would initially open the way toward the March low of 1370, with major support at the 2022 low of 880.

ETH/USD Daily Chart

image4.png

Like Bitcoin, ETH/USD has been under the influence of the bearish Ichimoku cloud cover on the weekly charts. In recent months, Ethereum hasn’t been able to clear past the upper edge of the cloud on the weekly charts, roughly coinciding with a slightly upward sloping trendline from 2021. ETH/USD’s inability to rise toward the top of the cloud cover, in comparison with BTC/USD, reflects its relative weakness. For more discussion, see “Is the Rally Over in Bitcoin & Ethereum? BTC/USD & ETH/USD Price Setups,” published August 23.

GBP/JPY Forecast – British Pound Rallies Against Yen

GBP/JPY Forecast – British Pound Rallies Against Yen

British Pound vs Japanese Yen Technical Analysis

The British pound has rallied during the trading session on Monday, reaching the ¥185 level. This is an area that a lot of people will pay close attention to, as it has been a bit of a magnet for price, therefore it’s likely that we continue to see a lot of choppy behavior. The ¥187 level above is a resistance barrier. If we can break above there, then the market could go much higher, perhaps reaching toward the ¥190 level.

Trading Derivatives carries a high level of risk to your capital and you should only trade with money you can afford to lose. Trading Derivatives may not be suitable for all investors, so please ensure that you fully understand the risks involved, and seek independent advice if necessary. A Product Disclosure Statement (PDS) can be obtained either from this website or on request from our offices and should be considered before entering into a transaction with us. Raw Spread accounts offer spreads from 0.0 pips with a commission charge of USD $3.50 per 100k traded. Standard account offer spreads from 1 pips with no additional commission charges. Spreads on CFD indices start at 0.4 points. The information on this site is not directed at residents in any country or jurisdiction where such distribution or use would be contrary to local law or regulation.

All things being equal, you should keep in mind that we are in a huge uptrend, and of course the Bank of Japan does everything he can to keep interest rates lower in that country, thereby driving down the value of the yen. This has been universal, and not just against the British pound but it’s also worth noting that the British pound has a huge interest-rate differential between it and the Japanese yen, thereby making this a pair that offers quite a bit of swap if you just hang onto it, and that is likely what is driving this market overall.

Pullbacks at this point will have to contend with the ¥183 level, and then perhaps even the 50-Day EMA underneath. All things being equal, this is a market that I think continues to offer a “buy on the pullbacks” type of scenario, and I do think that given enough time we go much higher. If we can break out above the recent highs, then I believe that the British pound will go looking to reach the ¥190 level, and then possibly even higher than that to reach the ¥200 level.

In general, I think you continue to buy the dips and ignore selling. If we do sell off from here, the 50-Day EMA and the ¥180 level both could offer plenty of support. Ultimately, I think you have a scenario which will continue to see a lot of volatility, but I do believe that given enough time we will continue to go higher and therefore I have no interest in shorting, at least not until we break down below the ¥180 level and of course the Bank of Japan changes its overall attitude.

Gold Price Forecast – Gold Markets Quiet on Labor Day

Gold Price Forecast – Gold Markets Quiet on Labor Day

Gold Market Technical Analysis

Gold markets initially tried to rally a bit during the trading session on Monday but gave back those gains to show signs of hesitation. At this point, the market is likely to continue to see a lot of noisy behavior, as there are a lot of questions as to how the Federal Reserve is going to treat the economy and perhaps monetary policy. At this point, the market seems to be comfortable hanging around the $1970 level, and we did of course see an attempt to break out on Friday, but then turned around to show signs of hesitation.

Trading Derivatives carries a high level of risk to your capital and you should only trade with money you can afford to lose. Trading Derivatives may not be suitable for all investors, so please ensure that you fully understand the risks involved, and seek independent advice if necessary. A Product Disclosure Statement (PDS) can be obtained either from this website or on request from our offices and should be considered before entering into a transaction with us. Raw Spread accounts offer spreads from 0.0 pips with a commission charge of USD $3.50 per 100k traded. Standard account offer spreads from 1 pips with no additional commission charges. Spreads on CFD indices start at 0.4 points. The information on this site is not directed at residents in any country or jurisdiction where such distribution or use would be contrary to local law or regulation.

The Monday session of course featured Labor Day, so the lack of liquidity would be a major issue. Because of this, I don’t read too much into the candlestick on Monday, but it does look like we are probably more likely than not going to pull back in order to find support. On the other hand, if we do break above the Friday candlestick, then we go looking to the $2000 level. The $2000 level of course is a large, round, psychologically significant figure, and an area where you would see a lot of noisy behavior. If we can take that out, then it’s likely that the market could go looking to the $2100 level.

Alternatively, if we were to break down below the 200-Day EMA, then we would challenge the $1900 level. The $1900 level of course is an area that previously has been supported, and therefore I think a lot of people would be paying close attention to that area. If we were to break down through there, then we could see a major selloff, but right now it does not look likely to happen. That being said, the market is likely to continue to see a lot of noisy behavior, and therefore it’s likely that you need to be cautious with your position sizing as we try to sort things out. Eventually, things will become a little bit more clear, but right now, it looks like we still have some fighting to do.

Silver Price Forecast – Silver Plunges in Thin Liquidity

Silver Price Forecast – Silver Plunges in Thin Liquidity

Silver Markets Technical Analysis

Silver has fallen again during the Monday session, as we continue to see a lot of negativity. That being said, we are also at the top of the major consolidation area, so that of course is something worth paying attention to. With this being the case, I think we probably go looking to the 50-Day EMA, an area that of course a lot of people will pay close attention to. Breaking down below that level then opens up the 200-Day EMA, and then possibly the $22.50 level after that.

Trading Derivatives carries a high level of risk to your capital and you should only trade with money you can afford to lose. Trading Derivatives may not be suitable for all investors, so please ensure that you fully understand the risks involved, and seek independent advice if necessary. A Product Disclosure Statement (PDS) can be obtained either from this website or on request from our offices and should be considered before entering into a transaction with us. Raw Spread accounts offer spreads from 0.0 pips with a commission charge of USD $3.50 per 100k traded. Standard account offer spreads from 1 pips with no additional commission charges. Spreads on CFD indices start at 0.4 points. The information on this site is not directed at residents in any country or jurisdiction where such distribution or use would be contrary to local law or regulation.

All things being equal, we could rally from here but it looks as if the $25.50 level continues to offer a lot of resistance, and right now we just don’t have a reason to do anything along the lines of a longer-term “buy-and-hold” strategy, it looks like we are just simply hanging around in this same range that we have been in for most of the year.

The biggest driver of where silver goes next is going to be the Federal Reserve, and interest rates coming out of that central bank. If interest rates do in fact start to drop, then it’s likely that the market would probably go looking to send a silver much higher. In general, the market is likely to see a lot of volatility, but if we could break out above the Wednesday candlestick of last week, then it’s possible that the silver market goes looking to the $26.50 level.

In general, this is a situation where I think you continue to see a lot of noisy behavior, and of course silver is known for being so violently volatile anyway. You need to be cautious with the position sizing, as sudden moves in the futures markets of course can cause a lot of trouble. You should also keep in mind that the Monday session was Labor Day in the United States, so there was a serious lack of volume. This will pick up again during the trading session on Tuesday, but at this point it looks like we are simply seeing a lot of profit-taking at the top of the range that a lot of people were very well aware of.

EUR/USD Forecast – The Euro Bounces From a Trendline

EUR/USD Forecast – The Euro Bounces From a Trendline

Euro vs US Dollar Technical Analysis

The euro rallied a bit during the trading session on Monday, bouncing from the uptrend line that people have been paying so much attention to. Furthermore, we are sitting right around the 200-Day EMA, an indicator that of course a lot of people paid attention to. That being said, the market is also trying to sort out what to do next, but keep in mind that the market is also having to deal with the fact that it was Labor Day in the United States, so therefore a lack of liquidity would make quite a bit of sense. If we can break above the candlestick from the Friday session, and by extension the 50-Day EMA, that would be a major turnaround.

Trading Derivatives carries a high level of risk to your capital and you should only trade with money you can afford to lose. Trading Derivatives may not be suitable for all investors, so please ensure that you fully understand the risks involved, and seek independent advice if necessary. A Product Disclosure Statement (PDS) can be obtained either from this website or on request from our offices and should be considered before entering into a transaction with us. Raw Spread accounts offer spreads from 0.0 pips with a commission charge of USD $3.50 per 100k traded. Standard account offer spreads from 1 pips with no additional commission charges. Spreads on CFD indices start at 0.4 points. The information on this site is not directed at residents in any country or jurisdiction where such distribution or use would be contrary to local law or regulation.

Underneath, the 1.0750 level is an area that people will be paying close attention to, because if we were to break below that level, it could descend quite a bit of downward pressure, perhaps continuing what we have seen as of late. At this point, we need to pay close attention to this area, due to the fact that we are at the bottom of the channel and now we are paying close attention to whether or not we can pick up enough momentum of the make a bigger move. After all, most traders are coming back from summer break right now, and markets could start to make more substantial moves. All things being equal, I think one of the important factors to consider is to know when we finally do break out of this range. The next couple of days could be very noisy, but given enough time we will eventually see the trend sort itself out for the fall season.

Because of this, I will be paying close attention for the next day or 2, but eventually will be putting money to work in whichever way we break. If we break to the upside, then we could see a move toward the 1.12 level. On the other hand, we break down below the 1.0750 level, then it opens up a move down to the 1.05 level underneath. Ultimately, I think we continue to see a lot of volatility, but sooner or later we have to make that decision.

EUR/USD Prices Forecast: German Economy’s Wobble Echoes in the Euro Zone

EUR/USD Prices Forecast: German Economy’s Wobble Echoes in the Euro Zone

Euro’s Subtle Climb Amid U.S. Economic Signals

The EUR/USD experienced a mild upturn against the U.S. Dollar on Monday. With U.S. banks observing a holiday, trading volumes remained subdued. This tepid activity underscores the market’s processing of the recent U.S. jobs data.

Released on Friday, the data presented mixed signals: while job growth accelerated in August, unemployment hit 3.8% and wage growth decelerated. Additionally, job figures were revised downwards for June and July by 110,000.

Trading Derivatives carries a high level of risk to your capital and you should only trade with money you can afford to lose. Trading Derivatives may not be suitable for all investors, so please ensure that you fully understand the risks involved, and seek independent advice if necessary. A Product Disclosure Statement (PDS) can be obtained either from this website or on request from our offices and should be considered before entering into a transaction with us. Raw Spread accounts offer spreads from 0.0 pips with a commission charge of USD $3.50 per 100k traded. Standard account offer spreads from 1 pips with no additional commission charges. Spreads on CFD indices start at 0.4 points. The information on this site is not directed at residents in any country or jurisdiction where such distribution or use would be contrary to local law or regulation.

Reflecting the mixed nature of this report, the financial community’s popular “Goldilocks” metaphor seems fitting, suggesting a neither too hot nor too cold economic situation. Current market sentiments anticipate a 93% likelihood of the Federal Reserve maintaining interest rates this month, with a significant tilt towards no rate hikes for the year.

Euro Zone’s Morale Dips, Spotlight on Germany

Domestic sentiments within the Euro zone have soured, largely driven by Germany’s faltering economy. A recent survey released on Monday pointed to a decline in the Sentix index for the Euro zone, slipping to -21.5 in September from its previous -18.9 in August. Germany’s deteriorating economic landscape, as emphasized by Sentix Managing Director Manfred Huebner, is not only reminiscent of the initial COVID-19 lockdown phase in July 2020 but also harks back to the lows of the 2008/2009 financial downturn. Huebner attributes this slump to a combination of political missteps and the ongoing energy crisis.

German Trade Dynamics Under Scrutiny

In terms of trade, Germany’s July export figures declined by a modest 0.9%, contrary to the anticipated 1.5% dip, indicating a dwindling global demand. Once a robust pillar, trade now poses challenges for the German economy. Several factors are at play: disruptions in the supply chain, an evolving global market, and China’s shift towards in-house production. Meanwhile, Germany saw a rise in imports by 1.4% in July, leading to a trade surplus of 15.9 billion euros. However, the cumulative impact of weakened retail sales and export data for July suggests a shaky start to Q3 for Germany.

Short-term Forecast

The immediate economic horizon appears bearish. With Germany’s economy wobbling, its ramifications for the Euro zone are evident. Concurrently, the U.S.’s mixed economic indicators warrant cautious optimism. As global economic frailties persist, especially in pivotal economies like Germany, it remains essential for investors to navigate with prudence.

Technical Analysis

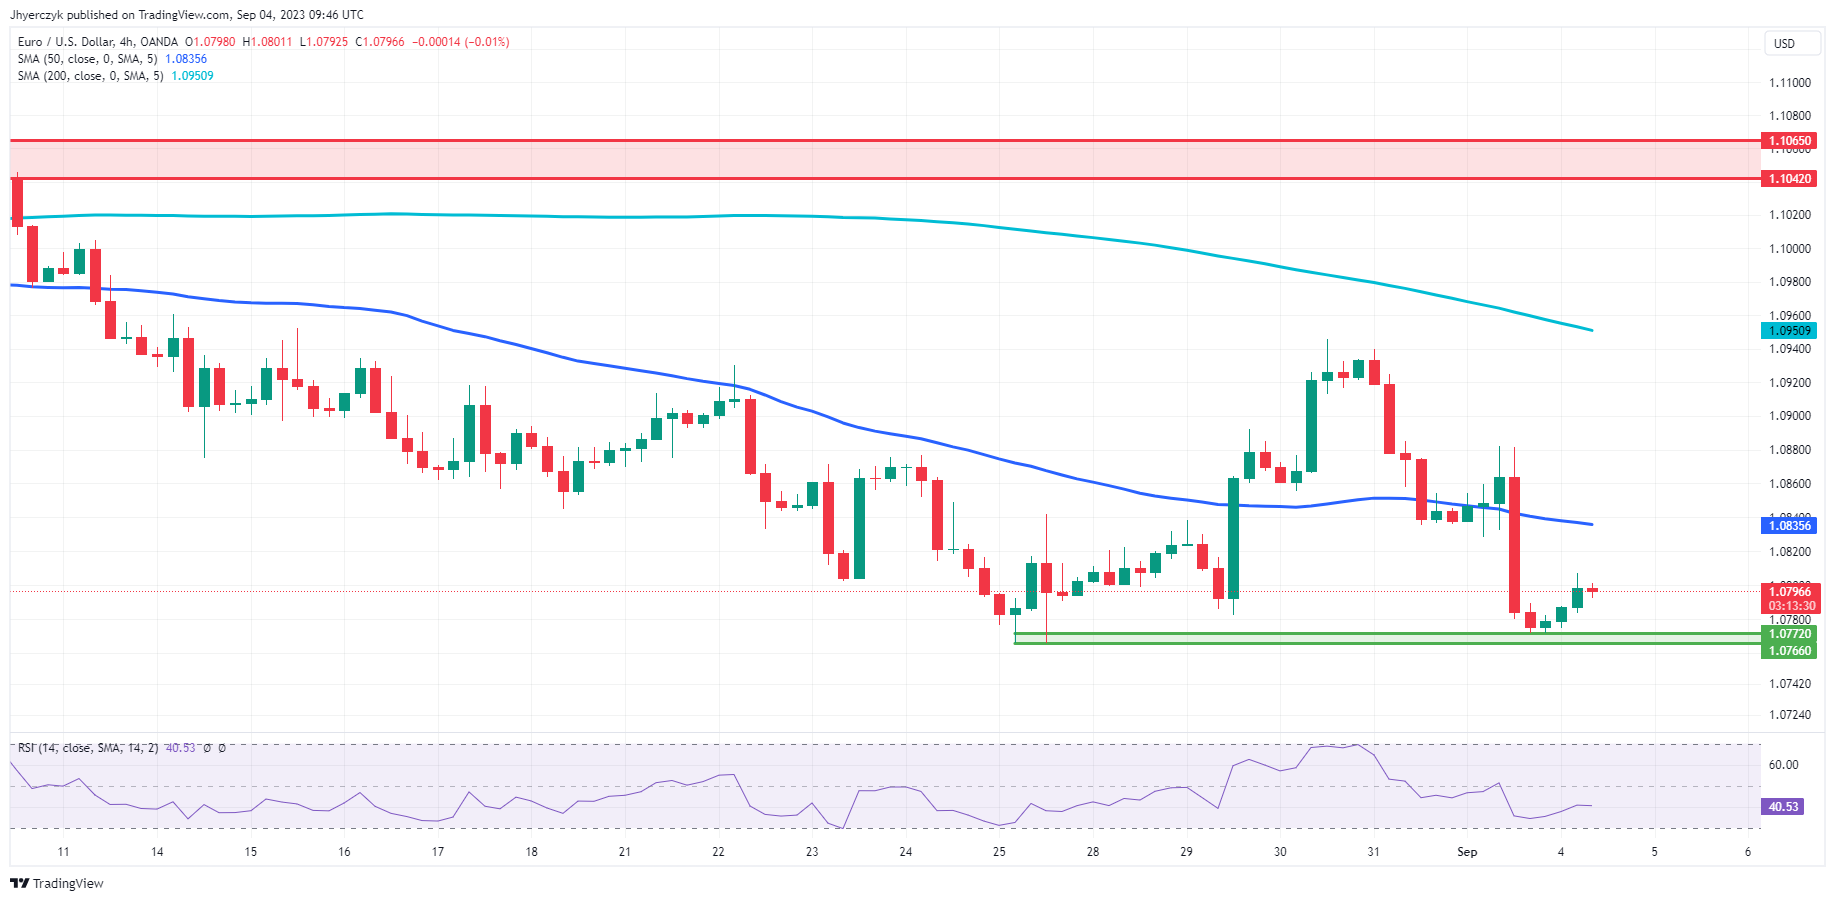
4-Hour EUR/USDThe current 4-hour price of EUR/USD is at 1.0798, unchanged from the previous 4-hour mark. It’s below both the 200-4H moving average (1.0951) and the 50-4H moving average (1.0836), indicating a bearish trend. The 14-4H RSI stands at 40.75, suggesting slightly weakened momentum. While it’s not in the oversold territory, it’s leaning that way.

The price is hovering just above the main support area (1.0772 to 1.0766) and below the main resistance area (1.1042 to 1.1065). Given these factors, the current market sentiment for EUR/USD on the 4-hour chart seems bearish.

Silver Prices Forecast: XAG/USD Reacts to US Jobs Data, Fed Policy Speculation

Silver Prices Forecast: XAG/USD Reacts to US Jobs Data, Fed Policy Speculation

Silver’s Rollercoaster Ride Amid Economic Indicators

Silver (XAG/USD) prices, after climbing to a one-month peak last week, faced a downturn this Monday, marking the potential for its fourth consecutive decline. The initial surge came in light of the dollar’s pullback and speculation around the U.S. Federal Reserve’s anticipated pause in interest rate hikes. However, the shine was short-lived. With Monday being a U.S. bank holiday, traders should be prepared for subdued price movements and below-par trading volume.

The Impact of U.S. Jobs Report on Treasury Yields

Friday saw a rise in Treasury yields, influenced heavily by the latest U.S. jobs data. On Monday, early signs indicated another uptick in the Treasury futures market. The unemployment rate for August registered at 3.8%, a jump from July’s 3.5%, and the highest since February 2022. Although there was a hint of optimism as the U.S. added more jobs than anticipated – a seasonally adjusted 187,000 versus the expected 170,000 – the figures for June and July were retroactively adjusted downwards by 110,000, tempering the initial enthusiasm.

Trading Derivatives carries a high level of risk to your capital and you should only trade with money you can afford to lose. Trading Derivatives may not be suitable for all investors, so please ensure that you fully understand the risks involved, and seek independent advice if necessary. A Product Disclosure Statement (PDS) can be obtained either from this website or on request from our offices and should be considered before entering into a transaction with us. Raw Spread accounts offer spreads from 0.0 pips with a commission charge of USD $3.50 per 100k traded. Standard account offer spreads from 1 pips with no additional commission charges. Spreads on CFD indices start at 0.4 points. The information on this site is not directed at residents in any country or jurisdiction where such distribution or use would be contrary to local law or regulation.

Fed’s Stance Amid Inflation Concerns

Chairman Jerome Powell’s recent comments hinting at possible further rate hikes to contain persistent inflation have ignited debates. The prevailing sentiment is that the weakening labor market might dissuade the Fed from more hikes this year. With the imminent Fed decisions in the offing, markets project a 93% probability of rates remaining unchanged in the September meeting, as per CME’s FedWatch tool. However, market predictions are split regarding the subsequent steps.

Economic Indicators Favor Silver

An array of economic signals, from moderating inflation to a relaxing labor market, strengthens the conviction that the U.S. economy is headed for a mild deceleration rather than a crash. The anticipated pause in interest rate hikes by the Fed might soften the dollar, providing a favorable environment for silver prices.

The Interplay Between Yields and Silver Prices

Given the inverse relationship between silver and interest rates, all eyes are on Treasury yields. With seven Fed officials expected to address the public this week, traders await insights that might shed light on decisions at the policy meeting scheduled for September 19-20. In the short term, a bearish sentiment prevails for silver, but the market remains hopeful for long-term gains.

Technical Analysis

4-Hour Silver (XAG/USD)The current 4-hour price of 24.18 is slightly below the previous 4-hour price of 24.27, indicating a minor downtrend. The price is currently sandwiched between the 200-4H moving average of 23.83 and the 50-4H moving average of 24.33, suggesting a narrowing trading range. The 14-4H RSI stands at 42.99, showing a weakened momentum but not in the oversold territory.

Price is positioned above the main support area (22.70 to 22.28) and below the main resistance area (25.00 to 25.27). In summary, the market for Silver (XAG/USD) on a 4-hour chart displays a mildly bearish sentiment, but it’s nearing key moving averages that could dictate its next move.

NASDAQ 100, Dow Jones, S&P 500 News: Outlook Points to Bullish Sentiment Amid Fed Rate Pause

NASDAQ 100, Dow Jones, S&P 500 News: Outlook Points to Bullish Sentiment Amid Fed Rate Pause

Rate Dispute and Economic Indicators Affect Markets

The S&P 500 closed higher on Friday as rising unemployment numbers fueled expectations of a halt in upcoming interest rate hikes. This change in employment figures indicates the Federal Reserve’s successful combat against inflation, hinting at an end to the interest rate hiking cycle. Such data suggests a potential dovish stance by the Fed, with predictions pointing to no rate hikes this month.

Weekly Market Snapshot

The S&P 500 rose by 2.50% over the week, achieving its best performance since June. The Dow and the Nasdaq followed suit, posting gains of 1.43% and 3.25%, respectively. However, trading volumes on U.S. exchanges appeared subdued, with only 8.9 billion shares being traded as compared to the 10.4 billion shares average over the past 20 sessions.

Trading Derivatives carries a high level of risk to your capital and you should only trade with money you can afford to lose. Trading Derivatives may not be suitable for all investors, so please ensure that you fully understand the risks involved, and seek independent advice if necessary. A Product Disclosure Statement (PDS) can be obtained either from this website or on request from our offices and should be considered before entering into a transaction with us. Raw Spread accounts offer spreads from 0.0 pips with a commission charge of USD $3.50 per 100k traded. Standard account offer spreads from 1 pips with no additional commission charges. Spreads on CFD indices start at 0.4 points. The information on this site is not directed at residents in any country or jurisdiction where such distribution or use would be contrary to local law or regulation.

Fed’s Anticipated Move

Amid rising unemployment and a visible slowdown in wage growth, the Federal Reserve’s stance appears to be tilting towards a more dovish approach. The recent macroeconomic indicators underscore the Fed’s progress in its battle against inflation, suggesting that the central bank could be nearing the conclusion of its interest rate hiking cycle.

With the interest rate futures indicating a 93% probability of rates remaining unchanged in the forthcoming meeting, it is becoming increasingly apparent that the Fed might opt for a pause in rate hikes to support the economy. This potential halt would be in response to both domestic employment data and global economic uncertainties, ensuring that the U.S. economy remains on a stable growth trajectory.

Company Highlights

Broadcom’s shares took a 5.5% hit after the chipmaker projected current-quarter revenue below expectations, despite outperforming earnings and revenue in the latest quarter. Lululemon Athletica rose by 6% following an earnings beat and subsequent revision in their annual profit and revenue forecasts. Additionally, Dell Technologies witnessed a surge of 21% after outperforming analysts’ second-quarter expectations.

Streaming Wars and Major Trades

Tensions between Disney and Charter Communications led to a decline in shares of major streaming firms. The unresolved distribution agreement saw major channels like ESPN go offline for Charter’s Spectrum cable service users. Consequently, stocks for Disney plummeted by 2.4%, Charter Communications by 3.6%, and Warner Bros Discovery faced a significant 12% drop. Meanwhile, Tesla’s decision to cut prices for some of its vehicles resulted in a 5% dip in their shares.

Short-Term Market Forecast

As we head into the next trading week, several factors will likely shape the short-term trajectory of the U.S. markets. The expectation of the Federal Reserve adopting a more dovish approach, given the prevailing macroeconomic conditions, could bolster market sentiment, leading to potential uptrends in major indices. However, investor sentiment might be tested by corporate undercurrents, particularly the streaming sector’s ongoing rate disputes and the repercussions from company-specific announcements.

The S&P 500’s robust performance over the past week may serve as a positive harbinger, but it’s imperative to monitor trading volumes as a key liquidity indicator. If volumes remain subdued, it may signal decreased confidence among traders.

In the corporate realm, the ongoing disputes between streaming giants could introduce volatility in the sector. While companies like Lululemon Athletica and Dell Technologies might continue to enjoy the positive momentum from their recent announcements, firms like Broadcom could face headwinds due to forecasted revenue challenges.

In conclusion, while the broader market outlook appears cautiously bullish, driven by anticipated Federal Reserve decisions, individual sectors and stocks may experience volatility, making it essential for investors to remain vigilant and diversified.

Sentix Index Signals Recession with Germany Casting Shadow Over Global Economy

Sentix Index Signals Recession with Germany Casting Shadow Over Global Economy

Overview

Economic indicators in September hint at further global downturn, led predominantly by Germany’s continued recession. The “first mover” in economic signals, the sentix economic index, is showing a bleak outlook across major economies.

State of the Global Economy

Germany, reminiscent of the 2008 financial aftermath or the initial 2020 lockdown, shows its fifth successive decline in the overall index. The sentix economic index for the Eurozone, at -21.5 points, suggests that the region remains mired in a recession. This recession is particularly felt in the service sector and is set to deepen. Amid these declining economic circumstances, Germany’s economic weight pulls the entire Eurozone down, challenging the ECB’s stance.

Germany’s Stumbling Economy

Germany, once Europe’s economic powerhouse, is now grappling with challenges reminiscent of the first Corona lockdown in 2020. Political leadership’s economic missteps and uncertainties stemming from energy crises have sunk the economy further into recession. Investors remain pessimistic, expecting the downtrend to persist.

US and Switzerland: Tipping Towards a Recession?

Previously resilient, the US economy now shows signs of vulnerability. A restrictive monetary policy combined with sluggish money and credit growth might be working against its growth prospects. Meanwhile, Switzerland’s economy, teetering on the edge, reflects declining investor confidence, with concerns of an impending recession.

Short-term Forecast

The overall sentiment, based on the mentioned indicators, leans bearish. As global economies grapple with downturns and recessions, the near future appears challenging, particularly for Germany and possibly the US and Switzerland.