EUR/USD Forecast: Inflation, PMIs, and ECB Voices – Unpacking the EUR USD Dynamics

EUR/USD Forecast: Inflation, PMIs, and ECB Voices – Unpacking the EUR USD Dynamics

On Monday, the EUR/USD gained 0.19%. Partially reversing a 0.65% loss from Friday, the EUR/USD ended the day at $1.07938. The EUR/USD fell to a low of $1.07716 before rising to a high of $1.08088.

Euro Area Services PMIs and ECB Commentary in Focus

ECB President Christine Lagarde will influence the European session. She emphasized high inflation on Monday. Any shift in stance would surprise the markets. The German economy is a concern for the euro area.

Trading Derivatives carries a high level of risk to your capital and you should only trade with money you can afford to lose. Trading Derivatives may not be suitable for all investors, so please ensure that you fully understand the risks involved, and seek independent advice if necessary. A Product Disclosure Statement (PDS) can be obtained either from this website or on request from our offices and should be considered before entering into a transaction with us. Raw Spread accounts offer spreads from 0.0 pips with a commission charge of USD $3.50 per 100k traded. Standard account offer spreads from 1 pips with no additional commission charges. Spreads on CFD indices start at 0.4 points. The information on this site is not directed at residents in any country or jurisdiction where such distribution or use would be contrary to local law or regulation.

Euro area service PMIs require attention. Declines in Italy and Spain would suggest a drop in the Eurozone PMI, impacting buyer interest. Preliminary data shows the Eurozone Services PMI decreased from 50.9 to 48.3 in August. Given the service sector’s contribution to the euro area economy, weaker PMIs would raise more economic red flags.

While ECB President Lagarde will garner the most interest, investors should monitor ECB Executive Board Member speeches. Luis de Guindos, Isabel Schnabel, and Edouard Fernandez-Bollo are on the calendar to speak today.

Fed Speeches to Limit the Influence of US Factory Orders

Bets on the Fed ceasing its monetary tightening increase the significance of Fed speeches. Hawkish FOMC comments could sway sentiment on interest rates. No FOMC members are on the calendar to speak, leaving media interactions to influence.

We anticipate Fed remarks to overshadow the effect of US factory orders on the EUR/USD. With the US services sector comprising over 70% of the economy, it has more significance.

Immediate Forecast: Lagarde and ECB Executive Board Members in Focus

Service sector PMIs are notable, but the market attention is on the ECB due to persistent inflation concerns. The ECB is unlikely to address Eurozone recession risks until after the September rate decision, but guidance beyond that will be impactful.

EUR/USD Price Action

Daily Chart

The EUR/USD remained below the 50-day and 200-day EMAs, sending bearish price signals. However, the EUR/USD held above the trend line and the $1.07635 support level this morning. A EUR/USD move through the 200-day EMA would give the bulls a run at the $1.08322 resistance level.

However, services PMIs and ECB commentary must align to support a breakout from the 200-day EMA. A larger-than-expected fall in the services PMI and less hawkish ECB commentary would see the EUR/USD break below the trend line. A break below the trend line would bring the $1.07635 support level and $1.0750 into play.

Considering the 14-Daily RSI at 39.16 and the EMA signals, the EUR/USD could retreat to $1.0750 before entering oversold territory.

EUR/USD Daily Chart sends bearish price signals.
EURUSD 050923 Daily Chart

4-Hourly Chart

The 4-Hourly Chart continues to reaffirm the near-term bearish trend. The EUR/USD sits below the 200-day and 50-day EMAs and the $1.08322 resistance level. However, the EUR/USD remains above the trend line and the $1.07635 support level.

Avoiding a break below the trend line would give the bulls a run at the $1.08322 resistance level and 50-day EMA. However, Services PMIs and ECB commentary must support a breakout.

A larger-than-expected fall in service PMIs and mixed ECB policy signals could see the EUR/USD break below the trend line. A break below the trend line would bring the $1.07635 support level and $1.0750 into play.

With the downward bias intact, the 14-4H RSI at 41.66 shows the EUR/USD has more room to fall before entering oversold territory.

4-Hourly Chart affirms bearish price signals.
EURUSD 050923 4 Hourly Chart
Eurozone Services Sector Contraction Spells Economic Concerns

Eurozone Services Sector Contraction Spells Economic Concerns

Eurozone’s Services Sector Under Pressure

The services sector of the Eurozone is facing a series of challenges, as depicted by the HCOB Eurozone Services PMI Business Activity Index, which slid from 50.9 in July to 47.9 in August, marking its first contraction since December 2022. The largest economies of the Eurozone, namely France, Germany, Italy, and Spain, all observed setbacks, with France and Germany registering the most substantial downturns.

New Business & Demand

The Eurozone’s services sector observed a reduction in the volume of new business for the second consecutive month, at the steepest rate since February 2021. The demand for services has seen a decline eight times since the second half of 2022. Specifically, France and Germany were primarily responsible for this contraction.

Outlook

While the services sector retains a positive perspective regarding future activities, the level of optimism remains consistent with the low of July 2023.

The drying up of new contracts in August led to a reduction in incomplete tasks, resulting in a cautious approach to hiring. The growth in employment in the sector slowed down, mirroring the rates from February 2021. In particular, Italian service companies reduced their workforce for the second month in succession.

Pricing Dynamics

August saw service providers witnessing the fastest input price increase in three months. Though these prices haven’t touched the highs of 2022, service charge inflation reduced to a 23-month low. Germany, however, still grappled with significant inflation.

Expert Commentary

Dr. Cyrus de la Rubia, the Chief Economist at Hamburg Commercial Bank, reflected upon the data and highlighted potential challenges for the Eurozone in the upcoming months. The once stabilizing services sector now appears to be a burden on the Eurozone’s economy. With the manufacturing sector yet to recover, the region’s economic growth could be at risk. This has resulted in a downward revision of the GDP, now standing at an anticipated decrease of -0.1% for Q3 2023.

The resurgence of input price increases raises concerns about the potential prolonged existence of high inflation, possibly exacerbated by wage hikes. As businesses have become wary of expansion, Dr. de la Rubia suggests that if the current conditions persist, these firms might transition towards reducing their workforce.

Germany and France, in particular, have registered substantial downturns in the service sector, while Italy and Spain have witnessed only mild declines. However, these countries might face steeper downturns in the future, considering the trends in the larger economies.

Silver Prices Forecast: XAG/USD Grapples with Dollar Might and Rate Uncertainties

Silver Prices Forecast: XAG/USD Grapples with Dollar Might and Rate Uncertainties

Ambiguous Economic Signals

Silver, symbolized as XAG/USD in the market, faces a tumultuous path. Traders are juggling the formidable dollar’s strength against the enigmatic U.S. Federal Reserve’s rate intentions. With a 93% market consensus leaning towards an unchanged rate stance in the upcoming month, the lukewarm labor market paints a puzzling picture for future rate modifications. Despite August showcasing robust job growth, there’s an unsettling increase in the unemployment rate to 3.8%, coupled with subdued wage increments.

Federal Reserve’s Rate Conundrum

The U.S. labor landscape is not without its paradoxes. While the economy added a promising number of jobs, prior months witnessed revisions. June and July’s combined job figures were slashed by 110,000. This, juxtaposed with the surge in unemployment, raises questions about the Federal Reserve’s next moves. Chairman Jerome Powell’s recent remarks about the need to quell inflation suggest a bias towards further rate hikes. Yet, a slackening labor domain might push the Fed towards a more cautious approach.

Trading Derivatives carries a high level of risk to your capital and you should only trade with money you can afford to lose. Trading Derivatives may not be suitable for all investors, so please ensure that you fully understand the risks involved, and seek independent advice if necessary. A Product Disclosure Statement (PDS) can be obtained either from this website or on request from our offices and should be considered before entering into a transaction with us. Raw Spread accounts offer spreads from 0.0 pips with a commission charge of USD $3.50 per 100k traded. Standard account offer spreads from 1 pips with no additional commission charges. Spreads on CFD indices start at 0.4 points. The information on this site is not directed at residents in any country or jurisdiction where such distribution or use would be contrary to local law or regulation.

Silver’s Price Pivots

The global arena noticed a marginal dip in spot silver, settling at $23.64 per ounce. Echoing this sentiment, U.S. silver futures too charted a minor descent. Amplifying these nuances is the resilient dollar, soaring near its peak since early June, making silver pricier for international stakeholders.

Interest Rate Dynamics and Inflationary Pressures

Despite a gentle drift towards a potential “soft landing” in the economic realm, hopes of drastic rate reductions are dissipating. If the Federal Reserve veers away from rate slashes, silver, seen as a non-yielding asset, might lose some sheen. In such a scenario, other yield-bearing assets might take center stage.

Market Projections: Treading Cautiously

The upcoming Federal Reserve September meet casts a significant shadow. Current market sentiments suggest a plateaued interest rate climate in the near horizon. Silver’s trajectory seems ensnared, flanked by the formidable dollar on one side and rate hike unpredictability on the other. This delicate balance hints at a neutral-to-bearish stance, urging traders to gear up for potential market tremors and to stay attuned to Federal Reserve announcements.

Technical Analysis

4-Hour Silver XAGUSDBased on the provided 4-hour chart data for Silver (XAG/USD), the current price stands at 23.61, slightly below the 200-4H moving average of 23.79, indicating a bearish tilt. This sentiment is further confirmed by the 50-4H moving average at 24.31, which is well above the current price. The 14-4H RSI reading of 28.24 shows an oversold condition, possibly heralding a near-term corrective rally but fundamentally underlining the bearish sentiment.

The price is hovering just above the main support area, ranging from 22.70 to 22.28, while substantially lower than the main resistance area between 25.00 and 25.27. Overall, the market sentiment appears decidedly bearish.

Gold Prices Forecast: Dollar Strength and Rate Uncertainty Challenge XAU/USD

Gold Prices Forecast: Dollar Strength and Rate Uncertainty Challenge XAU/USD

Gold’s Murky Path Amid Dollar Strength and Rate Hike Uncertainty

Gold (XAG/USD) prices have been pulled in different directions as traders weigh a robust dollar against uncertainties around the U.S. Federal Reserve’s interest rate policy. While the market priced in a 93% likelihood that the Fed will keep rates unchanged in the coming month, a more subdued labor market puts future rate hikes in question.

Shifting Fed Outlook

Recent data revealed mixed messages about the U.S. labor market. Job growth accelerated in August, yet the unemployment rate edged up to 3.8%, and wage gains showed restraint. These nuances have traders nearly convinced that the Federal Reserve will hit pause on rate hikes, leaving them to debate the timing and extent of future adjustments.

Trading Derivatives carries a high level of risk to your capital and you should only trade with money you can afford to lose. Trading Derivatives may not be suitable for all investors, so please ensure that you fully understand the risks involved, and seek independent advice if necessary. A Product Disclosure Statement (PDS) can be obtained either from this website or on request from our offices and should be considered before entering into a transaction with us. Raw Spread accounts offer spreads from 0.0 pips with a commission charge of USD $3.50 per 100k traded. Standard account offer spreads from 1 pips with no additional commission charges. Spreads on CFD indices start at 0.4 points. The information on this site is not directed at residents in any country or jurisdiction where such distribution or use would be contrary to local law or regulation.

Gold Price Movement

Spot gold saw a minor drop to $1,936.30 per ounce. Concurrently, U.S. gold futures also experienced a marginal decline. The strong dollar—hovering near its highest levels since early June—makes gold more expensive for international investors, capping its rally potential.

Inflation and Rate Cuts

Though labor conditions have eased and economic data points to a “soft landing,” expectations of aggressive rate cuts have dimmed. Gold’s attractiveness as a zero-interest-bearing asset could wane if the Fed holds off on rate cuts, making yields on other assets more appealing in comparison.

Short-Term Forecast: Neutral to Bearish

While the Fed’s September meeting looms large, market sentiment leans towards a steady interest rate environment, at least in the short term. Gold’s future gains are trapped between a rock—a strong U.S. dollar—and a hard place—an uncertain rate hike scenario. Traders should prepare for more volatility ahead as they look for cues in speeches from Federal Reserve officials throughout the week.

RBA Leaves the Cash Rate at 4.1% and the Door Open for More Hikes

RBA Leaves the Cash Rate at 4.1% and the Door Open for More Hikes

The RBA Interest Rate Decision

In line with expectations, the RBA left the cash rate at 4.1% this month. The decision to leave the cash rate unchanged shifted the investor focus to the RBA Rate Statement.

Salient points from the RBA Rate Statement included:

Inflation:

  • Inflation has passed its peak but will likely remain too high for some time.
  • Prices for service are driving inflationary pressures, with rent prices contributing.
  • The RBA expects inflation to return to the 2-3% target range by late 2025.

The Economy and the Labor Market:

  • The economy is in a below-trend phase and will likely remain so for some time.
  • High inflation is impacting consumer spending power, weighing on consumption.
  • Labor market conditions remain tight. However, the Board expects the weaker economic environment to push the unemployment rate to 4.5% in 2024.
  • Wage growth has accelerated but remains aligned with the inflation target.

Uncertainties:

  • Service price inflation has been resilient globally, and Australia may experience a similar trend.
  • The outlook for household spending despite some finding relief from higher house prices, savings, and higher interest income.
  • The Chinese economy.

The Board concluded further monetary policy tightening will remain dependent on data. However, the Board will also assess ongoing risks. The focal points will include the global economy, household spending, and inflation and labor market expectations.

Notably, the RBA did not signal an end to the policy-tightening cycle, leaving the option for more rate hikes on the table.

AUD/USD Reaction to the RBA Decision and Rate Statement

Before the RBA interest rate decision, the AUD/USD rose to a pre-stat high of $0.64646 before sliding to a low of $0.64211.

However, in response to the RBA interest rate decision and rate statement, the AUD/USD fell to a post-decision low of $0.64161 before rising to a high of $0.64303.

This morning, the AUD/USD was down 0.54% to $0.64254.

AUD/USD shows a mixed reaction to the RBA Rate Statement.
050923 AUDUSD 30 Minute Chart

Up Next

Eurozone services PMIs and US factory orders will influence market risk sentiment. A larger-than-expected decline in euro area services PMIs would signal a deteriorating macroeconomic environment. US factory orders may also play a hand in market risk sentiment.

However, ECB and Fed commentary will need consideration throughout the day.

ECB President Lagarde kickstarts the European session. The ECB President will likely stick to the ‘inflation too high’ script. However, ECB Executive Board members could send mixed signals. ECB Executive Board Members Luis de Guindos, Isabel Schnabel, and Edouard Fernandez-Bollo are on the calendar to speak today.

No FOMC members are on the calendar to deliver speeches. However, comments with the media will draw interest. With the markets betting on the Fed hitting the brakes, hawkish chatter would test the dovish Fed bets.

GBP/USD Price Forecast: A Tale of Two Patterns

GBP/USD Price Forecast: A Tale of Two Patterns

GBPUSD FUNDAMENTAL BACKDROP

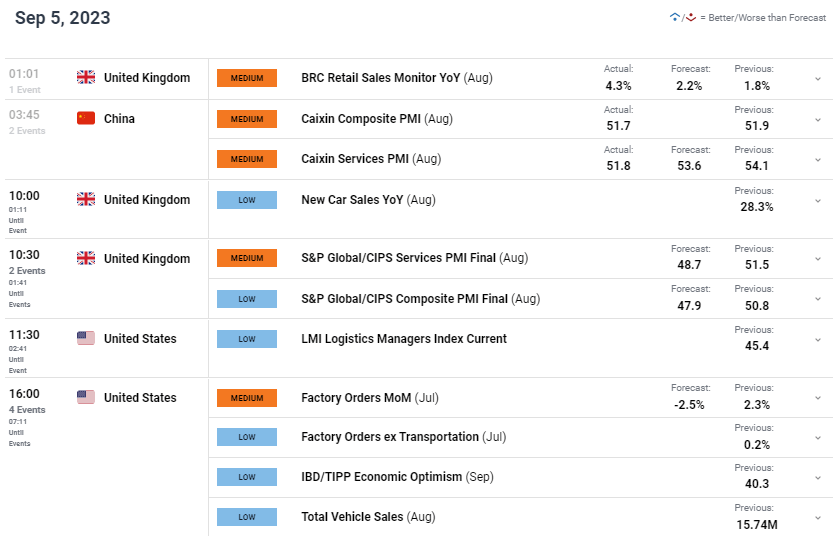
The British pound is now back below the 1.2600 handle once more despite some positive BRC retail sales data (see economic calendar below). The release printed the highest percentage increase since April and reflected a brief bout of optimism by consumers, spending large on food, health and beauty. The summer months may have contributed to this uptick in spending as well as moderating UK inflation.

While retail sales numbers were strong, the pound has yet to find support from markets due to Chinese services PMI’s slumping to its lowest level this year. The 51.8 read is swiftly approaching the midpoint 50 level that separates expansion from a contracting services sector. Recent Chinese economic data has been supportive of this slowdown and growth concerns continue to gain traction. The Chinese government has since issued statements to stimulate the economy but without any significant changes just yet, markets remain cautious.

Later today, UK PMI’s will come into focus but with estimates expected to hit 2023 lows, cable may be in for further downside to come. The upcoming US sessions should also provide some added volatility to markets after US Labor Day yesterday.

GBP/USD ECONOMIC CALENDAR (GMT +02:00)

image1.png

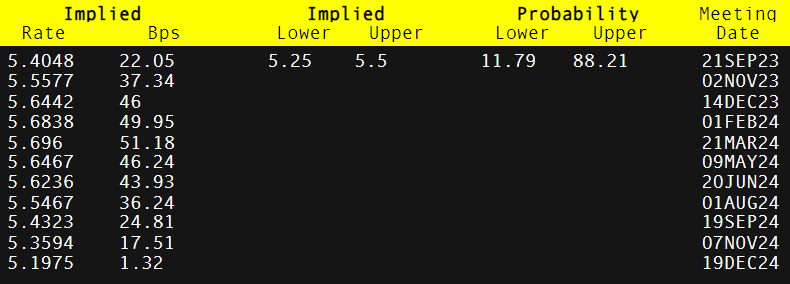
The Bank of England’s (BoE) market pricing (refer to table below) remains steadfast on a 25bps interest rate hike for September although the probability has softened from close to 100% to around 88% at present. With one more labor and CPI report prior to the rate announcement, I do not anticipate any change for September but a further drop in inflation and a weakening labor market may see some significant repricing thereafter.

BANK OF ENGLAND INTEREST RATE PROBABILITIES

image2.png

GBP/USD DAILY CHART

image3.png

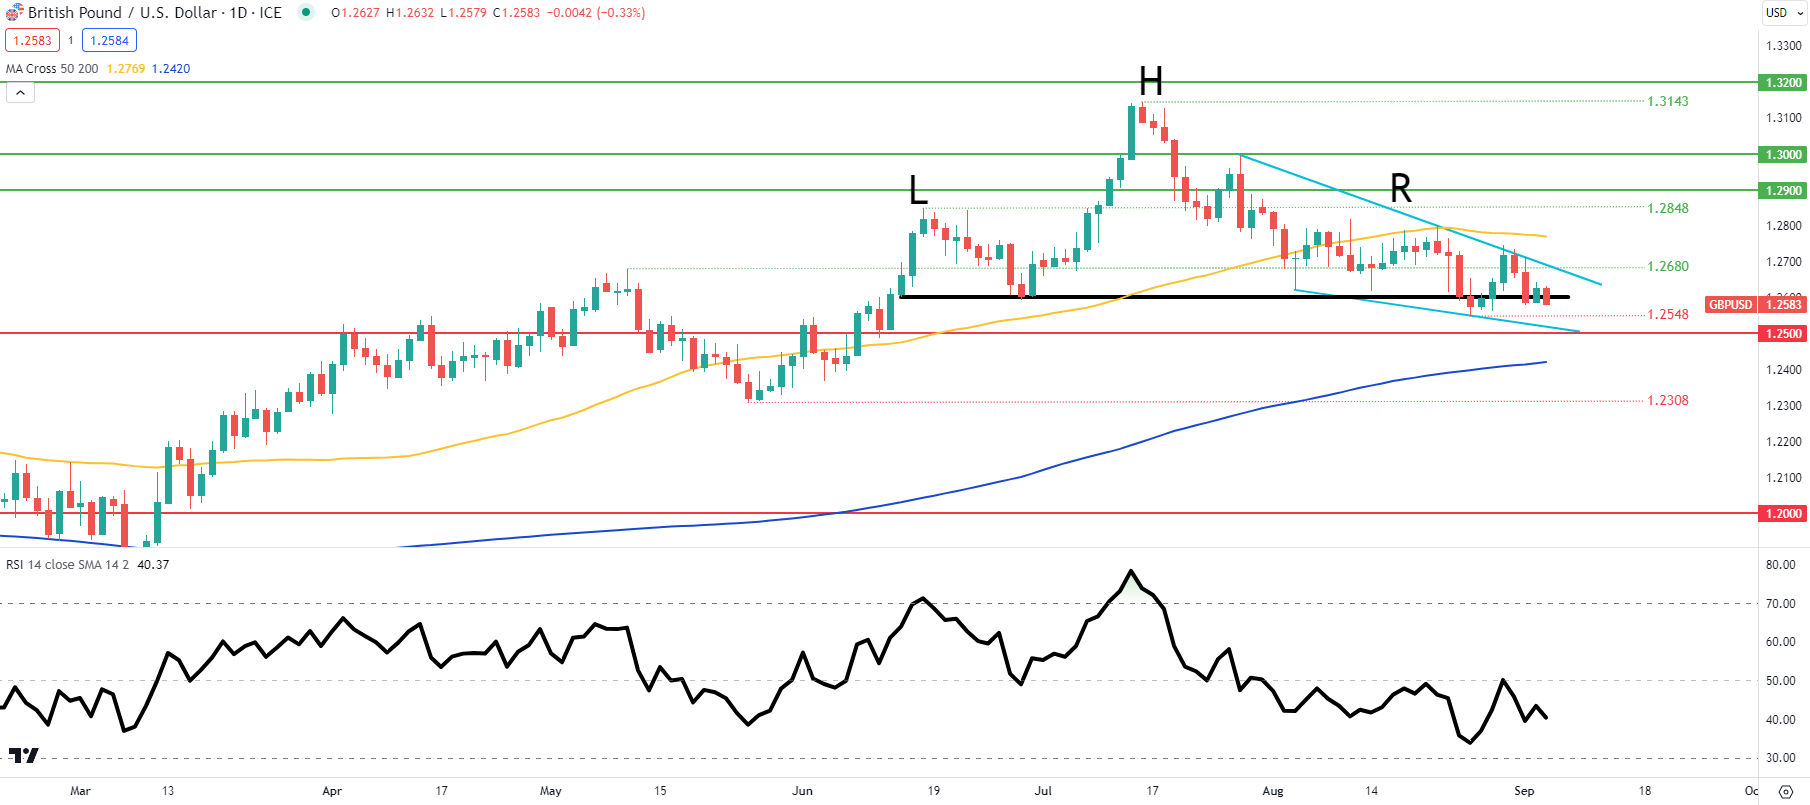
Price action on the daily cable chart above sees the pair sandwiched between a longer-term head and shoulders (black) and a short-term falling wedge (light blue). The latter tends to favor and upside breakout that could invalidate the H&S but the present state may favor a H&S breakout below the neckline. Bears have been tentative in their pursuit of a bearish breakout and I will be looking for a confirmation close below the 1.2548 swing low as a precursor to another leg lower.

Gold Price Steadies as US Real Yields Offset by Potential BRIC Demand. Lower XAU/USD?

Gold Price Steadies as US Real Yields Offset by Potential BRIC Demand. Lower XAU/USD?

The gold price continues to oscillate around US$ 1,940 going into Tuesday’s trading session as market headwinds might be offset by geopolitical factors that have seen volatility in the precious metal slide lower.

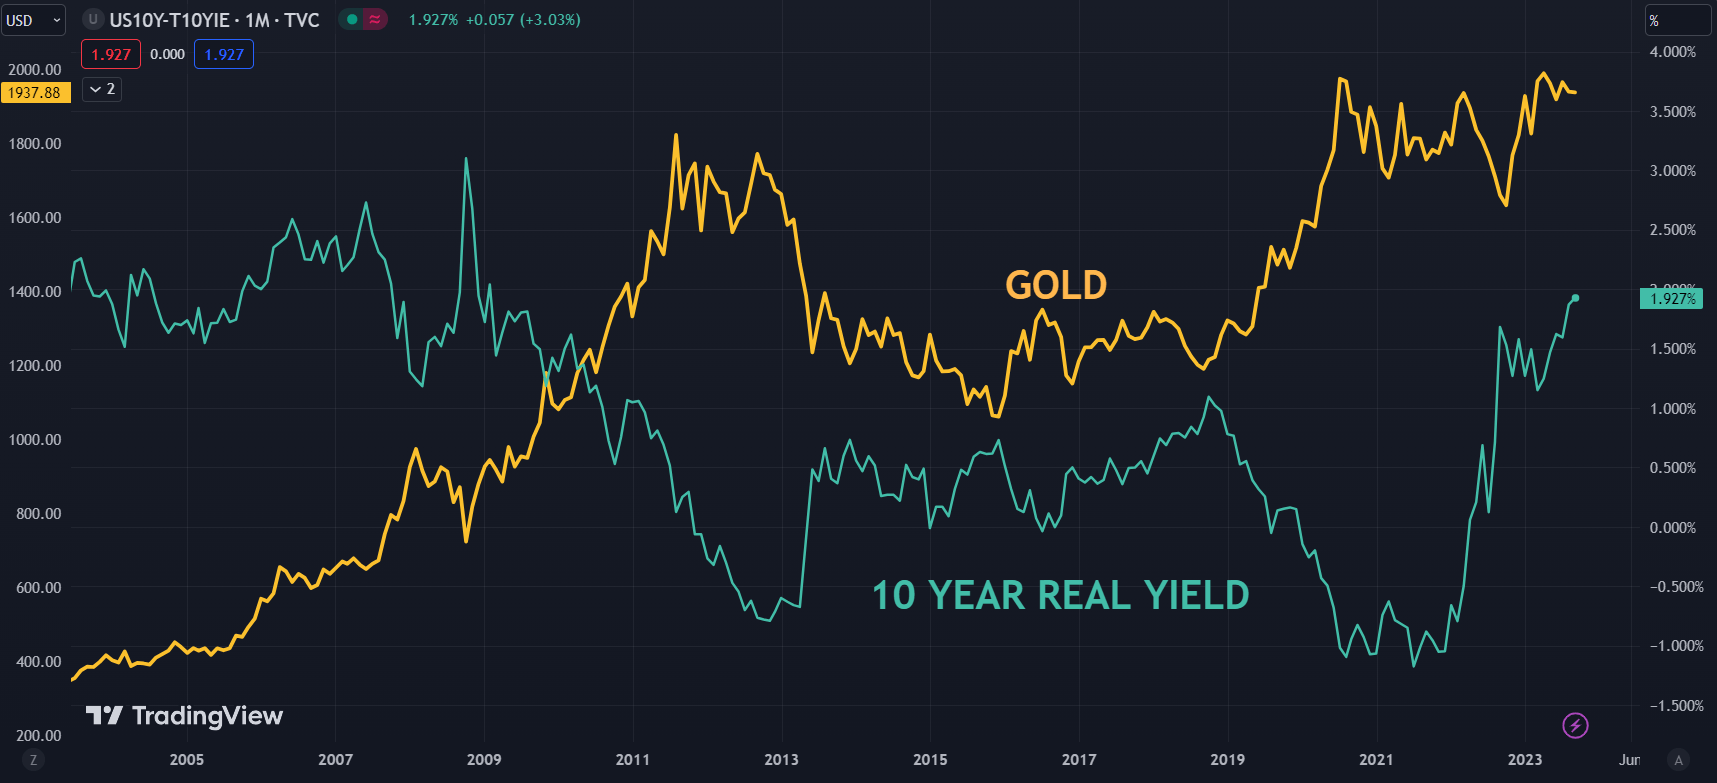
US real yields have been on the march higher for the better part of 2023 and recently stretched to a 14-year peak at the 10-year part of the curve, trading above 1.90%.

The real yield is the nominal yield less the market-priced inflation rate derived from Treasury inflation-protected securities (TIPS) for the same tenor.

The last time that real yields were this high was 2009, when spot gold was below US$ 1,000. More recently in 2018, when the real yield was near 1.0%, spot gold was under US$ 1,300 an ounce.

SPOT GOLD AGAINST US 10-YEAR REAL YIELD – THE BIGGER PICTURE

image1.png

Chart created in TradingView

Of course, there has been a lot of water under the bridge since then and the currents of demand have been tilted as the BRIC (Brazil, Russia, India and China) nations seek an alternative to the US Dollar as a reserve currency.

Much has recently been made of the potential for a gold-backed currency to allow these countries to bypass the US Dollar in international trade.

Such a system has proven to be a failure in the past for a multitude of reasons that are beyond the scope of this article. Refer to the Bretton Woods gold exchange for reference.

On a recent trip to Western Australia, one the largest physical gold-producing regions globally, a number of contacts highlighted that almost every ounce of the yellow metal currently being dug out of the ground was being put on a ship to China.

Such anecdotes of other BRIC members taking similar actions have been reported elsewhere. Keeping in mind that Australia, China and Russia are also the top producers of gold, it might be the case that gold hoarding has been a feature of the price action of late.

Looking ahead, a break of the recent range of US$ 1,885 – 1,900 could be the catalyst for the next notable move for XAU/USD. Click on the banner below to learn more about range trading.


Asia Day Ahead: RBA rate decision ahead, VIX hovers near year-to-date low

Asia Day Ahead: RBA rate decision ahead, VIX hovers near year-to-date low

With the US shut for Labour Day holiday, European indices were largely subdued overnight on some wait-and-see, failing to tap on gains in the earlier Asian session. European bond yields edged slightly higher, largely following through from last Friday’s moves. Despite the softer read in the recent US jobs report, the resilience in US Treasury yields to end last week seems to reflect some positioning for a high-for-longer rate outlook, potentially making provisions for upside risks to inflation ahead with higher oil prices and abating base effects.

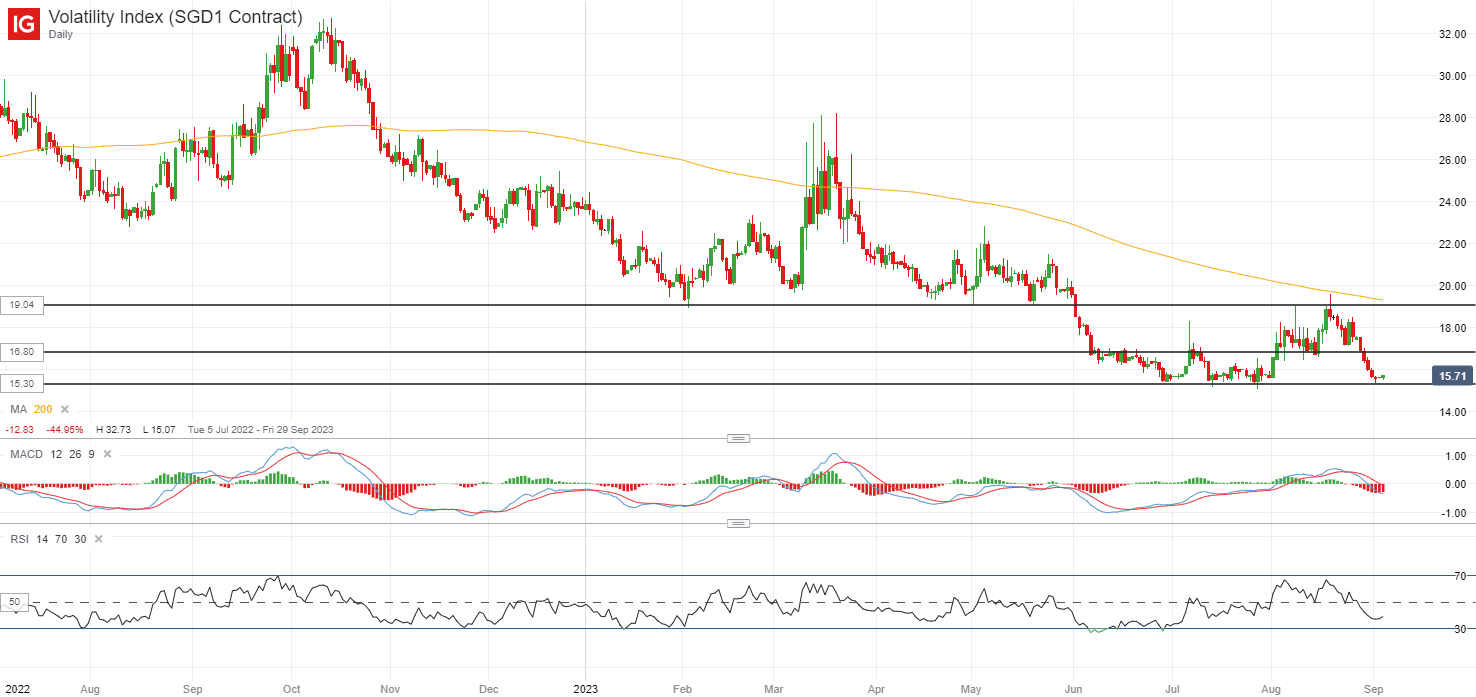
As the US markets return to trading today, clearer indications for the risk environment may be presented, with US equity futures just slightly underwater at the time of writing. Perhaps one to watch ahead may be the VIX, which has recently declined for six straight days to hover near its year-to-date low at the 15.30 level.

Current VIX levels still point towards a general risk-on environment, but given its negative correlation with the stock market, any attempt to bounce from its immediate horizontal support could translate to near-term downside pressure for US indices. On the other hand, a break to a new year-to-low could indicate abating stress for markets, with any move below the 15.30 level potentially paving the way to retest its 2018 low at the 13.50 level next.

image1.png

Source: IG charts

Asia Open

Asian stocks look set for a downbeat open, with Nikkei -0.12%, ASX -0.57% and KOSPI -0.26% at the time of writing. Recent property support measures have brought a relief rally for Chinese equities in yesterday’s session, with the Hang Seng Index up 2.5%. But as with the series of support measures that we have seen so far, whether gains can be sustained will still depend on the degree of policy success in translating to a turnaround in economic conditions ahead.

Today will leave the Reserve Bank of Australia (RBA) interest rate decision on the radar. Recent downside surprise in Australia’s inflation and weaker purchasing managers index (PMI) data have offered room for the central bank to keep rates on hold at the upcoming meeting, which is also the wide market consensus.

The focus instead may be on whether recent progress in inflation is sufficient to soften the RBA’s hawkish stance, given that there are still some hawkish bets in place that the RBA may have to tighten by another 25 basis-point (bp) by the end of this year.

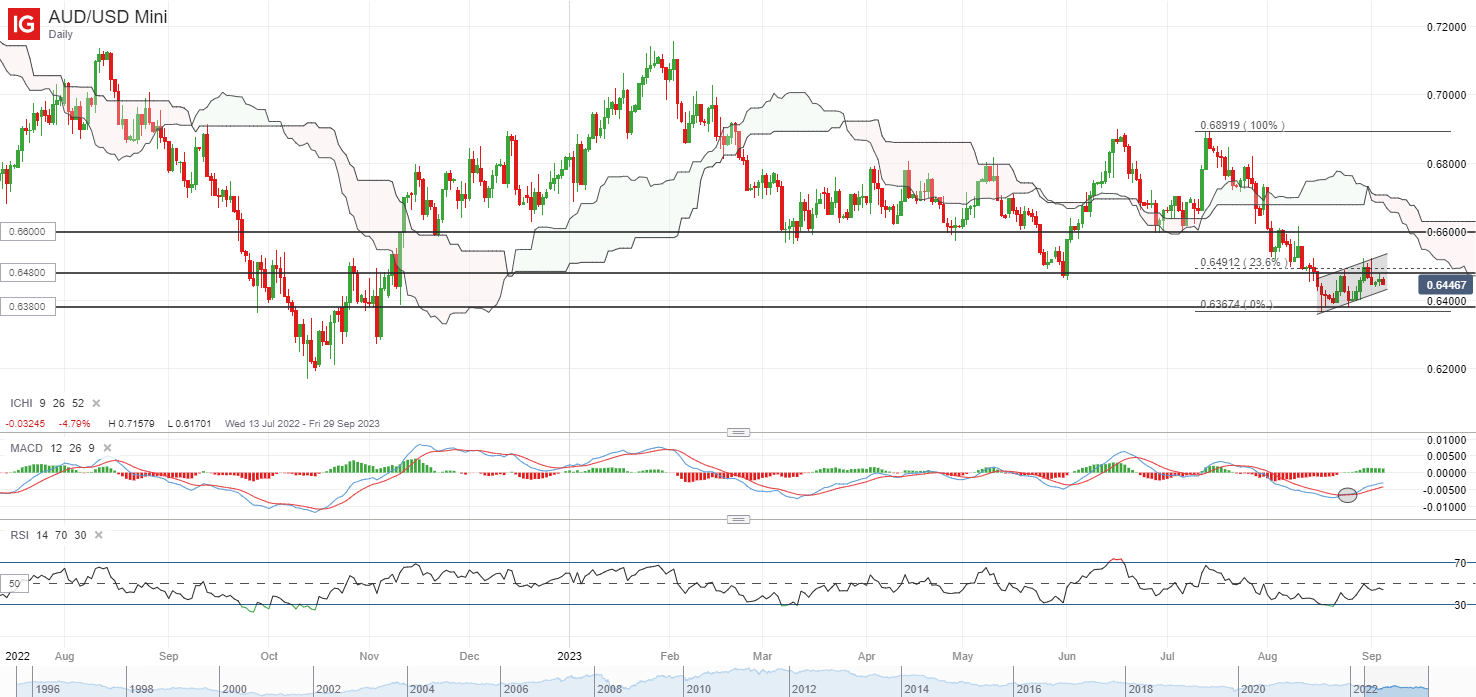
The AUD/USD has attempted to recover last week alongside the broader risk environment, but much may still await for now, having just reached the 23.6% Fibonacci level of retracement from its July peak to August 2023 bottom. While a bullish crossover on MACD was presented in the daily chart, the risks of a bearish flag formation remain, with a retest of the 0.650 level last Friday met with a bearish rejection. Any breakdown of the upward-sloping consolidation channel may pave the way for a continuation of the downward trend, while on the upside, the last Friday’s high may have to be overcome to signal buyers in greater control.

image2.png

Source: IG charts

On the watchlist: GBP/USD struggling to bounce off head-and-shoulder neckline for now

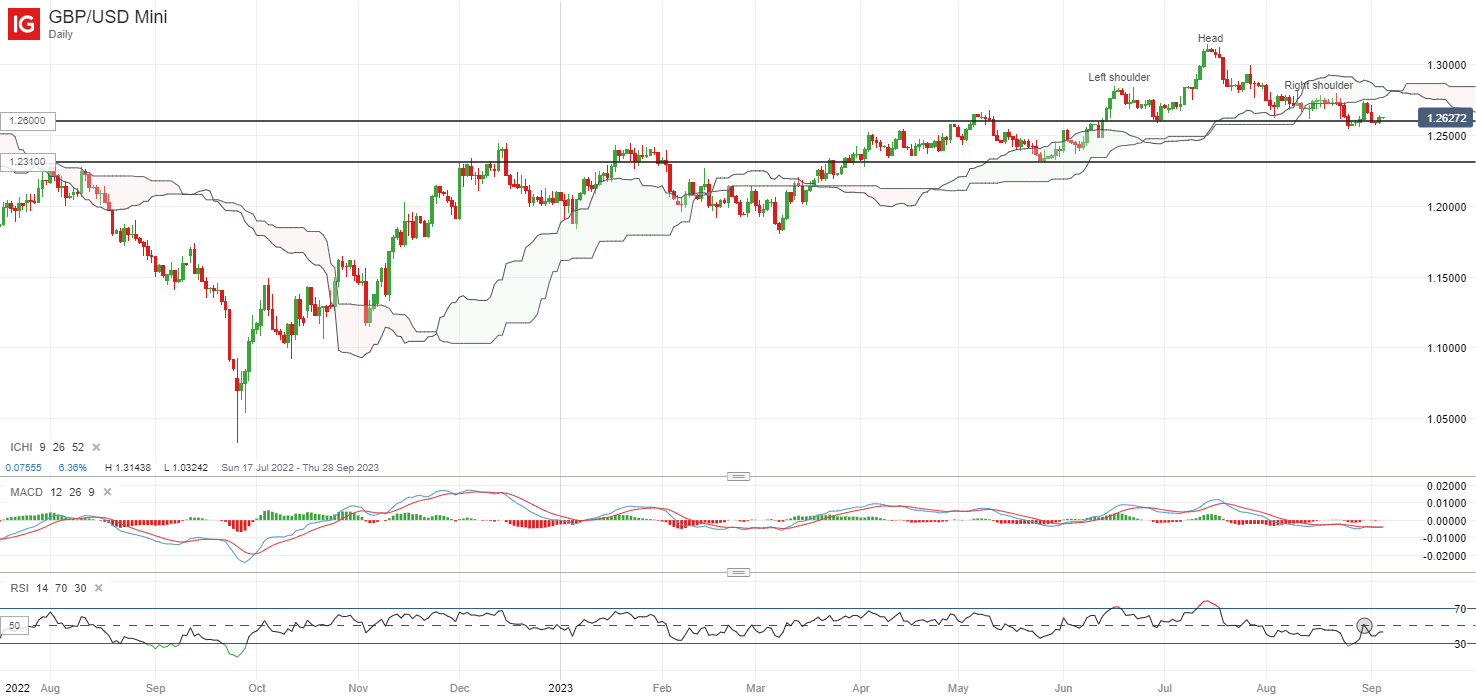
Having traded within a head-and-shoulder formation on the daily chart since June this year, recent attempt to bounce off the neckline at the 1.260 level has failed to find much follow-through amid strength in the US dollar to end last week.

On the daily chart, the RSI has struggled to cross back above the key 50 level over the past month, while the pair seems to be finding some resistance at the lower edge of its Ichimoku cloud pattern after a breakdown in late-August. The head-and-shoulder neckline at the 1.260 level is put to the test once again this week, with any failure to defend the level potentially paving the way towards the 1.231 level.

image3.png

Source: IG charts

MFF My Forex Funds Prop Firm Shutdown: What Happened?

MFF My Forex Funds Prop Firm Shutdown: What Happened?

In an unexpected turn of events, My Forex Funds, a well-known prop trading firm, faced an abrupt shutdown. Traders and investors associated with the firm were left bewildered as they received the news that provincial securities regulators in Canada and commodities regulators in the United States had issued orders preventing the firm from trading securities or accessing its bank accounts.

This sudden and drastic move has effectively frozen the operations of My Forex Funds. Traders are unable to access their funds, and the future of the firm hangs in the balance until these freeze orders are lifted or modified.

What Led to the Shutdown?

As of now, specific details about the concerns raised by regulators remain undisclosed. However, My Forex Funds has pledged to engage with these regulatory bodies to address their concerns. The first crucial step in this process will take place on September 11 in the United States, with another hearing scheduled later that same week in Canada. It is during these hearings that the fate of the freeze orders will be determined.

Turning to OFP: A Prop Firm You Can Trust

At times like these, traders are understandably concerned about the security and stability of their trading partners. If you’re a trader seeking a prop firm that abides by regulations and prioritizes the safety of your investments, consider OFP.

Unlike some firms, OFP is dedicated to maintaining a strong commitment to regulatory compliance and ensuring that traders’ interests are protected. We understand the importance of transparent and ethical business practices, and we are here to provide a stable trading environment for traders looking for a reliable partner in the industry.

In the midst of uncertainty, remember that there are prop firms like OFP that prioritize your peace of mind and security. We will not leave traders hanging, and we remain committed to upholding the highest standards of integrity in the trading world.

As My Forex Funds navigates the challenges ahead, we extend our support and encourage traders to explore the secure and compliant trading environment that we provide. Your trading journey is important to us, and we are here to help you succeed.

US Dollar Struggles at Resistance Amid Softening Data; EUR/USD, GBP/USD, USD/CAD

US Dollar Struggles at Resistance Amid Softening Data; EUR/USD, GBP/USD, USD/CAD

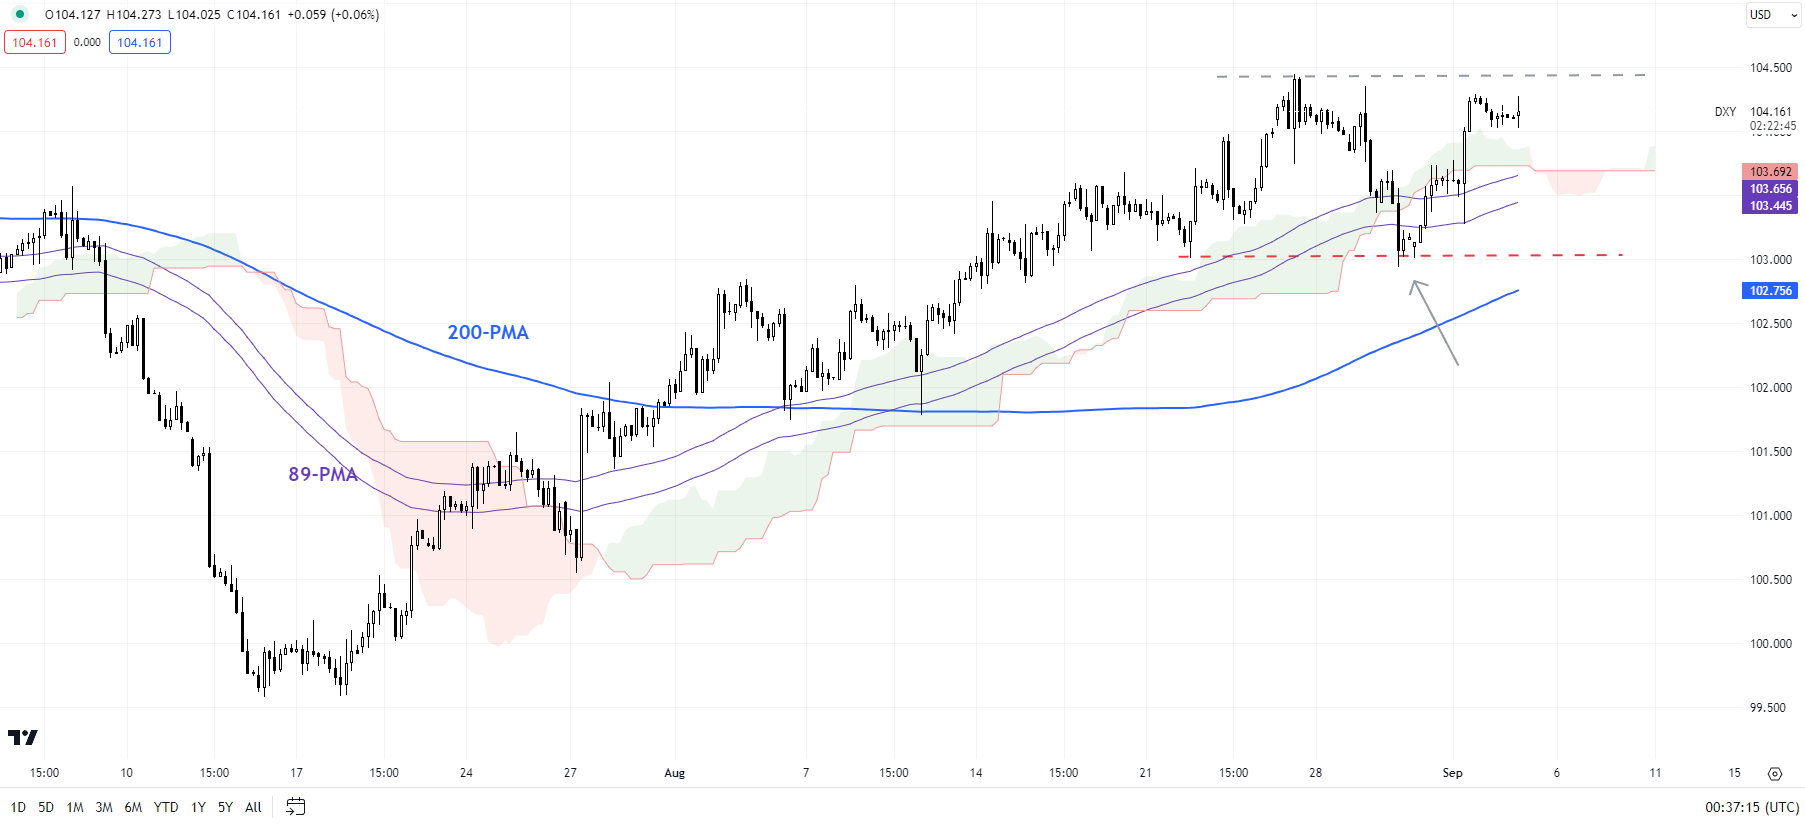
The recent struggle at key resistance reinforces the view that the US dollar’s (DXY Index) rally is losing steam as recent data eases concerns that the US economy is resurging.

The US Economic Surprise Index has rolled over from two-year highs in a sign that much of the optimism could be in the price. The ongoing disinflation coupled with early signs that the labor market could be cooling (unemployment jumped in August) has capped expectations of further tightening by the US Federal Reserve. Markets are now pricing in a more than 90% chance that the Fed will keep interest rates on hold when it meets later this month, with around 60% chance of no more rate hikes this year.

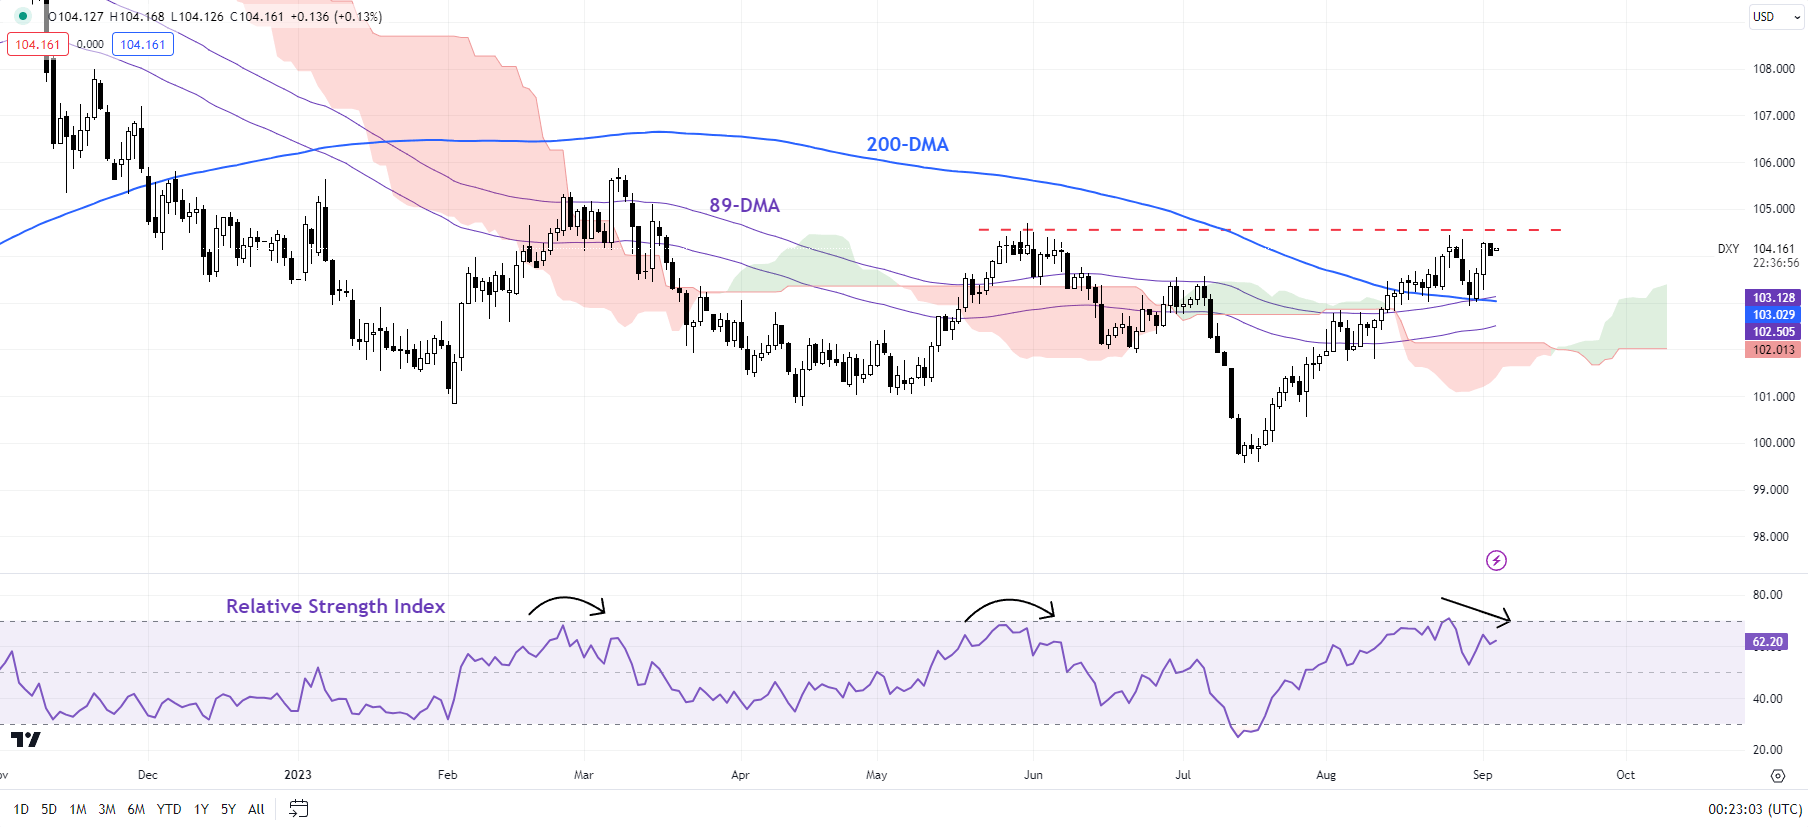
Moreover, the rapid support measures in recent months by China to revive the economy are providing a floor to sentiment, at least for now, weighing on the greenback. Having said that, the DXY Index would need to fall below 102.50 103.00 for the uptrend to reverse. For more discussion, see the previous update “US Dollar Looks Tired Ahead of Jackson Hole: EUR/USD, GBP/USD, USD/JPY Price Setups,” published August 22.

DXY Index (USD) Daily Chart

image1.png

On technical charts, the short-term bullish pressure remains intact after the DXY Index (USD index) rebounded last week from quite a strong converged floor at 102.50-1.0300, including the 89-period moving average and the lower edge of the Ichimoku cloud on the 240-minute charts. As highlighted in a recent update, the index needs to fall below the support for the uptrend to change. See “US Dollar Toppish Ahead of Powell; EUR/USD, AUD/USD, GBP/USD Price Setups,” published August 24.

DXY Index (USD) 240-Minute Chart

image2.png

Chart Created by Manish Jaradi Using TradingView

Zooming out, the index has been struggling to clear past a tough barrier at the May high of 104.70, slightly above the 200-day moving average. Negative divergence on the daily charts (declining momentum associated with flat index levels) is a sign that the index lacks the strength to break past the barrier, raising the risk of a retreat. For more discussion, see “US Dollar Flirts with Resistance After Powell; EUR/USD, GBP/USD, AUD/USD Price Action,” published August 28.

EUR/USD Weekly Chart

image3.png

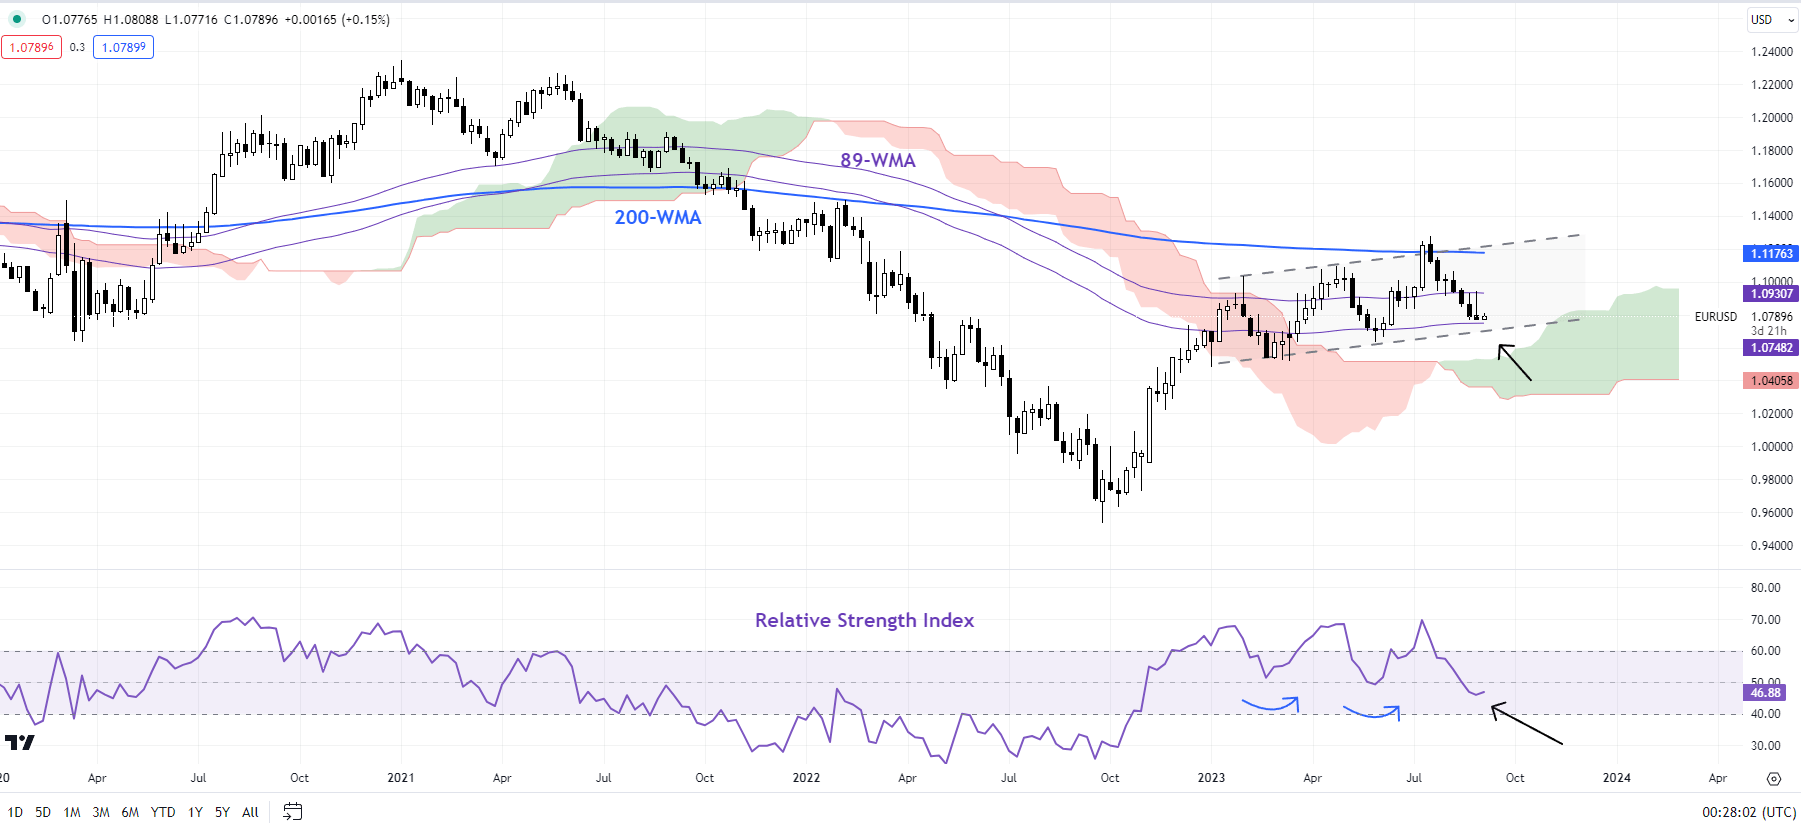
EUR/USD: Awaiting confirmation of a low

EUR/USD is near a fairly strong cushion on the 200-day moving average, coinciding with the lower edge of an upward-sloping channel, and the 89-week moving average. Despite the choppy price action since the beginning of 2023, the pair hasn’t made a lower low since late last year, suggesting that the broader bias remains up. However, any fall below 1.0500-1.0600 could threaten the uptrend. Meanwhile, EUR/USD is looking oversold, raising the prospect of a rebound. For any rebound to be material, the pair would need to cross above last week’s high of 1.0950.

GBP/USD Daily Chart

image4.png

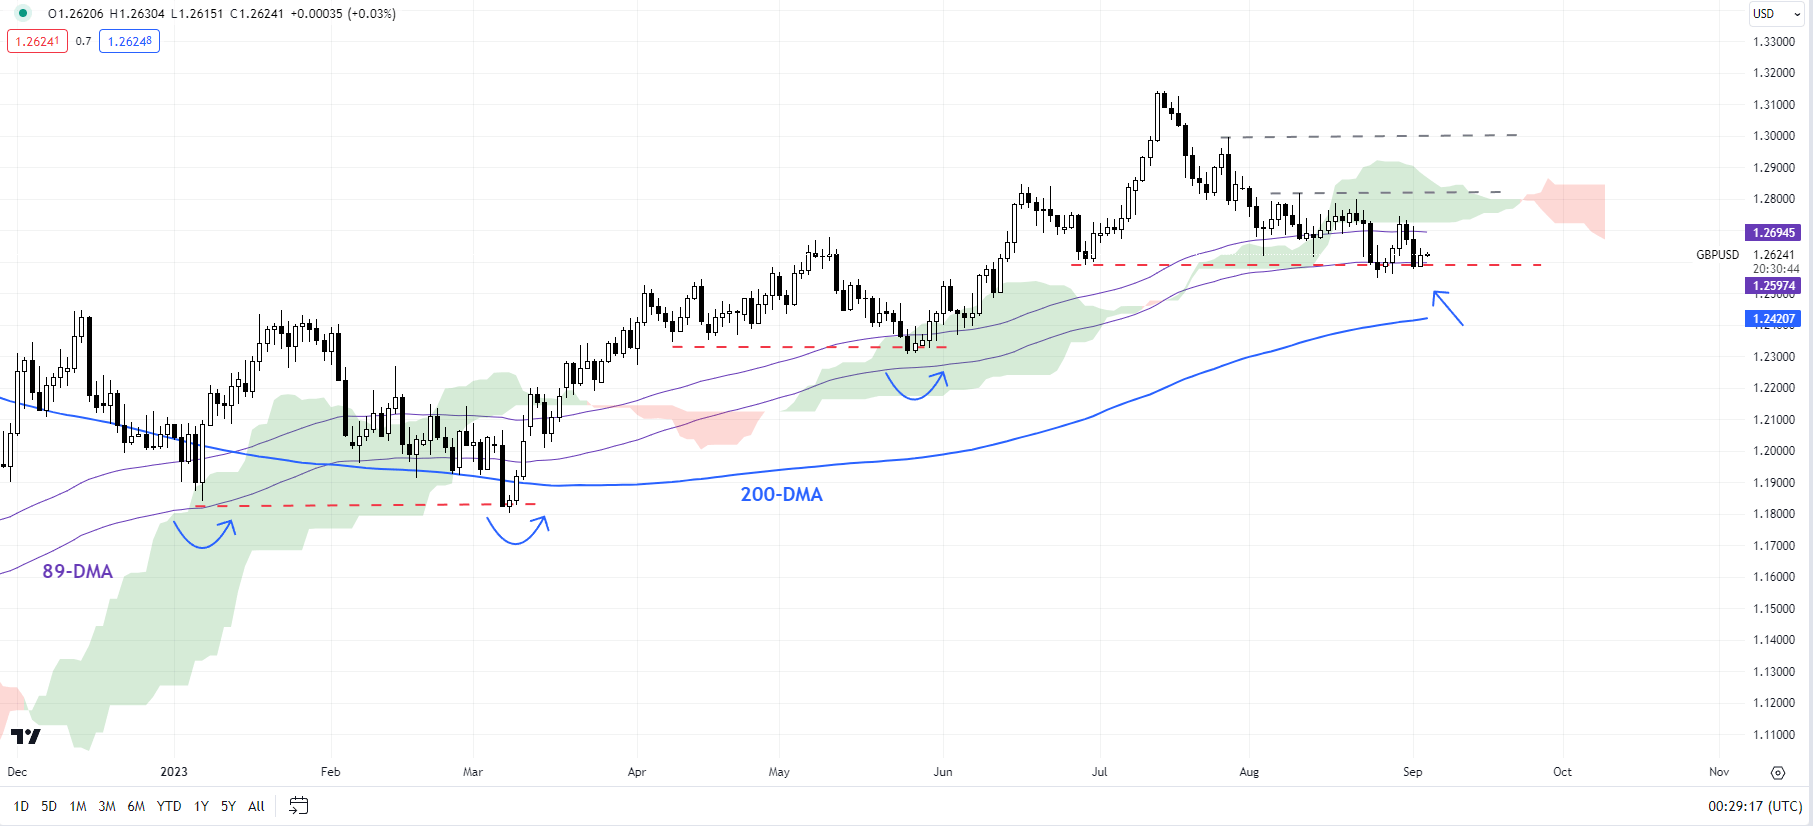
GBPUSD: Settles in a range

GBP/USD continues to be weighed by important immediate resistance at the August 10 high of 1.2820, slightly below another barrier at the end-July high of 1.3000, reinforcing the bigger-picture consolidation. For more discussion, see “Pound’s Resilience Masks Broader Fatigue: GBP/USD, EUR/GBP, GBP/JPY Setups,” published August 23. So far, the pair is holding above quite strong converged support at the end-June low of 1.2600, a shade above the 200-day moving average. Only a break below the May low of 1.2300 would disrupt the higher-low-higher-high sequence since late 2022. Until then, the trend could be sideways at best.

USD/CAD Weekly Chart

image5.png

USD/CAD: At a key threshold

USD/CAD is testing a crucial resistance at the Q2-2023 high of 1.3650. For the broader downward bias to remain intact, the pair needs to hold below this resistance. This follows a rebound in July from near-strong converged support on the 200-week moving average and the 89-week moving average. However, any break below last week’s low of 1.3500 would confirm that the short-term upward pressure had faded.