Natural Gas Forecast: Futures Approaching June Peak Amid Rising Demand

Natural Gas Forecast: Futures Approaching June Peak Amid Rising Demand

Overview

U.S. natural gas futures are nearing their June 26 high of 2.878, a pivotal point for potential upward acceleration. As of 11:33 GMT, the commodity was trading at 2.719, marking an increase of 0.59%. This uptick can be attributed to warmer weather forecasts for the next couple of weeks, pushing national demand higher. According to NatGasWeather, weather predictions for August 13-20 remain significantly warm, suggesting that surpluses may see a decline in the upcoming weeks, tightening the supply-demand balance.

Weather Forecasts Call for High Demand

Weather forecasts from August 7-13 indicate high pressure prevailing in the southern U.S., with temperatures soaring between the upper 80s and 110s, particularly from California to Texas. In contrast, the northern U.S. will experience cooler weather systems, with highs ranging between 70s and 80s. By the weekend, the East will warm up, showing a temperature increase to mid-80s to 90s. Given these conditions, demand will likely shift from seasonal to high, especially during the weekends.

Trading Derivatives carries a high level of risk to your capital and you should only trade with money you can afford to lose. Trading Derivatives may not be suitable for all investors, so please ensure that you fully understand the risks involved, and seek independent advice if necessary. A Product Disclosure Statement (PDS) can be obtained either from this website or on request from our offices and should be considered before entering into a transaction with us. Raw Spread accounts offer spreads from 0.0 pips with a commission charge of USD $3.50 per 100k traded. Standard account offer spreads from 1 pips with no additional commission charges. Spreads on CFD indices start at 0.4 points. The information on this site is not directed at residents in any country or jurisdiction where such distribution or use would be contrary to local law or regulation.

Furthermore, meteorological predictions anticipate the weather across the Lower 48 states to remain hotter than average until at least August 19. Consequently, data from Refinitiv suggests that the U.S. gas demand, inclusive of exports, will ascend from 102.4 billion cubic feet per day (bcfd) to 105.8 bcfd in the forthcoming week. This surge in demand arises as power generators ramp up fuel usage and exports witness an uptick.

LNG Export Demand Lower in August

However, it’s essential to note that the average gas output in the U.S. Lower 48 states for August was 102.2 bcfd, a slight increase from July’s 101.8 bcfd, equating the record set in May. In comparison, gas flows to the major U.S. LNG export plants have dipped marginally this month, primarily due to reductions at Cheniere Energy’s Sabine Pass in Louisiana.

Short-Term Outlook:  Cautiously Bullish

In light of the warmer forecasts and rising demand, the short-term outlook for U.S. natural gas futures remains bullish, but traders should stay vigilant of fluctuating export figures.

Technical Analysis
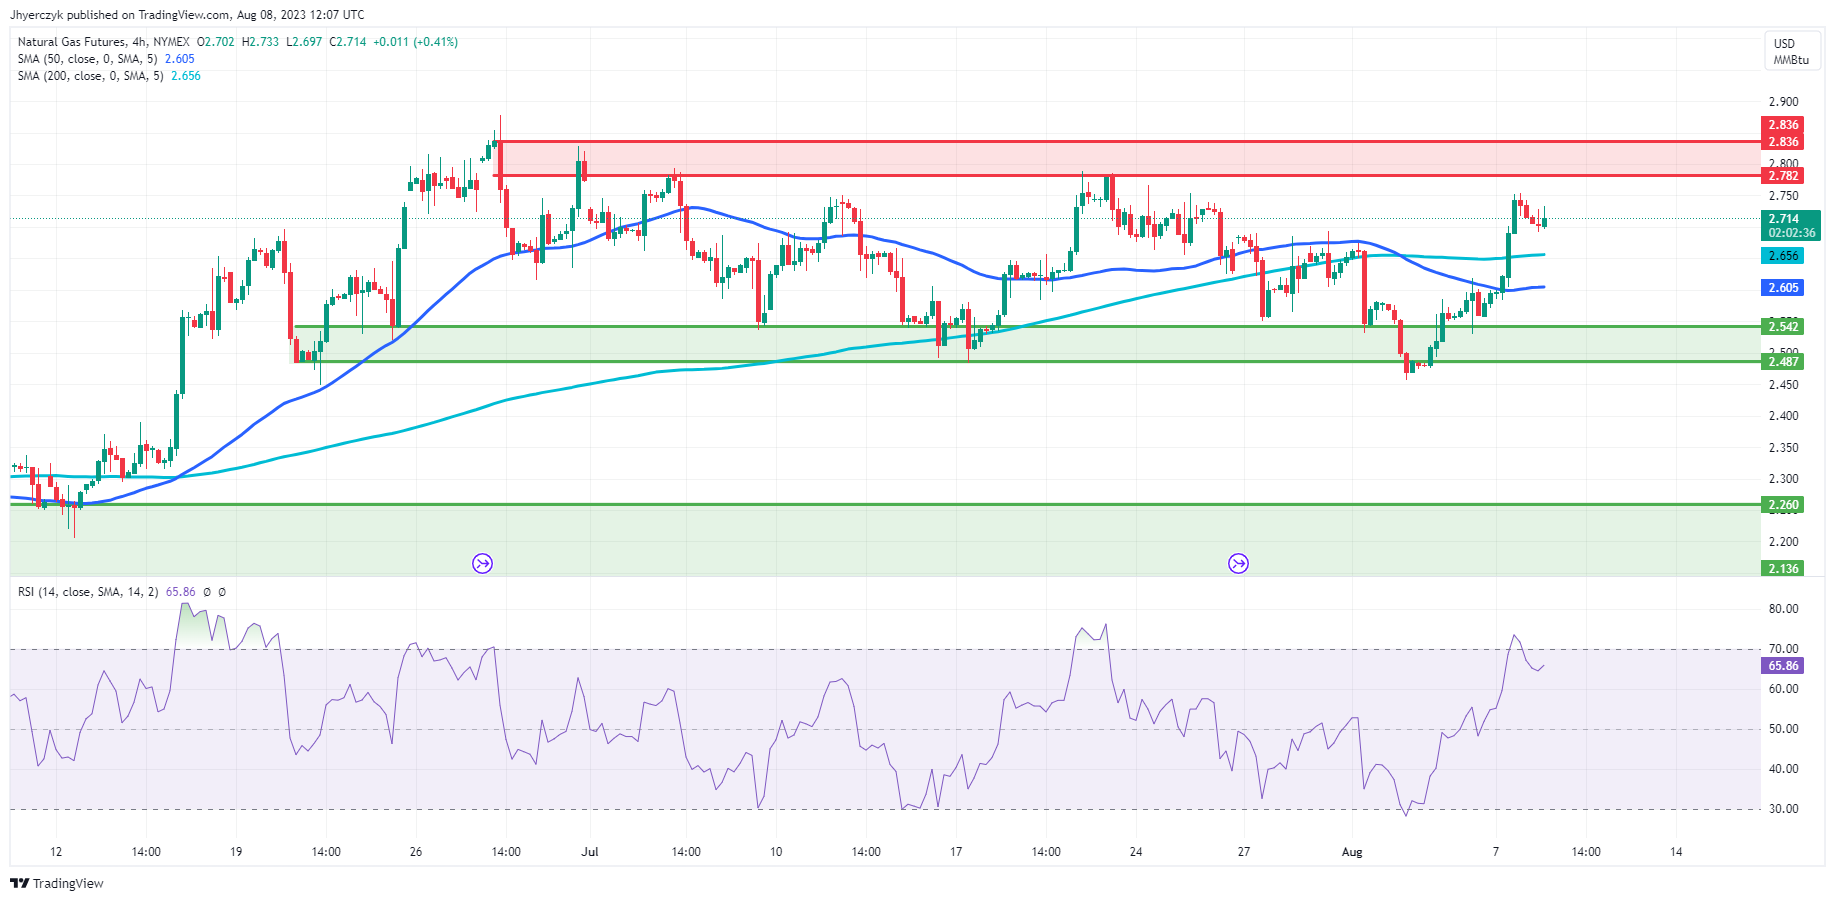
4-Hour Natural GasNatural Gas’s current 4-hour price of 2.709 indicates a marginal increase from the previous 4-hour level of 2.703, suggesting a subtle bullish inclination. Observing the moving averages, the present price remains above both the 200-4H moving average at 2.656 and the 50-4H moving average at 2.605, reinforcing this bullish trend.

The bullish sentiment is further supported by the 14-4H RSI, which, at 66.70, leans towards the overbought region, denoting stronger momentum.

Notably, the commodity’s price is closer to its main resistance range of 2.782 to 2.836 than the main support zone of 2.542 to 2.487, indicating a potential challenge ahead.

These technical indicators suggest that the short-term market sentiment for Natural Gas leans bullish, but traders should exercise caution because of the nearby resistance.


NASDAQ 100, Dow Jones, S&P 500: Weak as Moody’s Sounds Alarm on Banks

NASDAQ 100, Dow Jones, S&P 500: Weak as Moody’s Sounds Alarm on Banks

Overview

Stock futures suffered on Tuesday, failing to ride on the coattails of Wall Street’s earlier optimism. With futures for the Dow Jones, S&P 500, and Nasdaq 100 all dipping, bank shares took a considerable hit after Moody’s decision to downgrade various banks, signaling concerns in the banking sector.

Banks Under the Microscope

Moody’s, the esteemed credit rating agency, lowered ratings for 10 banks, while keeping heavyweights like Bank of New York Mellon and U.S. Bancorp under close review. Reasons cited by Moody’s analysts Jill Cetina and Ana Arsov revolve around growing profitability pressures for banks due to rising interest rate risks and challenges in asset-liability management. Moreover, a potential mild U.S. recession in 2024 could result in asset quality declines, with commercial real estate portfolios emerging as a particular area of concern. The effects were immediately seen with shares of major banks, including JPMorgan Chase, Goldman Sachs, and Citigroup, declining in premarket trading.

Trading Derivatives carries a high level of risk to your capital and you should only trade with money you can afford to lose. Trading Derivatives may not be suitable for all investors, so please ensure that you fully understand the risks involved, and seek independent advice if necessary. A Product Disclosure Statement (PDS) can be obtained either from this website or on request from our offices and should be considered before entering into a transaction with us. Raw Spread accounts offer spreads from 0.0 pips with a commission charge of USD $3.50 per 100k traded. Standard account offer spreads from 1 pips with no additional commission charges. Spreads on CFD indices start at 0.4 points. The information on this site is not directed at residents in any country or jurisdiction where such distribution or use would be contrary to local law or regulation.

Federal Reserve & Interest Rates

Complicating the banking landscape is the Federal Reserve’s decision to raise its borrowing rate to between 5.25% and 5.5% in a move to combat inflation. According to Moody’s, this rate hike might pose further challenges to banks, particularly regional ones with lower regulatory capital. Banks’ assets, especially those fixed-rate, might feel the heat, and any onset of a recession could exacerbate these pressures.

Earnings Impacts

Aside from the banking turbulence, corporate earnings are showing promise. About 86% of S&P 500 companies have reported quarterly results, with a majority surpassing Wall Street expectations. However, UPS shares saw a 5.6% dip after reporting lower-than-anticipated revenue. In contrast, educational tech firm Chegg and Restaurant Brands International witnessed positive financial outcomes.

Short-term Outlook

With U.S. Treasury yields adjusting and significant economic data, such as July’s consumer price index report set for release, Wall Street remains on its toes. Moody’s warning on potential risks in the banking sector, coupled with looming interest rate challenges, paints a cautious, if not bearish, short-term forecast for the financial sector.

June 2023 Sees US Trade Deficit Shrink as Imports Fall

June 2023 Sees US Trade Deficit Shrink as Imports Fall

US Trade Balance Overview

The U.S. trade figures for June showcased a narrowing in the goods and services deficit, driven by both a decrease in imports and exports. This article delves into the specifics of these shifts, and offers a snapshot into what traders might anticipate in the short-term.

The U.S. monthly international trade deficit decreased in June 2023 according to the U.S. Bureau of Economic Analysis and the U.S. Census Bureau. The deficit decreased from $68.3 billion in May (revised) to $65.5 billion in June as imports decreased more than exports. The goods deficit decreased $2.8 billion in June to $88.2 billion. The services surplus decreased less than $0.1 billion in June to $22.7 billion.

Exports Trend

June exports amounted to $247.5 billion, a slight reduction by $0.3 billion from May’s figures. Delving into the specifics, exports of goods slid down by $0.2 billion to stand at $165.1 billion in June. Key areas that saw a downturn include industrial supplies and materials, notably crude oil which dipped by $0.5 billion. However, certain sectors such as capital goods reported a growth, with other industrial machinery and telecommunications equipment posting increments of $0.5 billion and $0.3 billion respectively. Furthermore, the export of services recorded a slight decline of $0.2 billion, totaling $82.3 billion in June.

Imports Overview

June’s import figures stood at $313.0 billion, marking a $3.1 billion decrease from May. The import of goods receded by $2.9 billion, finalizing at $253.3 billion. A significant drop was observed in capital goods, especially computers, which saw a decrease of $1.6 billion. The industrial supplies and materials sector also reported a decline, while there was a noticeable surge in the automotive segment, with passenger cars increasing by $1.7 billion. In contrast, the import of services slightly reduced by $0.2 billion, reaching $59.7 billion in June.

Supply and Demand Outlook

The three-month moving average indicated a widening of the goods and services deficit by $1.6 billion, settling at $69.4 billion for the period ending in June. This was the result of a decline in both average exports and imports by $3.6 billion and $1.9 billion, respectively. On a brighter note, year-to-date figures revealed a 22.3% shrinkage in the deficit when compared to the same timeframe in 2022.

Short-term Forecast

Considering the current trends, the outlook remains cautiously bearish for imports and exports. The real goods deficit diminished by 3.0%, suggesting that trade imbalances are likely to persist in the coming months. The consistent decline in both exports and imports reflects broader economic factors and will be crucial for traders to monitor closely.

Canada Trade Balance Highlights

  • Merchandise exports fell by 2.2% in June.
  • Trade deficit expanded to $3.7 billion.
  • Real terms export saw an increase year-on-year.

Canada Trade Balance Overview

In June, Canada experienced a significant shift in its trade dynamics. With both exports and imports declining, the nation’s merchandise trade deficit took a hit, pushing it deeper into the negative territory.

June’s Trade Figures

Canada’s merchandise exports for June contracted by 2.2%, while imports witnessed a more modest reduction of 0.5%. Consequently, the merchandise trade deficit with the global market expanded, moving from $2.7 billion in May to a more pronounced $3.7 billion in June.

Detailed Export Analysis

Delving into the numbers, after a 3.0% drop in May, June’s exports decreased further by 2.2%. This downward trend was evident in 9 out of the 11 product sections. Interestingly, when evaluating exports in real or volume terms, there was a decrease of 1.1% in June. Furthermore, a persistent declining trend was observed in export prices, which fell for the 11th instance in the past 12 months.

Year-on-Year Perspective

Drawing a year-on-year comparison, from June 2022 to June 2023, total export prices plummeted by a significant 14.2%. Yet, during this same interval, the total value of exports shrunk by 12.3%. This indicates that in real terms, exports actually saw an increase.

Short-term Forecast

Considering the recurrent fall in export prices and the overall declining trend in trade figures, the outlook seems bearish for Canada’s trade balance. However, the real terms increase in exports might offer some respite to traders and policymakers. As always, traders are advised to stay updated with global trade dynamics and currency fluctuations.

Gold Price Forecast: Resurgent Dollar, US Inflation Fears Dampen XAU’s Shine

Gold Price Forecast: Resurgent Dollar, US Inflation Fears Dampen XAU’s Shine

Overview

Gold (XAU) prices slid marginally on Tuesday, influenced by a resurgent dollar and mounting anticipation over U.S. inflation data set to release later this week. As of 05:51 GMT, spot gold dipped by 0.1% to $1,934.26 an ounce. Concurrently, U.S. gold futures remained unchanged, positioned at $1,968.80. The dollar’s 0.2% surge against major counterparts rendered gold pricier for foreign purchasers.

US Inflation Trajectory in Focus

Central to investors’ focus this week is the U.S. inflation trajectory. While the market is aware that headline inflation is on a decline, the core inflation figures remain a significant point of contemplation for the Federal Reserve. Any pronounced solidity in this data might propel gold’s prices further downwards. Furthermore, should the Consumer Price Index (CPI) figures exceed expectations on Thursday, it might fuel speculations of another interest rate increment during the Federal Reserve’s September rendezvous. Elevated interest rates often bolster bond yields, in turn increasing the cost of holding non-yielding assets like gold.

Trading Derivatives carries a high level of risk to your capital and you should only trade with money you can afford to lose. Trading Derivatives may not be suitable for all investors, so please ensure that you fully understand the risks involved, and seek independent advice if necessary. A Product Disclosure Statement (PDS) can be obtained either from this website or on request from our offices and should be considered before entering into a transaction with us. Raw Spread accounts offer spreads from 0.0 pips with a commission charge of USD $3.50 per 100k traded. Standard account offer spreads from 1 pips with no additional commission charges. Spreads on CFD indices start at 0.4 points. The information on this site is not directed at residents in any country or jurisdiction where such distribution or use would be contrary to local law or regulation.

Fed Member Comments, China Trade Weigh

Recent downturns in gold prices also owe to remarks by Fed Governor Michelle Bowman, suggesting the necessity of more rate hikes to pull inflation closer to the Federal Reserve’s 2% aspiration. Simultaneously, trade data released showcased a 14.5% year-on-year plunge in China’s July exports, with imports shrinking by 12.4%. Notably, this marks China’s most substantial drop in exports since February 2020, a country also recognized as gold’s most significant consumer.

Gold ETF Demand Falls

In further testament to the prevailing investor mood, the SPDR Gold Trust, the globe’s principal gold-backed exchange-traded fund, experienced a 0.3% contraction on Monday.

Short-Term Outlook: Bearish Ahead of CPI Report

In the short-term, gold’s trajectory seems bearish. The combination of potential rate hikes, U.S. inflation outcomes, and the financial environment in major gold-consuming nations may apply further downward pressure on the precious metal.

Technical Analysis

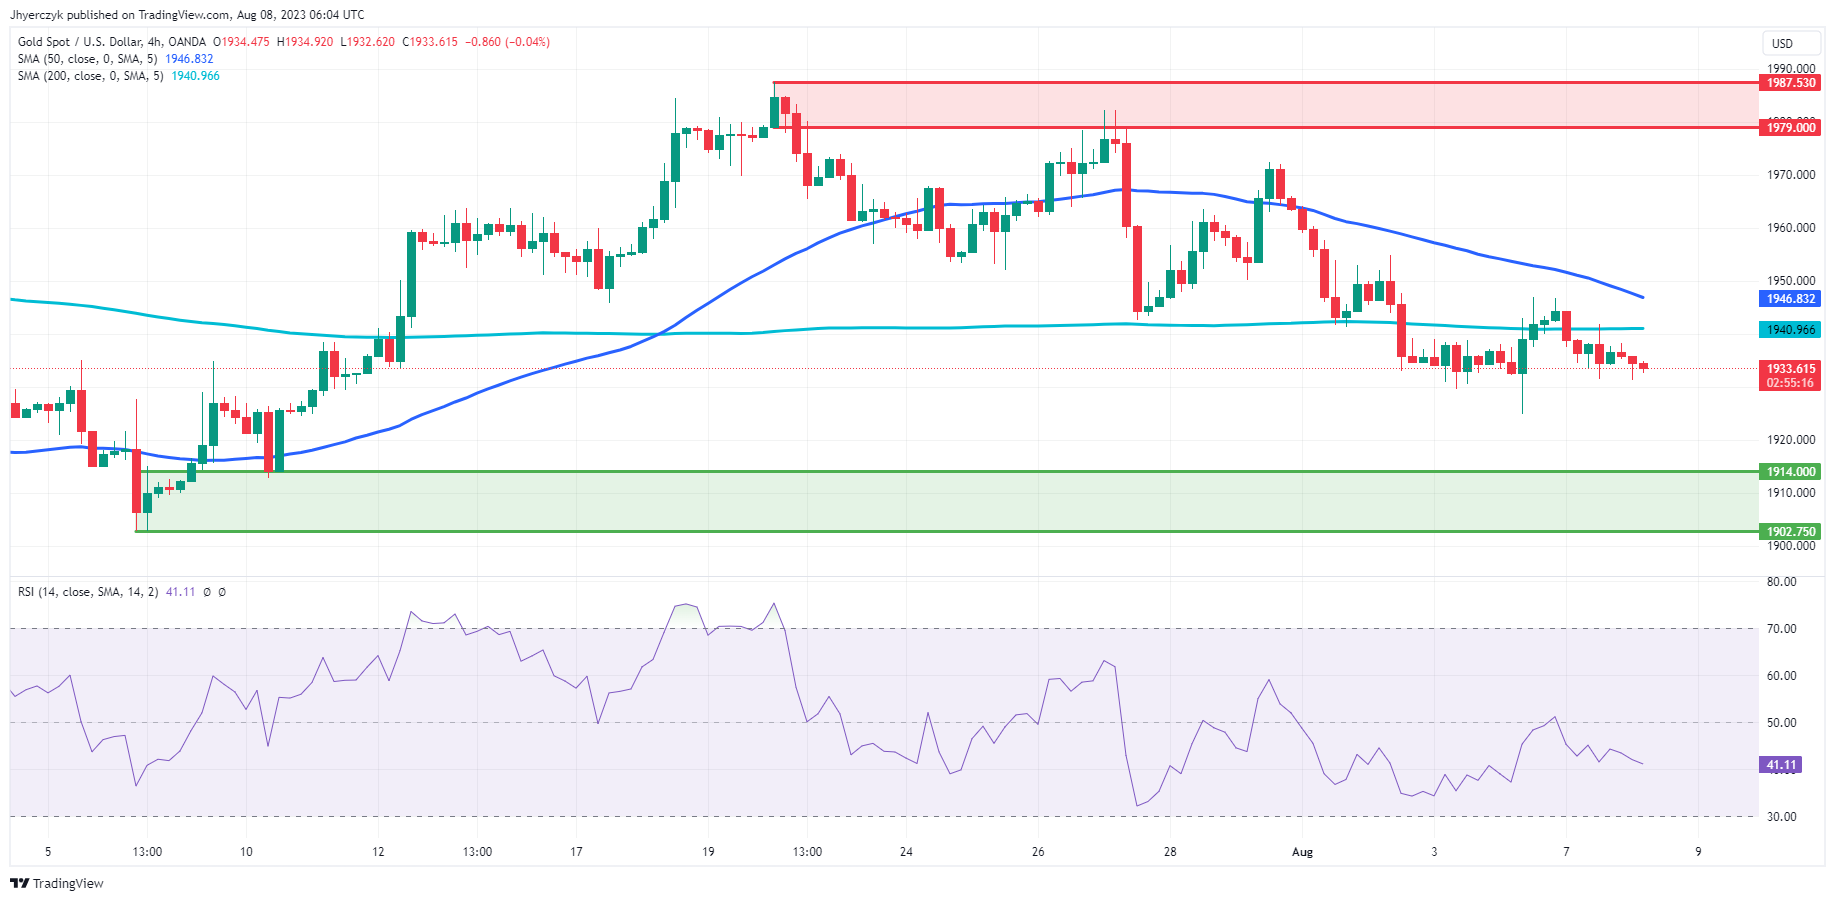
4-Hour Gold (XAU)Gold’s (XAU) current 4-hour price of 1933.42 is slightly below its previous 4-hour price of 1934.48, indicating a minor dip. The price is currently below both the 200-4H moving average of 1940.97 and the 50-4H moving average of 1946.83. This suggests a short-term bearish momentum, as it is trading under the significant moving averages. The 14-4H RSI stands at 41.08, suggesting weakened momentum, being below the neutral 50 mark.

Furthermore, the current price is hovering above the main support area ranging from 1914.00 to 1902.75 but is below the main resistance area of 1979.00 to 1987.53. Taking all these indicators into account, the market sentiment for Gold on a 4-hour chart appears bearish.

China Exports Tumble by 14.5% in July with Imports Down 12.4%

China Exports Tumble by 14.5% in July with Imports Down 12.4%

It was a busy start to the day on the Asian economic calendar. A pickup in Australian business confidence failed to move the dial, with investors cautious ahead of the trade data from China.

The trade data from China drew more interest this morning.

Exports from China tumbled by 14.5% in July versus a 12.4% decline in June. Imports slumped by 12.4% versus a more modest 6.8% fall in June. Economists forecast exports to fall by 9.8% and imports to decline by 5.6%. The dollar trade surplus widened from $70.62 billion to $80.60 billion.

The latest trade figures aligned with the Caixin Manufacturing PMI, which fell from 50.5 to 49.2 in July. Weak overseas demand sent the PMI to sub-50.

AUD/USD Reaction to China Trade Data

Before the trade data from China, the AUD/USD rose to a pre-stat high of $0.65763 before sliding to a low of $0.65364.

However, in response to the trade data, the AUD/USD tumbled from $0.65537 to a post-stat low of $0.65475 before rising to a high of $0.65593.

This morning, the AUD/USD was down 0.25% to $0.65574.

AUD/USD responds to trade data from China.

080823 AUDUSD Hourly ChartWe use the AUD/USD as a proxy when considering the impact of economic data from China on the markets.

The Australian trade – GDP ratio stood at 45.8% in 2019 before declining as global trade terms deteriorated. As an exporter of commodities, weak global demand would adversely affect the Australian trade balance, the economy, and the Aussie dollar. Importantly, trade provides circa 20% of Australian jobs, a material consideration for the RBA. Weak trade figures from China would signal deteriorating trade terms.

Next Up

US trade data will be in focus later in the day. However, the numbers are unlikely to influence the Fed and market risk sentiment.

The US trade – GDP ratio stood at 25.48% in 2021 and, importantly, is not a Fed focal point, limiting the impact of US trade data on the US dollar.

However, investors should monitor the news wires for Fed chatter with the media. FOMC members Harker and Barkin are on the calendar to speak today.

Natural Gas Forecast: Heating Up Amid Sizzling Weather Demand

Natural Gas Forecast: Heating Up Amid Sizzling Weather Demand

Overview

US natural gas futures witnessed a promising surge of 3% on Monday, indicating a bullish momentum in the energy sector. The increase followed a 1% hike in the previous session, with hot weather forecasts through mid-August driving up air conditioning demand, particularly in Texas. Surprisingly, this uptick came despite a decrease in gas flowing to US liquefied natural gas (LNG) export plants due to ongoing maintenance work.

Relentless Heatwave Fuels Weather Market

In Texas, power demand soared to a record high early this week, as the relentless heatwave compelled homes and businesses to crank up their air conditioners. The Electric Reliability Council of Texas (ERCOT), the state’s power grid operator, anticipates that this record will likely be broken again in the upcoming days.

Trading Derivatives carries a high level of risk to your capital and you should only trade with money you can afford to lose. Trading Derivatives may not be suitable for all investors, so please ensure that you fully understand the risks involved, and seek independent advice if necessary. A Product Disclosure Statement (PDS) can be obtained either from this website or on request from our offices and should be considered before entering into a transaction with us. Raw Spread accounts offer spreads from 0.0 pips with a commission charge of USD $3.50 per 100k traded. Standard account offer spreads from 1 pips with no additional commission charges. Spreads on CFD indices start at 0.4 points. The information on this site is not directed at residents in any country or jurisdiction where such distribution or use would be contrary to local law or regulation.

Consistent Average Gas Output

Refinitiv’s data reveals a consistent average gas output in the US Lower 48 states at 101.8 billion cubic feet per day (bcfd) throughout August, matching the July figures. This is in close proximity to the monthly record of 102.2 bcfd set in May. Predictions by meteorologists affirm the persisting hotter-than-normal weather in these states until at least August 19.

Refinitive Predicts Jump in Demand

As for the demand side, Refinitiv projects that US gas demand, inclusive of exports, will remain at 104.8 bcfd this week and the next, before escalating to 106.9 bcfd. This anticipated rise stems from power generators burning more fuel and the increase in exports. Gas flows to the major seven US LNG export plants have dwindled from an average of 12.7 bcfd in July to 12.2 bcfd so far in August. This decline is primarily attributed to a reduction at Cheniere Energy’s Sabine Pass in Louisiana.

Latest EIA Data Supportive

Finally, according to the US Energy Information Administration’s (EIA) Weekly Natural Gas Storage Report, working gas in storage was 3,001 Bcf as of Friday, July 28, 2023. This is a net increase of 14 Bcf from the previous week, suggesting a continued bullish trend for natural gas in the short term.

Short-Term Outlook:  Cautiously Bullish

As such, the combination of surging demand and consistent supply, especially in this hot season, paints an optimistic picture for natural gas in the coming weeks.

Technical Analysis

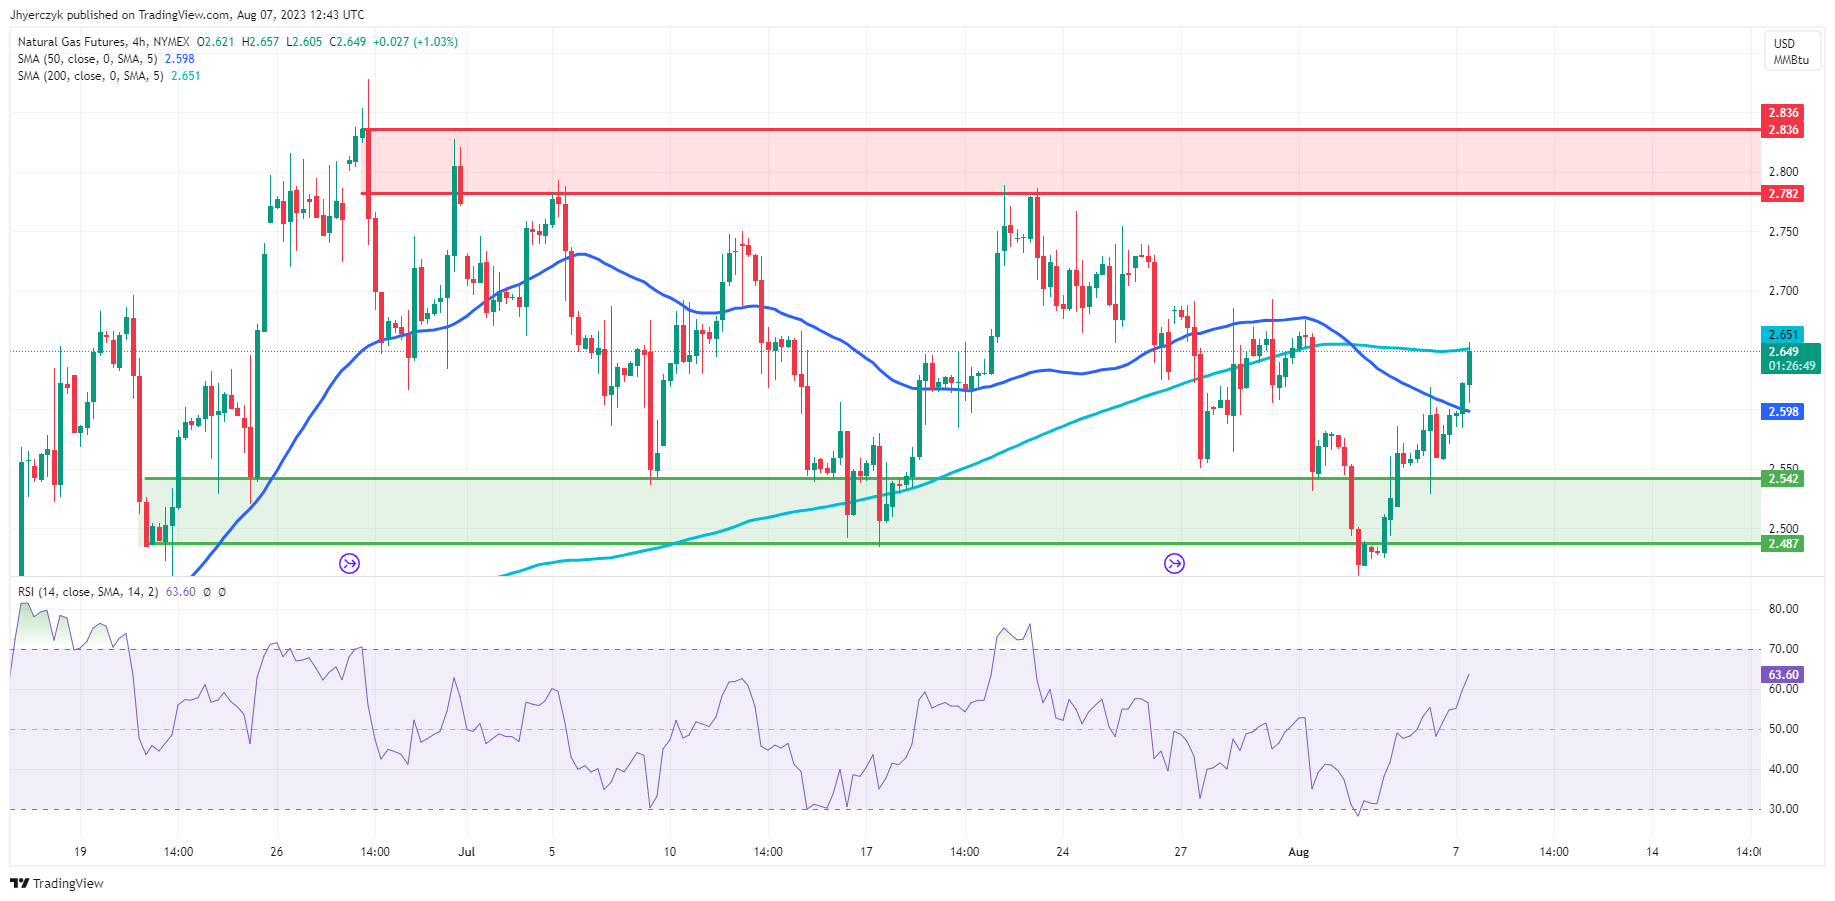
4-Hour Natural GasThe current 4-hour price for natural gas sits at 2.647, marking a slight increase from the previous 4-hour price of 2.622. Despite this, it remains marginally below the 200-4H moving average of 2.651, implying a mixed sentiment. However, the price is significantly above the 50-4H moving average of 2.598, indicating some bullish momentum. The 14-4H RSI stands at 62.75, suggesting stronger upward momentum but not quite overbought.

The commodity’s price resides comfortably above the main support area (2.542 to 2.487), but hasn’t broken through the main resistance area (2.782 to 2.836). Given these indicators, the market seems to have a cautiously bullish sentiment.

NASDAQ 100, Dow Jones, S&P 500: US Futures Up as Investors Eye Corporate Earnings, Inflation

NASDAQ 100, Dow Jones, S&P 500: US Futures Up as Investors Eye Corporate Earnings, Inflation

Overview

Major US stock index futures are on the rise, as investors brace for another week filled with corporate earnings reports and pivotal inflation data. As of Monday, Dow Jones Industrial Average futures have increased by 0.2%, while S&P 500 futures are up by 0.34% and Nasdaq 100 futures have advanced around 0.54%. This is a notable turnaround from last week, where Wall Street witnessed its worst performance since March with the Nasdaq Composite, S&P 500, and Dow ending 2.9%, 2.3%, and 1.1% lower respectively.

Daily S&P 500 Index

Wall Street Eyes Robust Earnings Season

Earnings reports from companies like Lucid, Palantir, Beyond Meat, and Paramount will be under the lens on Monday. This comes as part of a robust earnings season, where four-fifths of the S&P 500 companies that have reported results have surpassed Wall Street’s expectations. The trend of earnings could sway the market’s direction, especially as investors digest this alongside the latest inflation data due later this week.

Trading Derivatives carries a high level of risk to your capital and you should only trade with money you can afford to lose. Trading Derivatives may not be suitable for all investors, so please ensure that you fully understand the risks involved, and seek independent advice if necessary. A Product Disclosure Statement (PDS) can be obtained either from this website or on request from our offices and should be considered before entering into a transaction with us. Raw Spread accounts offer spreads from 0.0 pips with a commission charge of USD $3.50 per 100k traded. Standard account offer spreads from 1 pips with no additional commission charges. Spreads on CFD indices start at 0.4 points. The information on this site is not directed at residents in any country or jurisdiction where such distribution or use would be contrary to local law or regulation.

Investors Anticipate July’s Key Inflation Data

The focus will soon shift to the release of July’s consumer and producer price index data, which will provide insights into inflation and the overall health of the economy. The Federal Reserve’s rate-hiking campaign has heightened the significance of these indices, with investors keen to anticipate central bank policy changes. This comes in the wake of July’s employment data, which showed lesser job growth than expected but suggested no immediate recession.

Aramco Profits Fall, Surpass Expectations

Overseas, Saudi Aramco, the state oil giant, reported a net profit of $30.07 billion in Q2, a decrease of nearly 40% from last year due to falling crude oil prices and weakening refining and chemicals margins. However, the oil titan managed to surpass analyst expectations, providing a semblance of reassurance amidst global economic uncertainty. Aramco plans to maintain its dividend policy despite the fall in profits, emphasizing its commitment to shareholders.

Markets Teeter Amid Earnings, Global Uncertainty

In summary, the markets this week are poised on a knife-edge, with the US stock futures indicating a positive start, but uncertainty looms large. The corporate earnings reports, inflation data, and global news such as Aramco’s performance will dictate whether the market continues its bullish trend or retreats to a bearish stance.

Eurozone Finds Respite as Sentix Index Halts Slide, Germany Struggles

Eurozone Finds Respite as Sentix Index Halts Slide, Germany Struggles

Overview

The Eurozone economy breathes a sigh of relief as the sentix economic index puts a halt to its downward trajectory. However, concerns over Germany, the Eurozone’s largest economy, remain palpable, even as positive signals emerge from the US and Asia.

The sentix economic index for the Eurozone climbed 3.6 points from July, settling at -18.9 points in August. While this upward movement indicates a stop to the previous decline, it still paints a bleak picture. The overall assessment of the current situation remains weak, standing at -20.5 points. Conversely, economic expectations managed to muster strength, rising by 7.3 points to -17.3, suggesting a cautious optimism for the future.

Meanwhile, Germany, the economic powerhouse of the Eurozone, continues to struggle. The nation’s overall index fell for the fourth consecutive month, reaching -30.7 points. A slump of 7.3 points in the situation score and a disappointing -26 points in expectations gives little cause for hope. Germany’s weakening economy thus continues to weigh heavily on the Eurozone.

In contrast to the Eurozone’s subdued outlook, the US and Asia (excluding Japan) show promising signs. These regions exhibited positive developments in almost all sub-components, providing a glimmer of hope against the Eurozone’s stagnation.

In short-term forecasts, the global economic scenario appears to be in a state of stagnation, despite the Eurozone’s struggle. This is buoyed by the US and Asia’s positive outlook, leading the global aggregate to rise by 6.6 points to -1.0. As such, traders should keep an eye on these contrasting regional dynamics which could affect the broader market sentiment.

Oil Price Forecast: Production Cuts Underpin Oil Prices Near April Peak

Oil Price Forecast: Production Cuts Underpin Oil Prices Near April Peak

Overview

U.S. benchmark West Texas Intermediate (WTI) crude oil futures experienced a minor dip on Monday but remained near April’s peak, reflecting the market’s reaction to supply management from leading producers. Saudi Arabia and Russia announced an extension of their supply cuts for another month in an attempt to tighten global markets and uphold prices. These contracts had their sixth consecutive weekly gains last week – a winning streak not seen since the transition from 2021 to 2022.

Saudis, Russians Respond to Market Volatility

The concerted efforts by these oil giants come in response to market volatility. On one hand, the anticipation of U.S. interest rate hikes slowing down, combined with a drop in OPEC+ supplies and an expected boost in oil demand recovery from China, has kept oil prices steady. Moreover, Saudi Arabia extended its voluntary production cut of 1 million barrels per day (bpd) to the end of September. Meanwhile, Russia declared a cut in oil exports by 300,000 bpd for September, despite recent damage to a warship at its Black Sea navy base, which manages 2% of global oil supply.

Trading Derivatives carries a high level of risk to your capital and you should only trade with money you can afford to lose. Trading Derivatives may not be suitable for all investors, so please ensure that you fully understand the risks involved, and seek independent advice if necessary. A Product Disclosure Statement (PDS) can be obtained either from this website or on request from our offices and should be considered before entering into a transaction with us. Raw Spread accounts offer spreads from 0.0 pips with a commission charge of USD $3.50 per 100k traded. Standard account offer spreads from 1 pips with no additional commission charges. Spreads on CFD indices start at 0.4 points. The information on this site is not directed at residents in any country or jurisdiction where such distribution or use would be contrary to local law or regulation.

Gains Dampened by Worries Over China’s Recovery

However, these bullish prospects are somewhat dampened by concerns over China’s recovery pace and questions over the duration of Saudi and Russia’s supply reductions. The balance point could be around $85 per barrel (Brent) for the time being, given the current level of spare capacity. Investors also have a keen eye on upcoming Chinese economic data, as it will provide insights into the need for further stimulus measures.

Bullish Sentiment Fueled by US Rigs Drop

In the U.S., the number of operating oil rigs fell to 525 last week, the lowest count since March 2022, contributing to the bullish sentiment. Still, the overall market outlook remains mixed.

Short-Term Outlook:  Bullish with Possible Headwinds

With prices nearing their April highs, a sustained WTI break above $84.00 a barrel could pave the way towards $93.50. However, this could be stalled by any setbacks in global recovery or significant changes in oil production policies.The coming weeks will provide crucial insights into these factors and how they will shape the short-term future of the oil market.

Technical Analysis

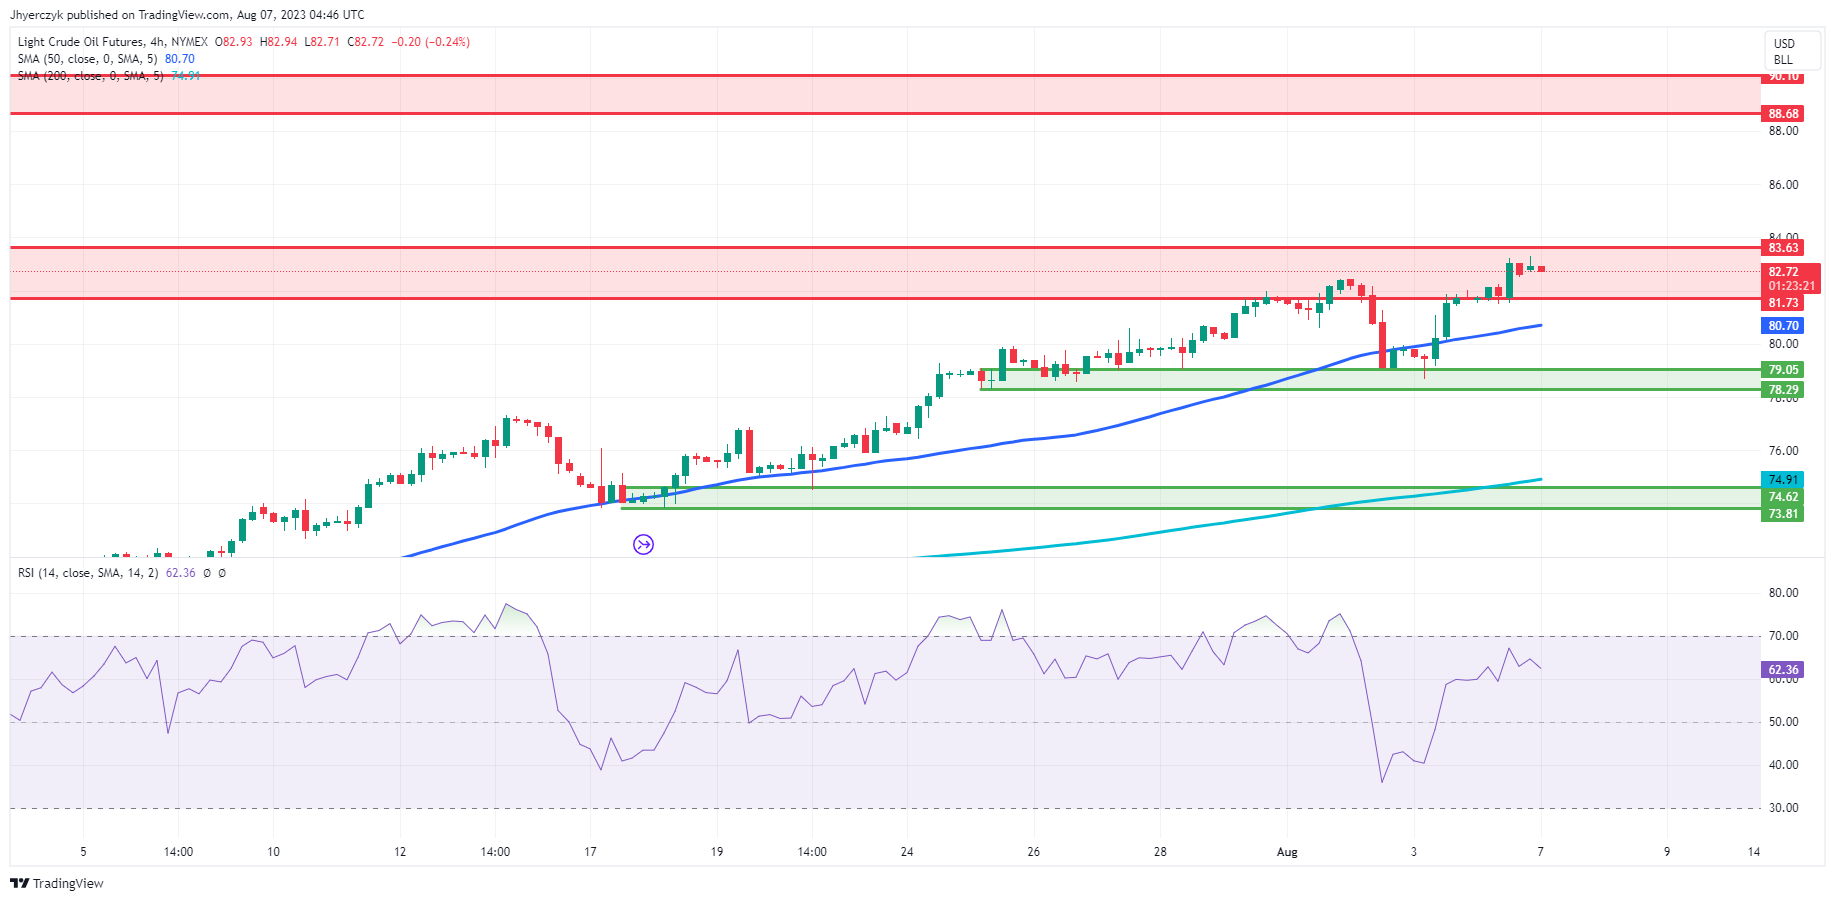
4-Hour Crude OilCrude oil’s current 4-hour price of $82.75, higher than both the 200-4H and 50-4H moving averages ($74.91 and $80.70 respectively), indicates a bullish market trend. The 14-4H RSI at 62.57 suggests stronger momentum, reaffirming the bullish sentiment.

Given the current price is above the main support area ($78.29-$79.05) and testing the upper end of the main resistance area ($81.73-$83.63), the market appears poised for further growth, indicating a robust bullish outlook.

DAX Return to 16,000 Hinged on the German Economy and the Fed

DAX Return to 16,000 Hinged on the German Economy and the Fed

It was a bullish Friday for the DAX, which gained 0.37%. Partially reversing a 0.72% loss from Thursday, the DAX ended the week down 3.14% to 15,952. Significantly, the DAX ended the day at sub-16,000 for the second time since July 11.

Economic indicators from Germany provided support early in the European session. Factory orders surged for a second consecutive month, easing immediate fears of an extended economic recession.

Trading Derivatives carries a high level of risk to your capital and you should only trade with money you can afford to lose. Trading Derivatives may not be suitable for all investors, so please ensure that you fully understand the risks involved, and seek independent advice if necessary. A Product Disclosure Statement (PDS) can be obtained either from this website or on request from our offices and should be considered before entering into a transaction with us. Raw Spread accounts offer spreads from 0.0 pips with a commission charge of USD $3.50 per 100k traded. Standard account offer spreads from 1 pips with no additional commission charges. Spreads on CFD indices start at 0.4 points. The information on this site is not directed at residents in any country or jurisdiction where such distribution or use would be contrary to local law or regulation.

Corporate earnings failed to provide support despite Commerzbank delivering upbeat H1 results and a positive outlook. The Bank also rolled out plans for share buybacks.

Later in the European session, the US Jobs Report delivered late support.

However, a bearish US session capped the upside for the DAX. The NASDAQ Composite Index slipped by 0.36%, with the Dow and the S&P 500 seeing losses of 0.43% and 0.53%, respectively. While Amazon.com (AMZN) delivered support, Apple (AAPL) dragged on a forecasted slide in sales.

Daily Chart sends bullish price signals.
DAX 070823 Daily Chart

Economic Indicators Delivered Support

It was a relatively busy day on the European economic calendar, with German factory orders in focus. Factory orders surged 7.0% in June, following a 6.2% jump in May. Economists forecast a 2% fall in factory orders.

Later in the European session, the US Jobs Report was also market-friendly. The US unemployment rate fell from 3.6% to 3.5%, while average hourly earnings rose by 4.4% year-over-year. Economists forecast an unemployment rate of 3.6% and average hourly earnings to increase by 4.2%. However, a 187k increase in nonfarm payrolls signaled a moderately softer labor market. Economists forecast nonfarm payrolls to rise by 200k.

The Market Movers

It was another mixed session for the auto sector. BMW led the way, rising by 1.07%, with Mercedes-Benz Group gaining 0.48%. Continental AG and Porsche rose by 0.28% and 0.11%, respectively, while Volkswagen fell by 0.22%.

It was also a mixed session for the banks. Commerzbank fell by 2.64%, while Deutsche Bank ended the day up 0.74%. Commerzbank was the worst performer on Friday.

The Day Ahead for the DAX

This morning, German industrial production will set the tone. After the surge in factory orders over two consecutive months, weak industrial production figures would refuel recessionary jitters. Economists forecast a 0.4% decline in industrial production.

Later in the session, there are no US economic indicators influence. The lack of economic indicators will leave Fed chatter to move the dial. FOMC members Harker and Bowman are on the calendar to deliver speeches.

DAX Technical Indicators

Looking at the EMAs and the 4-hourly chart, the EMAs sent bearish signals. The DAX sat below the 50-day (16,115) and 200-day (15,962) EMAs, sending bearish near and longer-term price signals.

Significantly, the 50-day EMA narrowed to the 200-day EMA, sending bearish price signals and supporting a DAX return to sub-15,750 to bring the 15,600 – 15,525 support band into play.

However, a DAX move through the 200-day EMA (15,962) and the lower level of the 16,000 – 16,080 resistance band would give the bulls a run at the 50-day EMA (16,115).

The 14-4H RSI sits at 38.41, signaling bearish sentiment, with selling pressure overweighing buying pressure. Significantly, the RSI aligns with the EMA, supporting a return to sub-15,750 to bring the 15,600 – 15,525 support band into play.

DAX 4-Hourly Chart sends bearish price signals.
DAX 070823 4-Hourly Chart