

On Tuesday, the EUR/USD fell by 0.42% to wrap up the day at $1.09563. Trade data from China and softer inflation figures from Germany left the EUR/USD in negative territory.
Today, there are no euro area economic indicators to draw interest. The lack of economic indicators will leave the EUR/USD in the hands of market risk sentiment and central bank chatter.
Trading Derivatives carries a high level of risk to your capital and you should only trade with money you can afford to lose. Trading Derivatives may not be suitable for all investors, so please ensure that you fully understand the risks involved, and seek independent advice if necessary. A Product Disclosure Statement (PDS) can be obtained either from this website or on request from our offices and should be considered before entering into a transaction with us. Raw Spread accounts offer spreads from 0.0 pips with a commission charge of USD $3.50 per 100k traded. Standard account offer spreads from 1 pips with no additional commission charges. Spreads on CFD indices start at 0.4 points. The information on this site is not directed at residents in any country or jurisdiction where such distribution or use would be contrary to local law or regulation.
While the economic calendar is on the light side, no ECB Executive Board Members are on the calendar to speak today. However, investors should monitor the news wires for ECB chatter with the media.
Before the European opening bell, consumer price inflation and producer price index numbers from China set the tone.
Inflation figures from China set the tone ahead of the European opening bell.
Consumer prices fell by 0.3% year-over-year in July after stalling in June. Economists forecast a 0.4% decline, signaling weak consumer demand. However, consumer prices increased by 0.2% in July, reversing a 0.2% decline in June. Economists forecast a 0.1% increase.
However, the producer price index fell by 4.4% year-over-year, following a 5.4% decline in June. Economists forecast a 4.1% decline.
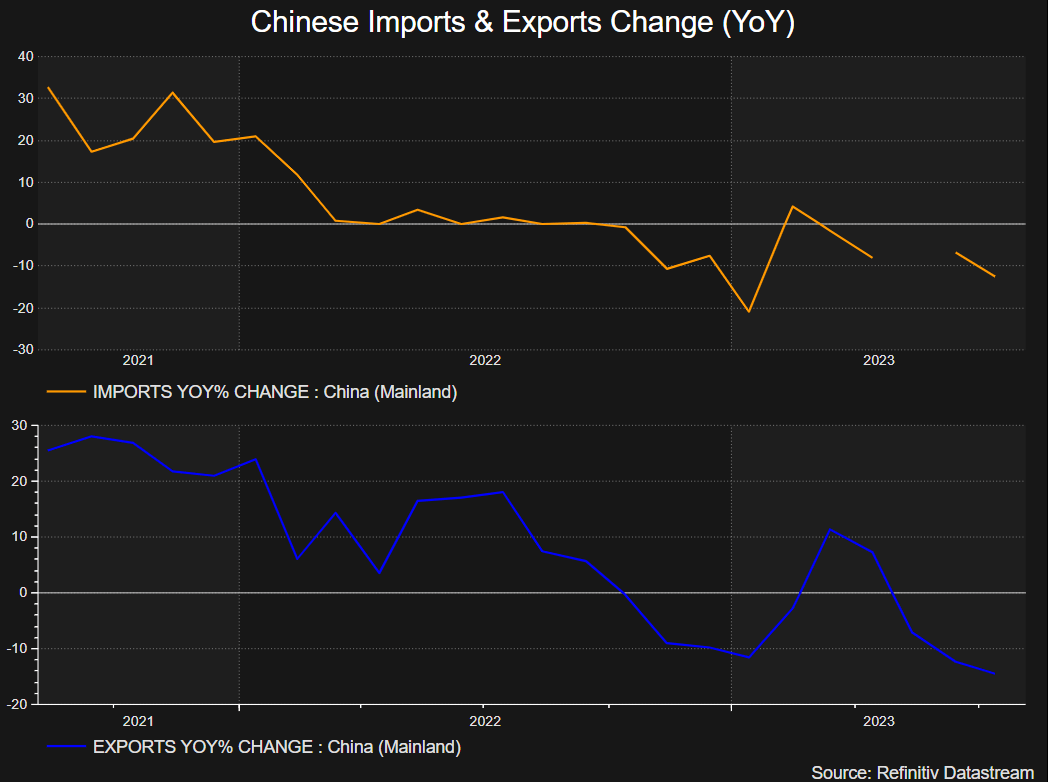
While the producer price index declined at a less marked pace in July, the 4.4% fall reflected the ongoing weakness in global demand, aligned with the July Caixin manufacturing PMI and the latest import and export figures. Nonetheless, a possible bottoming out and a pickup in consumer prices should provide some comfort.
The US Session
There are no US economic indicators to move the dial this afternoon. However, investors should monitor the news wires for Fed chatter with the media ahead of the US CPI Report out on Thursday.
EUR/USD Price Action
Daily Chart
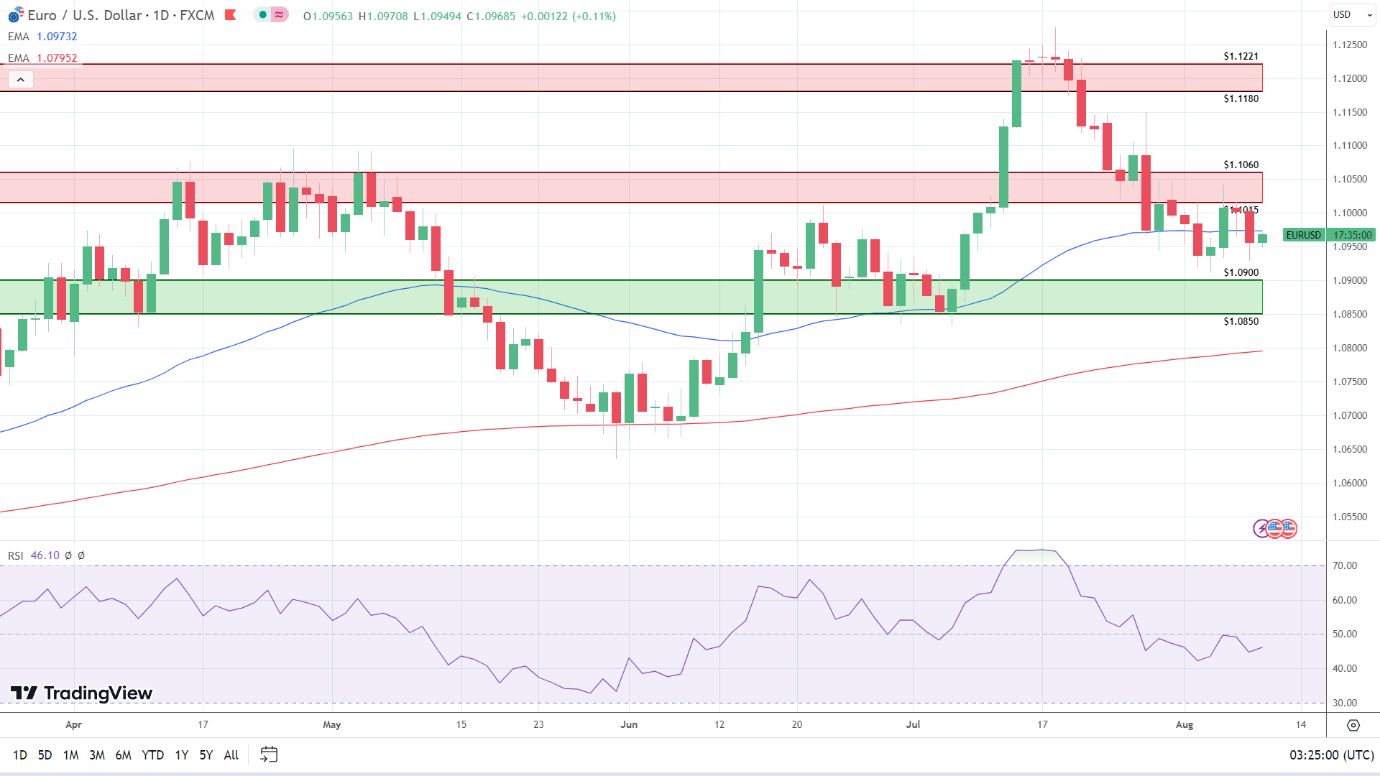
The Daily Chart showed the EUR/USD remained below the $1.1015 – $1.1060 resistance band and the 50-day EMA ($1.09732). However, the EUR/USD held above the 200-day EMA ($1.07952), sending bearish near-term but bullish longer-term price signals.
A EUR/USD move through the 50-day EMA ($1.09732) would give the bulls a run at the $1.1015 – $1.1060 resistance band. However, failure to move through the 50-day EMA would leave the $1.0900 – 1.0850 support band in play.
Looking at the 14-Daily RSI, the 46.10 reading sends moderately bearish price signals. The RSI suggests a fall through the upper level of the $1.0900 – 1.0850 support band.
4-Hourly Chart
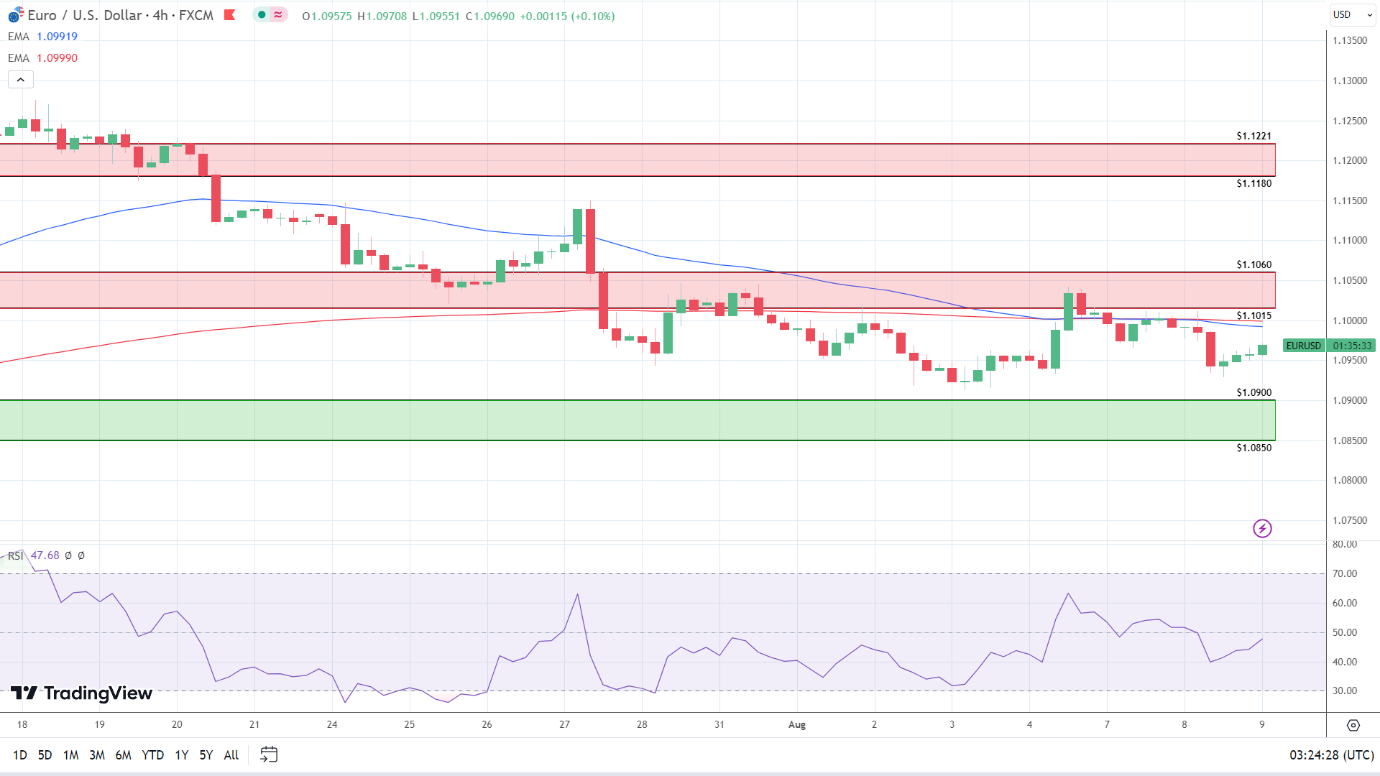
Looking at the 4-Hourly Chart, the EUR/USD sits below the $1.1015 – $1.1060 resistance band. The EUR/USD remains below the 50-day ($1.09919) and 200-day ($1.09990) EMAs, sending bearish near and longer-term price signals.
The 50-day EMA pulled back from the 200-day EMA this morning, a bearish price signal. Failure to move through the EMAs would bring sub-$1.0950 and the $1.0900 – 1.0850 support band into play. However, a EUR/USD move through the EMAs would support a breakout from the $1.1015 – $1.1060 resistance band to target $1.11.
The 14-4H RSI at 47.68 sends bearish EUR/USD price signals, with selling pressure outweighing buying pressure. Significantly, the RSI aligns with the EMAs, signaling a return to sub-$1.0950 to bring the $1.0900 – 1.0850 support band into play.










 Chat now!