EUR/USD Outlook: ECB Hawks Welcome Further Hikes but for How Long?

EUR/USD Outlook: ECB Hawks Welcome Further Hikes but for How Long?

Hawks Favour More Hikes but Divisions within the ECB May Soon Appear

Isabel Schnabel and Peter Kazimir, hawks within the ECB’s ranks, have communicated their preference to see more rate hikes before witnessing a peak in interest rates. Schnabel opted for an approach that risks doing too much as opposed to doing too little, substantiating that it is trickier to tame inflation once it has become entrenched in the economy.

On the other side of the debate is well known dove and ECB Chief economist, Philip Lane, who suggested that one more hike in July is most likely appropriate while refusing to commit to the same outcome in the following meeting – stating a preference for a data dependent approach.

EUR/USD Key Technical Levels Assessed and Analysed

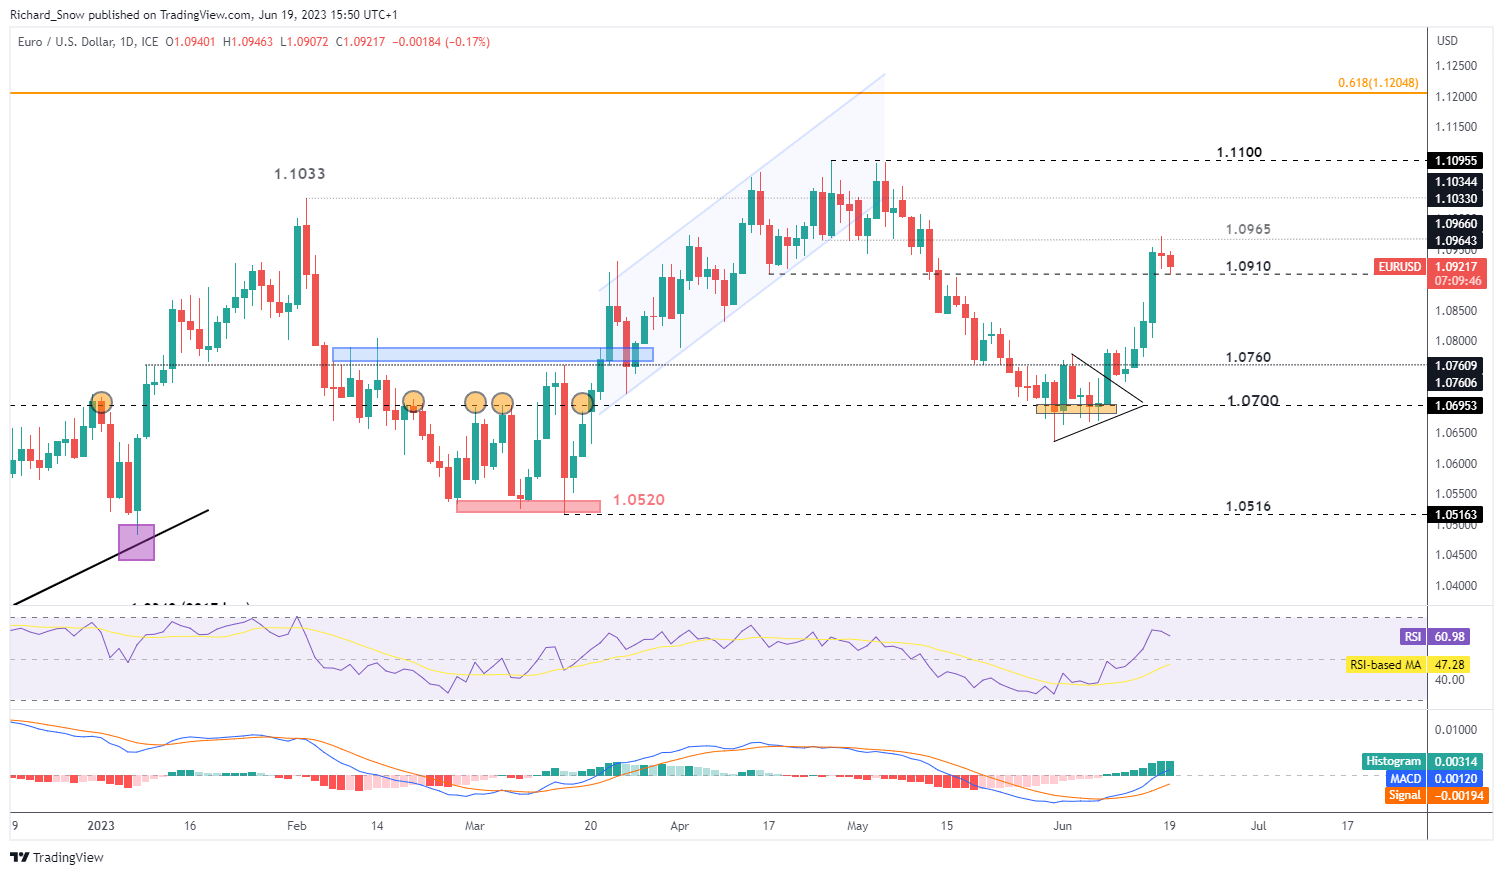
EUR/USD has enjoyed a massive week to the upside last week, rising just short of 200 basis points. Despite a confusing ECB press conference, the overall message from the ECB remained in tightening mode, while US bond markets appear at odds with the hawkish Fed policy statement and economic projections.

1.0965 appeared to be a stretch too far last week and remains the most immediate level of resistance. Heading into this week, with the US on holiday today in observance of Juneteenth, it appears markets are content with a slight countertrend move although, the true test of this short-term direction will be revealed tomorrow when the US is back online.

Immediate support lies at 1.0910 where a break and hold below this level could see prices trading down towards 1.0760 – the next level of support. For now, the MACD suggests that bullish momentum has not yet been wiped out as bulls may eye bullish continuation plays after assessing the extend of the retracement.

EUR/USD Daily Chart

image1.png

 Client Sentiment Favors Bullish Continuation Setups after Sentiment Reversal

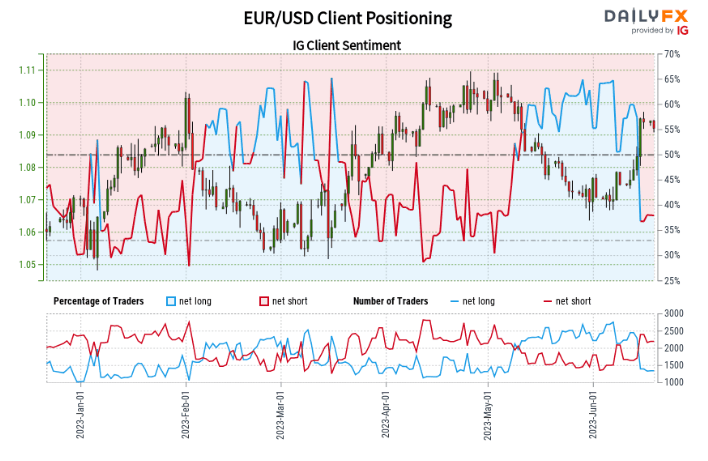
EUR/USD IG Client Sentiment

image2.png

Source: IG/DailyFX, prepared by Richard Snow

EUR/USD:Retail trader data shows 38.00% of traders are net-long with the ratio of traders short to long at 1.63 to 1.The number of traders net-long is 4.37% higher than yesterday and 39.12% lower from last week, while the number of traders net-short is 4.45% higher than yesterday and 30.37% higher from last week.

We typically take a contrarian view to crowd sentiment, and the fact traders are net-short suggests EUR/USD prices may continue to rise.

Traders are further net-short than yesterday and last week, and the combination of current sentiment and recent changes gives us a stronger EUR/USD-bullish contrarian trading outlook.

Risk Events for the Week Ahead

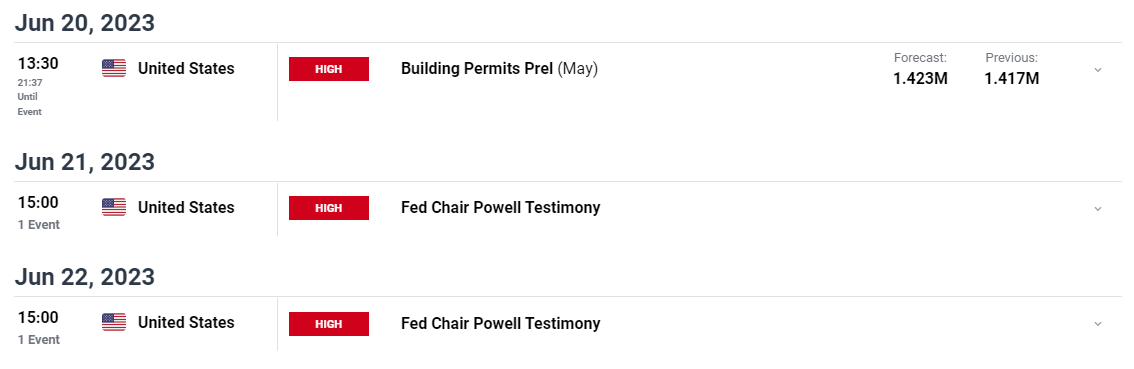
Scheduled risk events experience a significant drop-off this week with Jerome Powell’s testimony in front of the US Senate Banking Committee the major event.

image3.png


AUD/USD Price Forecast: Aussie Sinks on Lackluster RBA and Chinese Rates

AUD/USD Price Forecast: Aussie Sinks on Lackluster RBA and Chinese Rates

AUSTRALIAN DOLLAR FUNDAMENTAL BACKDROP

The Australian dollar is on offer this morning against the US dollar even though the greenback remains relatively flat as measured by the DXY index. The selloff stemmed initially from concerns around the Chinese economy as the PBoC cut both the 1-year and 5-year loan prime rates by only 10bps respectively (refer to economic calendar below). In a push to stimulate economic growth, we may see further rate cuts going forward and with China’s low inflation relative to other major global economies, there is little in the way of limitations to continue easing monetary policy. Being a major trading partner with China, the grim outlook will hinder commodity exports from Australia thus weighing negatively on the Aussie dollar.

AUD/USD ECONOMIC CALENDAR (GMT +02:00)

image1.png

The Reserve Bank of Australia (RBA) minutes then followed which highlighted the indecision in the last meeting to hike rates but with the surprise hike, July’s expectations are slightly skewed towards a rate pause as depicted in the table below – following the trend of the Fed. Economic data inputs will be of utmost importance leading up to the meeting as data dependency becomes more and more important for the RBA.

Later today, focus shifts to Fed speak as well as building permit data for the US. Recent releases have ben on the decline but estimates point to a marginal uptick that could be a net positive for the dollar.

RBA INTERST RATE PROBABILITIES

image2.png

TECHNICAL ANALYSIS

AUD/USD DAILY CHART

image3.png

Daily AUD/USD price action is now marginally above the 0.6800 psychological level after slipping below briefly during the Asian trading session. Coming off overbought levels as measured by the Relative Strength Index (RSI) makes the move unsurprising from a technical analysis point of view and has rom to move further. That being said, there may be the possibility of a bullish crossover known as the golden cross where the 50-day MA (yellow) crosses above the 200-day MA MA (blue). This could mean the current downward bias may be short-lived in the medium-term.

Key resistance levels:

  • 0.6900
  • 0.6856

Key support levels:

  • 0.6800
  • 0.6772
  • 0.6700

IG CLIENT SENTIMENT DATA: MIXED

IGCS shows retail traders are currently net HORT on AUD/USD, with 51% of traders currently holding short positions. At DailyFX we typically take a contrarian view to crowd sentiment resulting but due to recent changes in long and short positioning, we arrive at a short-term cautious disposition.

More Signs of Natural Gas in Bottoming Process; Sentiment Points to Upside in Crude Oil

More Signs of Natural Gas in Bottoming Process; Sentiment Points to Upside in Crude Oil

Crude oil and natural gas trends appear to be converging. Sentiment in crude oil is quite bullish, raising the prospect of some gains in price. In contrast, natural gas appears to be flexing muscles after months of weakness.

IG Client Sentiment

image1.png

Data as of 20 June 2023 at 8.02am

Crude Oil: Offsetting currents

Crude oil has barely moved in recent weeks as output cuts by OPEC+ have been offset by a deterioration in China’s economic outlook. However, the IG Client Sentiment shows about 77% of the retail traders are long, even after the 30% reduction in longs in the past week. IGCS can at times provide a sense of future direction, pointing to a rise in crude oil.

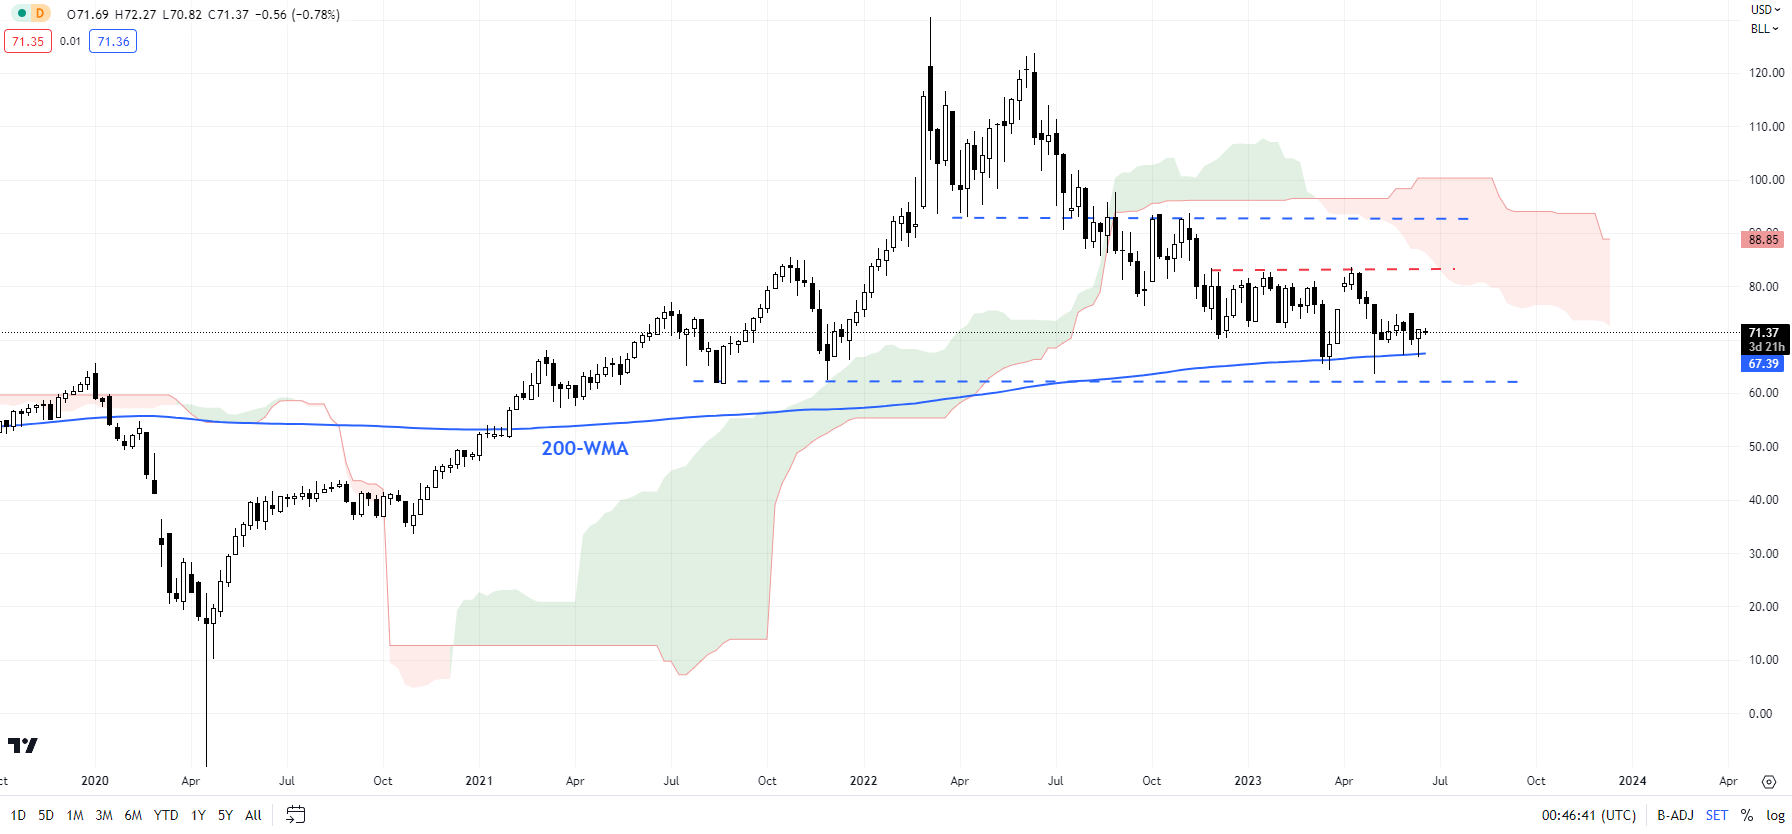
Crude Oil Weekly Chart

image2.png

On technical charts, crude oil has been holding above quite strong converged support on the 200-week moving average (now at about 67.40), slightly above the August 2021 low of 62.10. While the downtrend has seemingly lost steam in recent weeks, upward momentum has been lacking. Unless crude oil breaks above the April high of 83.50, the path of least resistance is sideways to down. For more discussion, see “Crude Oil Extends Slide in Asia: Is This Capitulation?”, published May 4.

Natural Gas Daily Chart

image3.png

Natural gas: More gains on the cards?

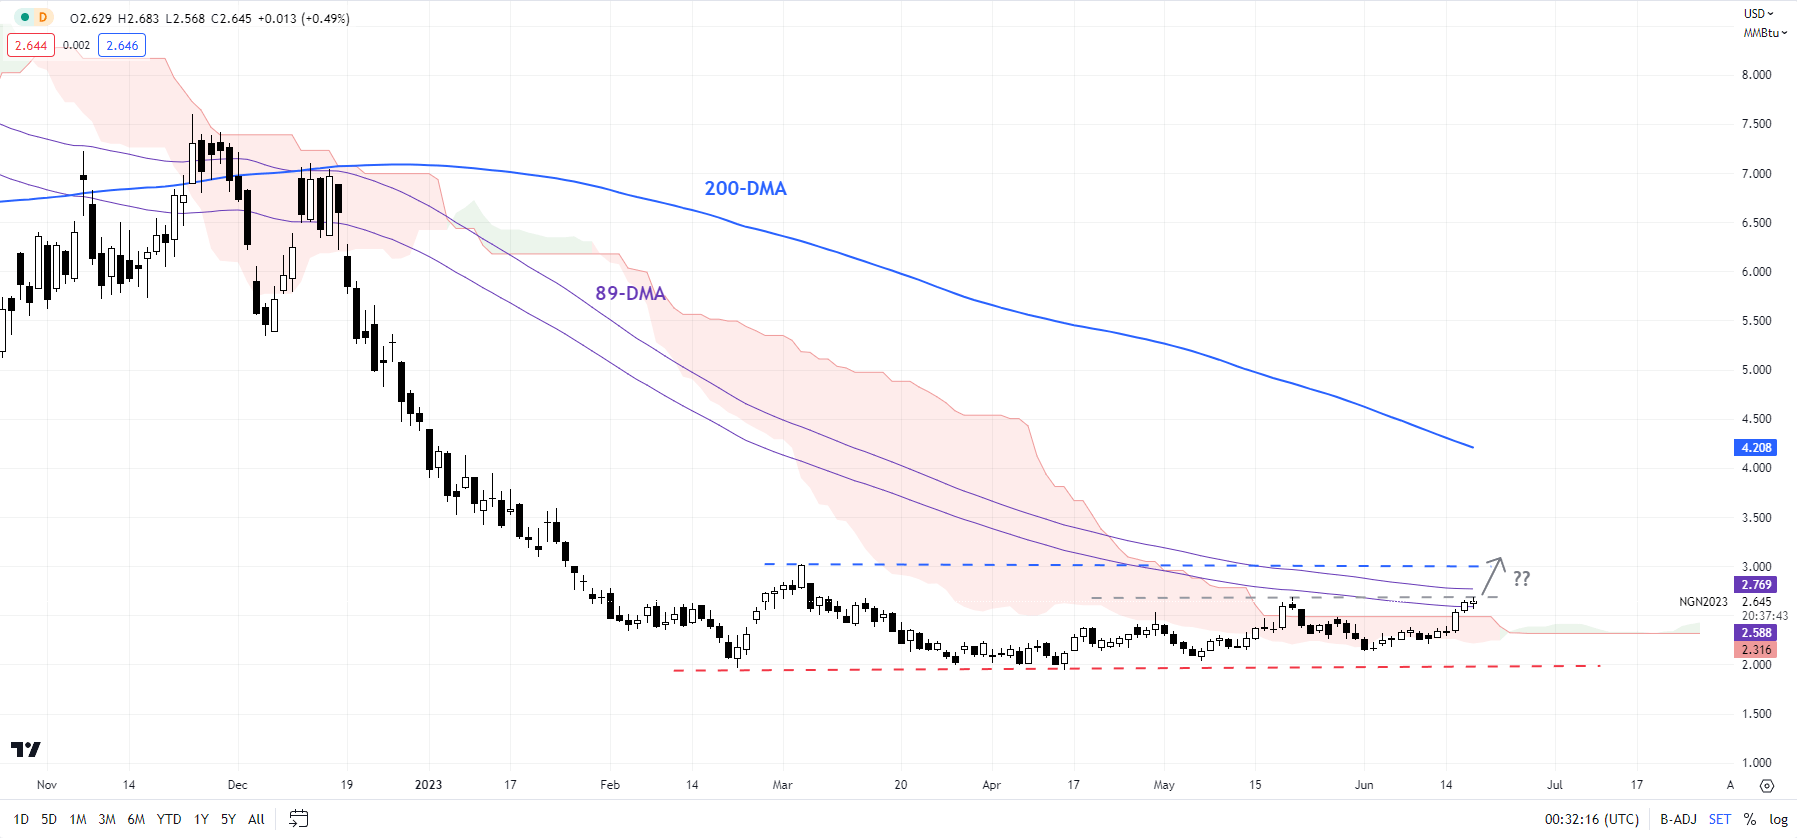
Natural gas is attempting to rise above a crucial converged resistance: the 89-day moving average, the upper edge of the Ichimoku cloud on the daily chart, and the May high. A break above the resistance is needed for the bottoming process to be confirmed. Any break above could open the door initially toward 3.03-3.20 (including the March high and the 30-week moving average). Any break above the converged barrier could expose the upside toward the 200-day moving average (now at about 4.20).

Natural Gas Daily Chart

image4.png

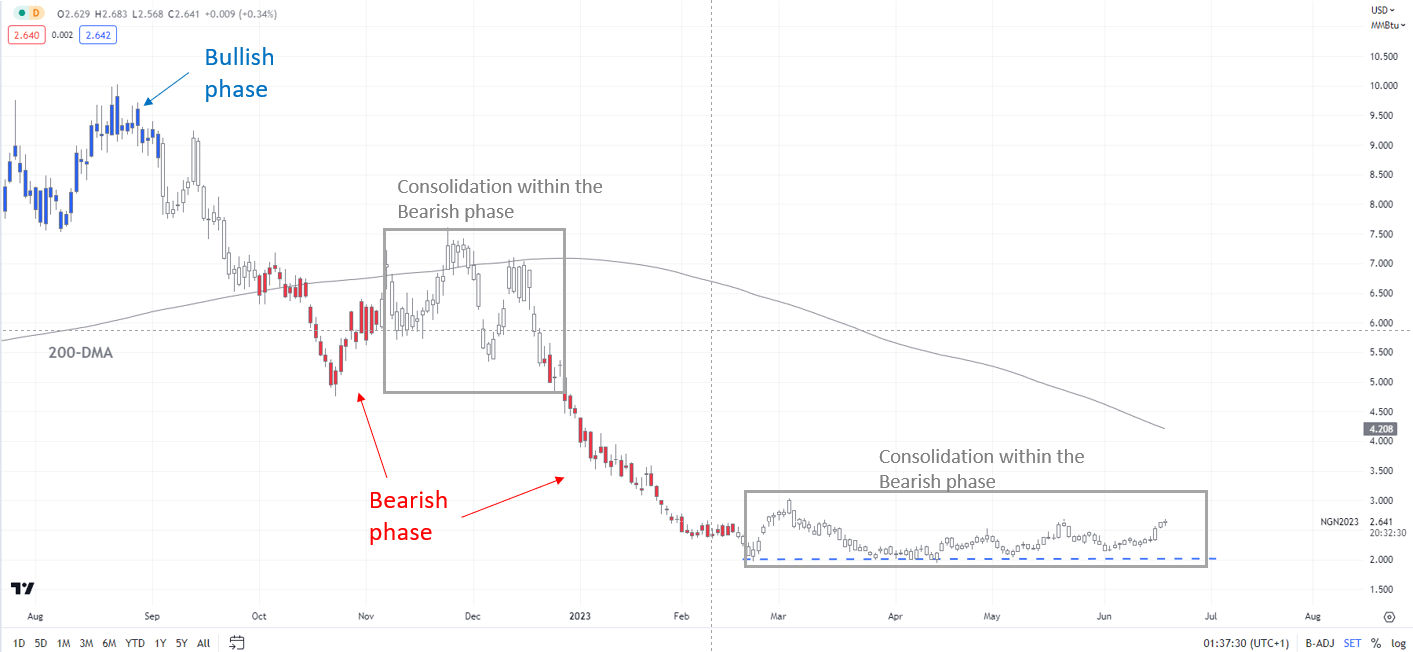
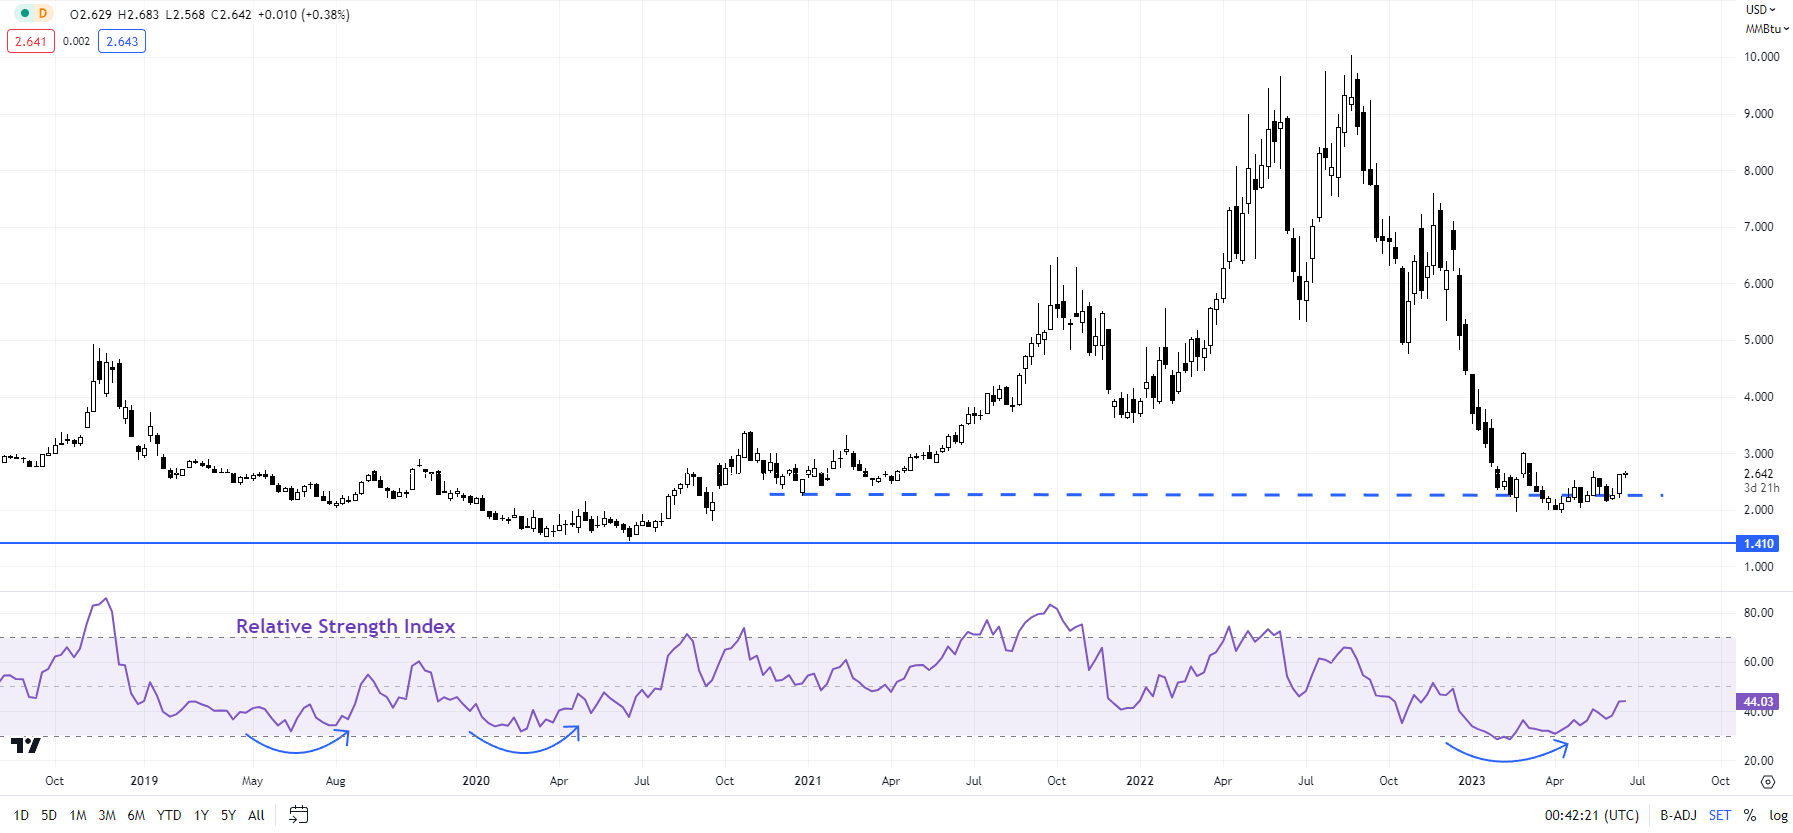
The downward pressure has abated in recent weeks as natural gas has found support around the psychological 2.00 mark. As highlighted in recent weeks, the trend is no longer bearish. See “Natural Gas Week Ahead: Base Building May Have Started”, published May 22, and “Natural Gas Price Rebound Could Extend; What’s Next For Crude Oil?”, published May 18. The possibility of natural gas bottoming was first highlighted in early 2023 – see “Natural Gas Price Action Setup: Is the Slide Overdone?”, published February 21.

Natural Gas Weekly Chart

image5.png

Note: The above colour-coded chart(s) is(are) based on trending/momentum indicators to minimize subjective biases for trend identification purposes. Blue candles represent a Bullish phase. Red candles represent a Bearish phase. Grey candles serve as Consolidation phases (within a Bullish or a Bearish phase), but sometimes they tend to form at the end of a trend. Note: Candle colors are not predictive – they merely state what the current trend is. Indeed, the candle color can change in the next bar. False patterns can occur around the 200-period moving average, or around a support/resistance and/or in sideways/choppy market. The author does not guarantee the accuracy of the information. Past performance is not indicative of future performance. Users of the information do so at their own risk.

Gold Price Treads Water as US Dollar Steadies and GBP Rolls Over Ahead of BoE

Gold Price Treads Water as US Dollar Steadies and GBP Rolls Over Ahead of BoE

The gold price is struggling on Tuesday with the US Dollar currying some favour despite the US being on holiday Monday.

While the main Wall Street indices were closed, the Treasury cash market is open, and yields have managed to tick higher across the curve.

The higher rates of return appeared to underpin the ‘big dollar’ but most other developed market government bond yields also got a boost.

GBP/USD eased today despite 2-year Gilts (UK government bonds) hitting 5% for the first time since 2008. The 5- and 10-year part of the Gilts curve is also eyeing the peaks seen in October last year.

The moves come ahead of CPI data tomorrow and then the Bank of England on Thursday. The interest rate market is anticipating a lift in the official bank rate.

An exception in the government bond market today has been Japanese Government Bonds (JGB). Yields are unmoved there as USD/JPY is eyeing a 7-month peak.

It’s possible that jawboning might start emanating from Bank of Japan officials should its currency continue to depreciate.

Elsewhere, the upshot of US Secretary of State Antony Blinken’s visit to China, which concluded yesterday, was generally seen as progressive although there were no concrete breakthroughs.

The People’s Bank of China (PBOC) cut the 1- and 5-year loan prime rate by 10 basis points to 3.55% and 4.20% respectively.

While the move in the 1-year rate was in line with market expectations, there had been hopes of a 15 basis point downshift in the 5-year rate, where Chinese mortgages are typically priced off.

Crude oil prices have eased today with the WTI futures contract near US$ 71 while the Brent contract has dipped under US$ 76. Live prices can be found here.

The Aussie Dollar has clocked the largest losses going into Tuesday after RBA board meeting minutes were released today. They revealed that the members were not as convinced about hiking rates 25 basis points as originally perceived by markets 2 weeks ago.

The RBA’s Statement of Monetary printed immediately after the rate decision appeared to be slightly more hawkish than today’s minutes. Australia’s ASX 200 made some gains on the news.

Looking ahead, the US return from holidays and will see some housing data. The full calendar can be read here.

Fed Chair Jerome Powell will be giving his Semi-annual Monetary Policy Report to Congress on Wednesday.

GC1 (GOLD FRONT FUTURES CONTRACT) TECHNICAL ANALYSIS

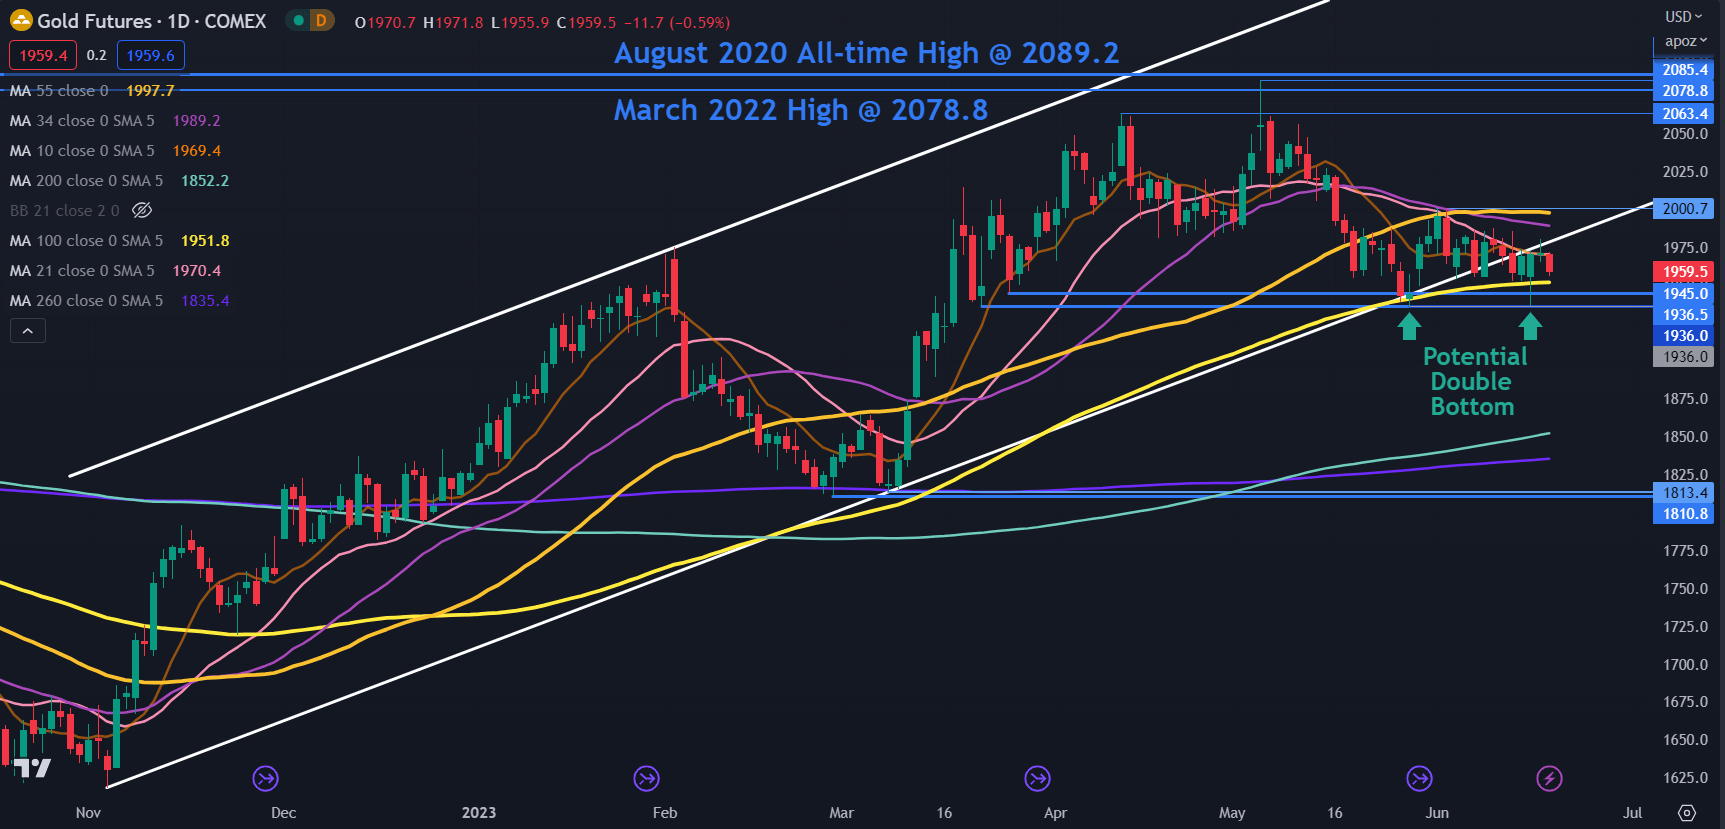
Gold’s recent dip below an ascending trend line has not been a convincing break. Support levels in the 1936 – 1945 area have held so far and might continue to do so.

Last Thursday’s low of 1936 has set up a potential Double Bottom that coincides with a previous low. The potential Double Bottom could be confirmed should it move above the neckline at 2000.

The push lower went under the 100-day Simple Moving Average (SMA) but the daily close was back above it.

This may suggest that recent bearishness could have been rejected by the market for now.

A clean break below that area may see a bearish run evolve, and the next support zone of note could be at the next Double Bottom of 1811 and 1813.

CTA BANNER HERE

If gold gets above the 55-day SMA, currently sitting just under 2000, it will be above all period daily SMAs, which may suggest that bullish momentum is evolving.

If it does break above 2000, it could run for a potential resistance zone ahead of the all-time high.

The early May high of 2085 eclipsed the March 2022 peak of 2079 but was unable to overcome the all-time high of 2089. This failure to break new ground to the upside has created a Triple Top which is an extension of a Double Top formation.

This has set up a potential resistance zone in the 2080 – 2090 area but a snap above those levels may indicate further unfolding bullishness.

image1.png


US reliance on China’s capital goods rules out decoupling

US reliance on China’s capital goods rules out decoupling

The bad news is that America hasn’t invested much in manufacturing during the past 20 years. The worse news is that most of the manufacturing capital equipment that America uses came from imports.

Not only does the US have a US$1 trillion trade deficit, but about $300 billion of that deficit comes from imports of capital goods, namely goods that make other goods.

Federal subsidies for chip fabrication plants and green energy have recently bulked up the numbers for factory construction, but orders for capital equipment remain depressed. The subsidy-driven increases in factory building help explain an enormous surge in US imports of capital goods.

America’s dependence on foreign capital goods reached an all-time high in 2022, as capital goods imports exceeded domestic production of capital goods for home use, according to Asia Times’ calculations.

To reduce its $1 trillion trade deficit, the US would have to invest in capital goods. But it would need to import most of these capital goods, which means that the trade deficit would have to increase in the short term in order to shrink in the long term.

Bets for Soaring UK Interest Rates May Unravel Over 30 Hours

Bets for Soaring UK Interest Rates May Unravel Over 30 Hours

Britain’s bond market is approaching an inflection point, with inflation data and a Bank of England decision set to shape the outlook for traders after yields rose to the highest level since 2008.

Those two events, due over 30 hours starting Wednesday morning, could bring a halt to upward momentum in interest-rate bets. Official data is expected to show inflation slowed to its lowest in 14 months, while investors are pricing in a 13th consecutive rate hike from the BOE to bring wage-price pressures under control.

BlackRock Inc., Invesco Asset Management and Royal London Asset Management are already dipping back into the market. They argue — along with many economists — that traders are anticipating more hikes than the BOE is likely to deliver, and it’s an opportunity to lock in some of the highest bond yields in the developed world.

“The market’s pricing of five more hikes from the BOE is very unlikely,” said Alexandra Ivanova, a fund manager at Invesco. “The Bank has a lot of constraints making it unable to deliver on these expectations. Growth is one of them, and inflation is almost certainly a structural issue.”

Britain has the worst inflation problem in the Group of Seven nations but the outlook is improving, thanks largely to a sharp drop in electricity and natural gas prices as well as slower growth in the cost of food.

Economists expect the inflation rate to decelerate to 8.4% in May from 8.7% in April. BOE officials see inflation easing further for the rest of the year.

The release will loom large over the Monetary Policy Committee’s thinking as it prepares to set rates on Thursday. The median estimate in a Bloomberg survey is for a quarter-point increase to 4.75%, the highest since 2008.

“The BOE’s near-term messaging will depend heavily on the inflation print,” said Bruna Skarica, an economist at Morgan Stanley. She is penciling in a 25 basis-point hike, yet doesn’t anticipate “overly hawkish messaging” from the MPC ahead of the August forecasting round.

The market is less sanguine. Traders drove up rate expectations over the last few weeks after labor market data showed an unexpected tick down in unemployment, indicating wage pressures will continue for some time.

They now see four additional hikes until the end of the year and attribute a small chance of final move to 6% in early 2024, which would be the highest since the turn of the century.

For some investors that means a turning point in interest rates is near. They are moving to lock in returns, betting yields may not rise much further.

Invesco bought long-duration gilts last week, when yields surged to the highest since 2008. BlackRock recently ditched a long-held underweight position, while Royal London Asset Management also used the selloff to buy UK government bonds.

What Bloomberg Economics Says …

“There is some speculation among investors that a string of hotter-than-expected pay and inflation data could prompt the Bank of England to opt for a 50-basis-point hike at its June meeting. We think that’s unlikely. Rate expectations have already moved materially higher — the central bank doesn’t need to provide a further impulse with a hawkish surprise. Our base case is for a 25-bp move.

—Dan Hanson and Ana Andrade, Bloomberg Economics. Click for the PREVIEW.

Another issue the market must weigh is that the tightening priced in now would be a disaster for what’s an already fragile economy.

The BOE anticipates medium-term growth around 1%, far lower than the rate of inflation and tightening a cost-of-living crisis. Rates anywhere near 6% would squeeze the economy further, with more than 1 million households due to refinance their mortgages this year.

That all points to a stagnating economy with slower price growth, opening the door for the BOE sometime this year to halt its quickest series of rate hikes in four decades.

Still, if inflation keeps pushing higher there’s likely more pain in store for bond holders. The rate has surprised on the upside in each of the three previous reports.

“It’s hard to say they are not cheap at the moment,” said Stuart Cole, chief macro economist at Equiti Capital in London. “But there is probably room for them to cheapen a bit further still. If we get a strong CPI number, then I think we will see yields tick higher once more.”

Pairs in Focus This Week – AUD/USD, EUR/USD, USD/JPY, GBP/USD, NASDAQ 100, Gold, DAX, Hang Seng

Pairs in Focus This Week – AUD/USD, EUR/USD, USD/JPY, GBP/USD, NASDAQ 100, Gold, DAX, Hang Seng

AUD/USD

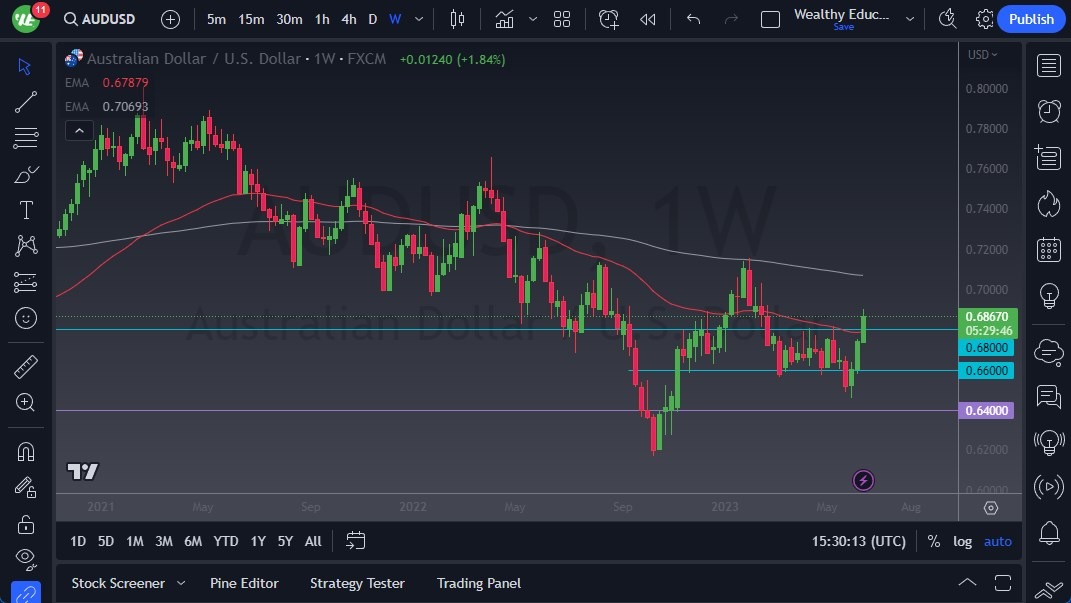
The AUD/USD has rallied rather significantly during the course of the week, breaking above the 0.68 level. The market threatened the 0.69 level on Friday but did pull back a bit. At this point, it does make a certain amount of sense we get a short-term pullback, but if we can hold the 0.68 level on some type of bounce, it’s likely that this market will try to get to the 0.70 level above. On the other hand, if we were to take out the bottom of the weekly candlestick, then the Aussie would more likely than not drop toward the 0.66 level.

AUD/USD

EUR/USD

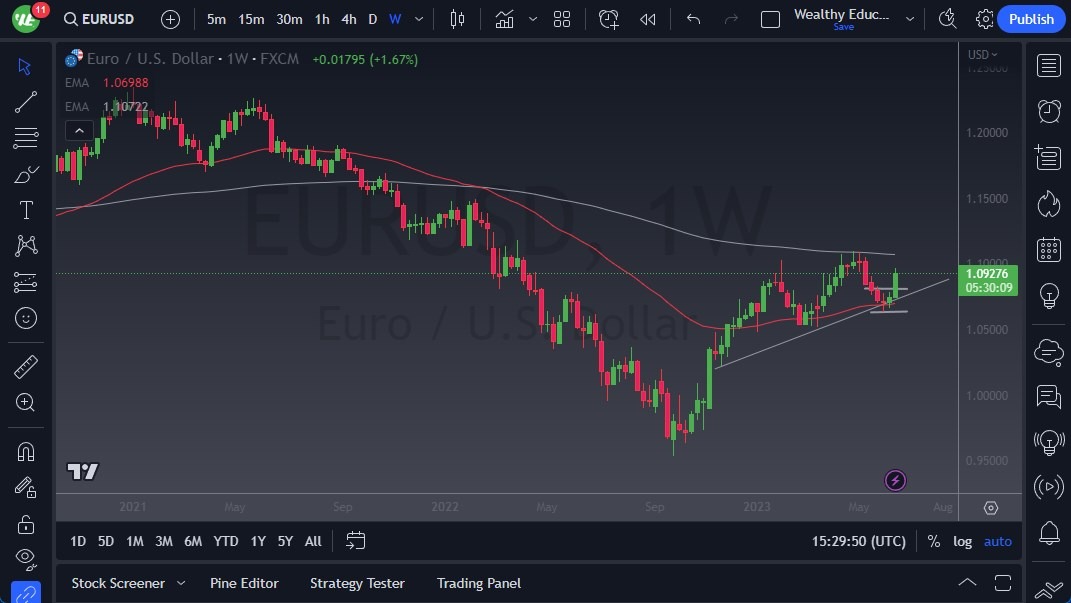
The EUR/USD has rallied during the course of the trading week, breaking above the 1.09 level after the ECB raised interest rates, while the Federal Reserve chose to hold interest rates. All things being equal, the 1.10 level above is a psychological barrier that people will be paying attention to. That being said, it looks like we are starting to show a little bit of exhaustion on Friday, so I do think that a short-term pullback is likely. However, I do not expect a big move in the short term as I think we are still stuck in a range.

EUR/USD

USD/JPY

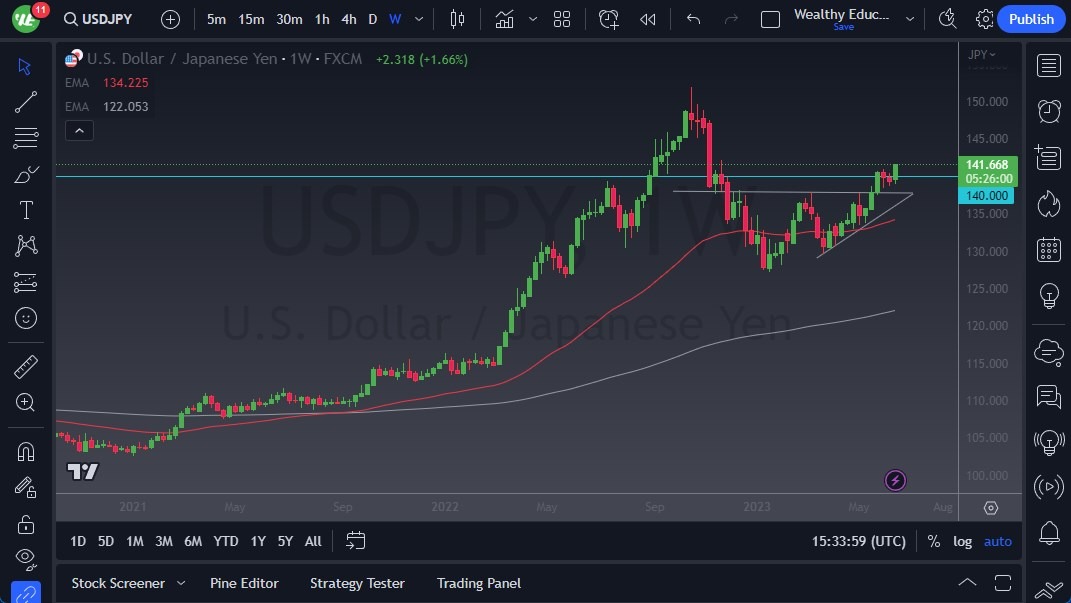
The USD/JPY has rallied significantly during the course of the week, as we continue to see a lot of very bullish behavior. The ¥140 level is going to be psychologically important, but the real support is going to be down at the ¥138 level. The ¥138 level is the top of an ascending triangle, and therefore it should be a massive “floor in the market.” As long as the Bank of Japan remains this loose with monetary policy, I just don’t see how the trajectory does anything but go higher. In fact, the “measured move” suggests that we could be going as high as ¥148 based upon the ascending triangle, and perhaps even the massive “W pattern.”

USD/JPY

GBP/USD

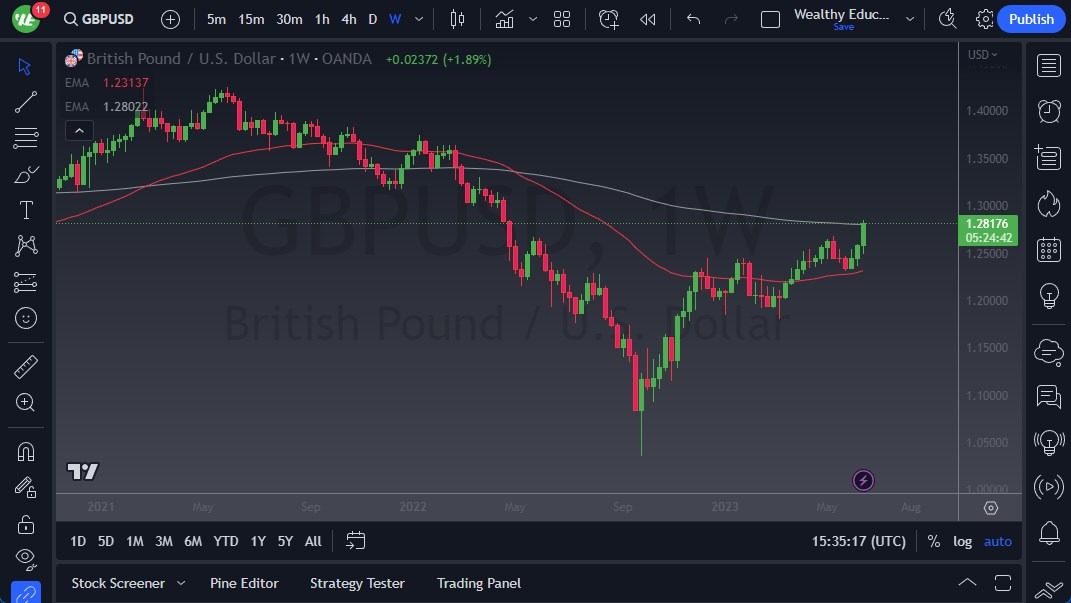
The GBP/USD has rallied significantly during the week as well, as it has been a rout against the US dollar. At this point, the market is likely to continue to go to the upside, with a target of 1.30 above. Short-term pullbacks will offer buying opportunities, but you will be better served waiting for some type of value to appear. After all, the selling off of the US dollar is still fresh, and of course might even be a little overdone in the short term.

GBP/USD

NASDAQ 100

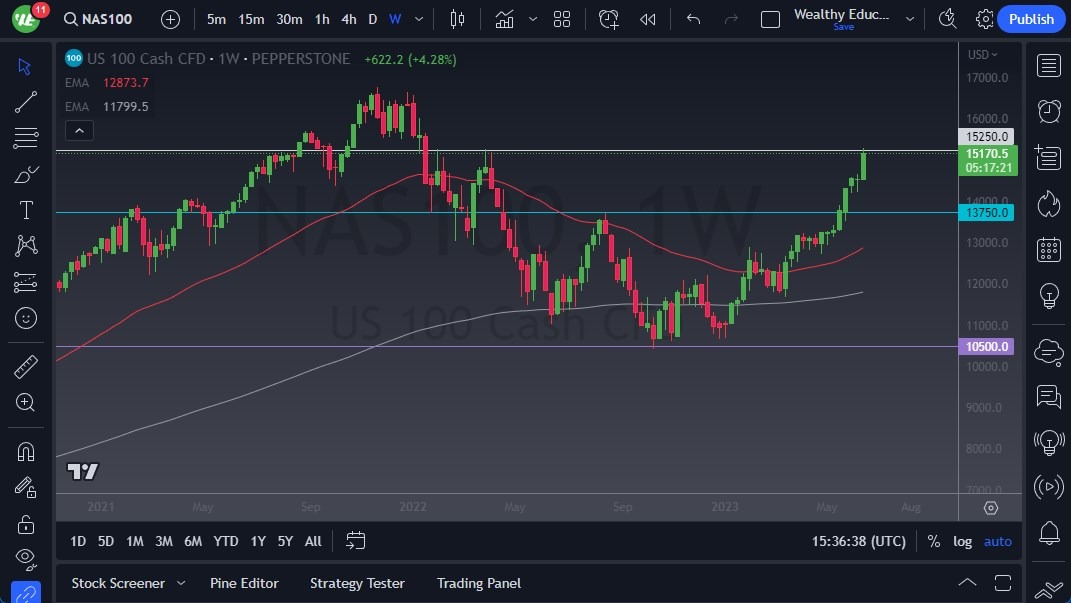
The NASDAQ 100 has shot straight up in the air during the course of the trading week, testing the crucial 15,250 level. This is an area that has been a major resistant barrier previously, and therefore I think you will have to pay close attention to it. If we break above there, then we could go much higher, perhaps looking to the 16,000 level. Short-term pullbacks at this point continue to be buying opportunities from what I can see, even though it’s obvious to me that we are overbought. Quite frankly, this is a massive “FOMO market.” Keep in mind that the NASDAQ 100 is driven higher by about 7 stocks, so unless Tesla and the other start falling, this market will be squeezed higher.

NASDAQ 100

Gold

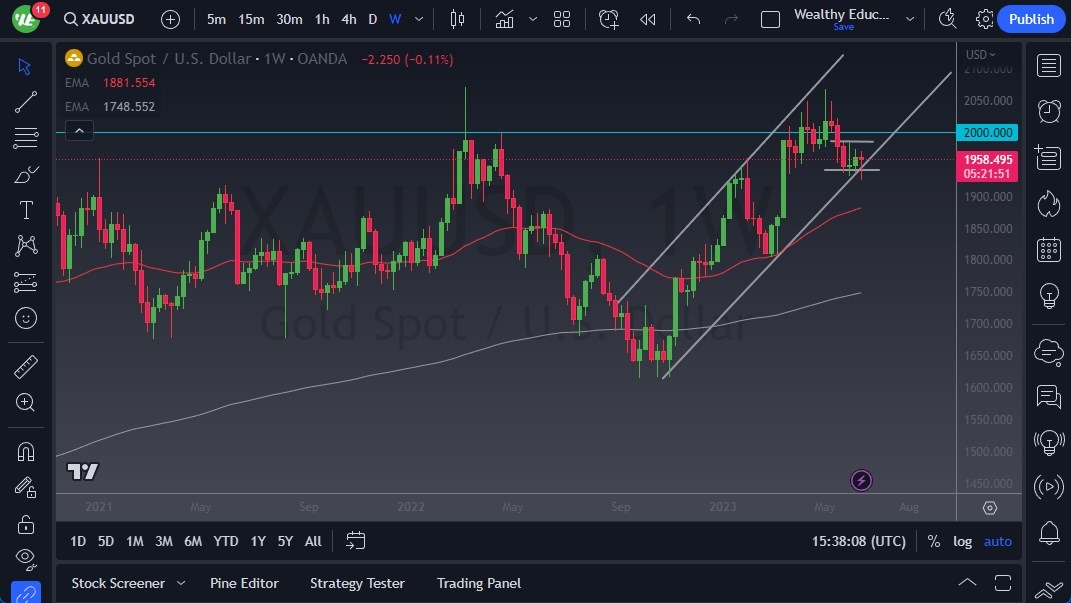
Gold markets initially fell during the trading week but turned around to show signs of life and form a massive hammer. This hammer was based around the $1950 level, an area that has been important multiple times. With that being the case, I think we’ve got an opportunity to get a little momentum in the market to the upside. If we can break above the $2000 level, then it’s likely that gold will start racing toward that high again, threatening the “triple top.” That being said, I think in the short term gold is more likely than not to stay in this $50 range, so if you are a short-term trader, this might be a good market for you.

Gold

DAX

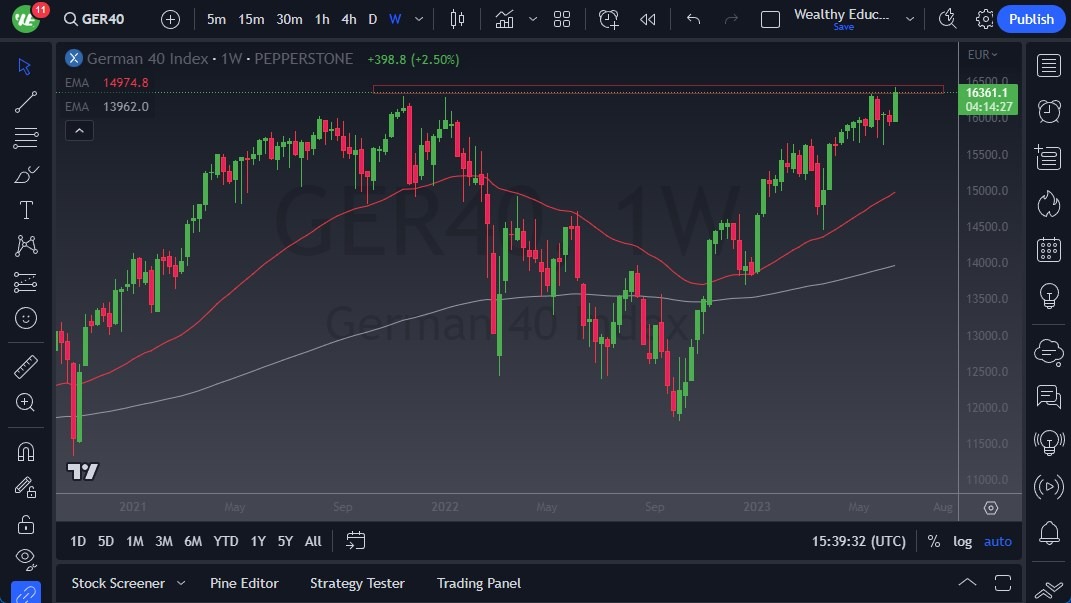
The DAX rallied during the course of the week, reaching highs again, and even breaking out to a fresh, new high. At this point, it looks like the DAX is ready to continue going higher, and a break above the top of the weekly candlestick certainly is very bullish. It’s worth noting that even though the European Central Bank raised rates during the course of the week, it seems as if the stock market in Frankfurt simply chose to ignore this. We have seen a lot of bullish pressure recently, and I think that will continue to be the case going forward. This will be especially true if the Euro starts to lose a little bit of strength.

DAX

Hang Seng (Hong Kong 50)

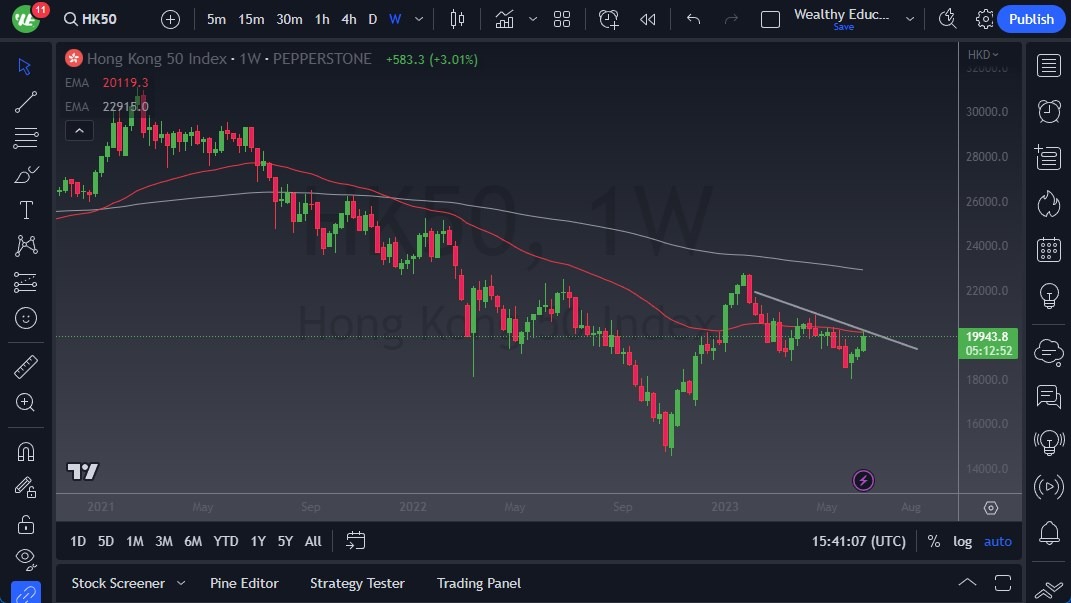
The Hong Kong 50 has had a rather bullish week, touching the 50-Week EMA near the HK$19,950 level. Having said that, we are right at the convergence of not only the 50-Week EMA, but also a short-term downtrend line. The question now is whether or not this and of course the HK$20,000 level will offer enough resistance to keep the market from breaking out. If the market were to break above HK$20,000, then you could see a bigger move, perhaps up to the HK$22,000 level. In that vicinity, you would be testing the 200-Week EMA.

On the other hand, if the market fails in this area, it’s very likely that the HK 50 will go looking toward the HK$18,000 level again, as it has been in a downtrend for a couple of years now. Furthermore, some of the data coming out of China is starting to deteriorate.

Hang Seng

China’s Big-City Homeowners Cash Out as Wealth Dream Fades

China’s Big-City Homeowners Cash Out as Wealth Dream Fades

Chinese homeowners are losing conviction in their decades-long belief that property is a reliable store of wealth, undermining even coveted markets like Shanghai and adding pressure on authorities to find new sources of economic growth.

Asking prices in the financial hub have slumped for three straight months, falling to the lowest level since before China emerged from Covid lockdowns at the end of last year, according to data compiled by Centaline Group.

Despite surging inventory, transactions in the city tanked by one third to about 16,000 units in May compared with March, the Economic Observer reported this month.

Interviews with homeowners, real estate agents and analysts suggest the downturn has been fueled by waning faith that property will always be one of China’s safest investments.

While that shift in mindset has in some ways been welcomed by policy makers seeking to rein in speculative buying, the risk of a deeper-than-desired slump is rising at a time when the broader economy is losing momentum. Longer term, authorities may struggle to replace real estate as a key driver of growth and bulwark of the nation’s vast middle class.

“Selling pressure is really piling up here” in Shanghai, said Jun Li, chief investment officer at Power Sustainable (Shanghai) Investment Management, a Canadian financial firm. “It seems homeowners have reached a consensus that the market has peaked.”

Cashing Out

Song, a banker who recently sold his apartment in Shanghai’s prestigious Jing’an district for about 10 million yuan ($1.4 million), said he views this as one of the last windows to cash out of the property boom.

The 35-year-old still owns other properties in China with his family, but wants to reduce exposure to the sector due to expectations of property taxes and a prolonged slowdown in the sector. He asked to be identified by his last name for privacy reasons.

His experience is matched across the country. Existing home prices in 100 cities recorded the biggest decline in May since at least 2022, according to data compiled by real estate research firm China Index Academy.

“Shanghai has the most sluggish existing-home market in China right now,” said Yan Yuejin, a research director at E-house China Research and Development Institute. “Across the nation, supply and demand in the secondary market have also deteriorated.”

Homeowners in the southern metropolis of Shenzhen have cut prices to the lowest since October 2016, according to data compiled by Centaline Group.

People are seeking to sell due to concerns about the economic outlook, financing needs for cash-strapped businesses and unemployment, Li said.

In Hangzhou, the home base for Alibaba Group Holding Ltd., a seller in the suburbs cut asking prices by 17% after failing to find a buyer in six months, according to a housing agent surnamed Gong, who requested to be identified by her last name because she wasn’t authorized to speak publicly.

The weakening sentiment in China’s real estate sector is prompting policy makers to weigh new support measures to keep the economy afloat, Bloomberg reported this month.

Regulators are considering reducing down payments in some non-core neighborhoods of major cities, lowering agent commissions on transactions, and further relaxing restrictions for residential purchases.

Different Cycle

The days of roaring demand are unlikely to come back any time soon, according to Goldman Sachs Group Inc. analysts, who said China could experience an “L-shaped” real estate market.

This “cycle is different from previous rounds, as policymakers appear very determined not to use the property sector as a short-term stimulus tool,” Goldman analysts wrote in a June 11 note. “We believe the policy priority is to manage the multi-year slowdown rather than to engineer an up-cycle.”

Read More: China Home-Price Growth Weakens as Housing Recovery Falters

Longer term, China is experiencing a structural shift due to its aging population, and limited scope for moving more people into cities. The country’s urbanization rate is expected to peak at about 75%, up from 64.7% in 2021 — all of which is weighing on sentiment.

Such pessimism is increasingly showing in Shanghai, as tough Covid measures in the last three years and weakening confidence in China’s economic outlook pushed homeowners and tenants — many of whom are expats — to pack and leave.

Shanghai Exodus

Favored by foreign companies, Shanghai was home to a quarter of China’s expatriate population before 2022. The city saw an exodus after the lockdown that kept nearly 25 million people confined to their homes for more than two months.

About 25% of Germans living in the city left in the fallout, while the number of French and Italian citizens registered with their governments each fell by 20%, according to a report by the Shanghai chapter of the European Union Chamber of Commerce early this year.

In Lianyang, a downtown neighborhood popular with expats and financiers in Shanghai, residential prices have slid 15% to 20% from record highs in mid-2021, according to a local property agent who asked to be identified by her surname Liu, because she wasn’t authorized to speak about the matter publicly.

Yi, a 31-year-old Shanghai resident, sold her suburban home in April for 4 million yuan, representing a steeper-than-expected 11% discount to her initial asking price. Second-hand inventory reached a record-high at 200,000 units that month, according to the Economic Observer.

She was in urgent need of cash and requested to be identified by her last name for privacy reasons. “It’s a buyers’ market now,” she said.