Japan’s PM Kishida: To mobilize all policy steps to ensure wage growth

Japan’s PM Kishida: To mobilize all policy steps to ensure wage growth

Japanese Prime Minister Fumio Kishida is sounding upbeat on the nation’s economic outlook, in his speech on Wednesday.

Key quotes

We can’t miss chance to increase wages.

To mobilize all policy steps to ensure wage growth.

Positive moves are appearing in Japan’s economy.

Will create new investment package for areas including semiconductors and energy.

Aiming for a V-shaped recovery in inbound tourists by 2025.

GBP/USD climbs toward 1.2800 on hot UK inflation

GBP/USD climbs toward 1.2800 on hot UK inflation

GBP/USD gained traction and advanced toward 1.2800 with the initial reaction to the UK inflation data, which showed that the Consumer Price Index (CPI) rose 8.7% on a yearly basis in May, matching April’s increase and surpassing the market expectation of 8.4%.

GBP/USD fluctuates in a narrow channel slightly below 1.2800 in the European morning on Tuesday as investors refrain from taking large positions ahead of the UK inflation data on Wednesday. The negative shift seen in risk mood could cause the pair to extend its downward correction in the second half of the day.

The People’s Bank of China (PBoC) announced early Tuesday that it lowered the benchmark Loan Prime Rates (LPRs) by 10 basis points (bps) as expected. This decision revived concerns over a slowdown in global economic activity, making it difficult for risk-sensitive Pound Sterling to find demand.

Meanwhile, market researcher Kantar said that grocery inflation in the UK continued to soften in June, falling from 17.2% to 16.5% in the four weeks to June 11. “This is the lowest rate of grocery price inflation we’ve seen in 2023, which will be a relief to shoppers and retailers,” said Fraser McKevitt, head of retail and consumer insight at Kantar.

On Wednesday, the UK’s Office for National Statistics (ONS) will release the Consumer Price Index (CPI) data for May. Following Kantar’s report, investors are unlikely to prematurely bet on the potential positive impact of a hot inflation reading on Pound Sterling.

Reflecting the risk-averse market atmosphere, US stock index futures are down between 0.4% and 0.6%, while the UK’s FTSE 100 Index trades flat following a positive opening. A sharp decline in Wall Street’s main indexes after the opening bell should support the US Dollar (USD) and weigh on the pair.

St. Louis Federal Reserve (Fed) President James Bullard and NY Fed President John Williams are scheduled to speak later in the day as well. Unless Fed policymakers adopt a dovish tone, the market mood should continue to drive GBP/USD’s action.

Bitcoin Prices Surge Past Key Trendline Resistance, BTC/USD Levels to Watch

Bitcoin Prices Surge Past Key Trendline Resistance, BTC/USD Levels to Watch

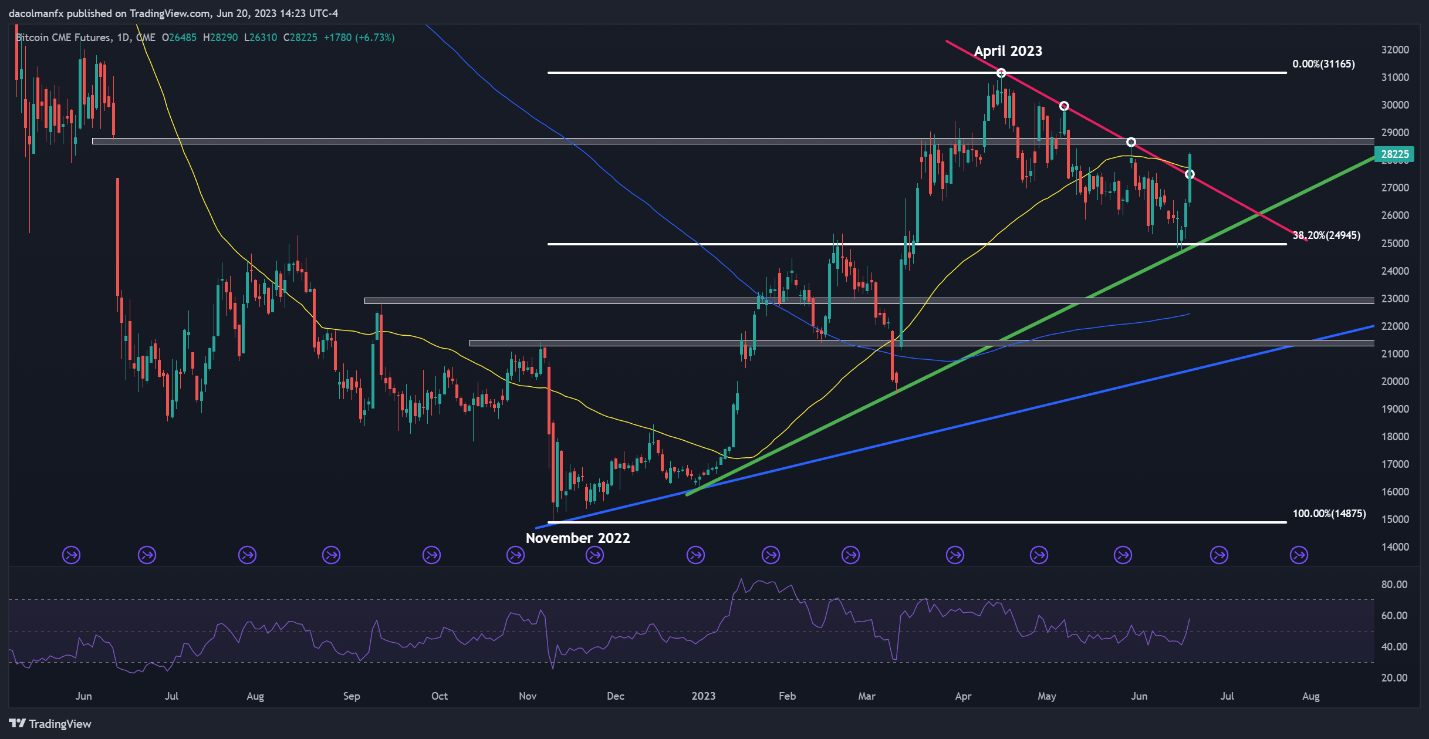
Soon after reaching multi-month highs above $31,000 in mid-April, bitcoin sold off aggressively, falling briefly below $25,000 late last week. The downward correction, however, appears to show tentative signs of having fully run its course, with sentiment stabilizing and dip-buyers returning, drawn to more attractive entry points.

The chart below reveals how the digital token has begun to recover after finding support near the psychological $25,000 threshold, where the 38.2% Fib retracement of the November 2022/April 2023 rally aligns with a medium-term trend line that has guided the market higher for nearly seven months.

The rebound gained momentum today after prices broke above dynamic resistance near $27,500 following news that EDX Markets, the cryptocurrency exchange backed by Citadel, Fidelity and Schwab, has launched operations, a move that signals renewed interest in digital assets.

From a technical standpoint, Tuesday’s breakout has pushed Bitcoin above its 50-day simple moving average, a positive development for trend watchers. If the bullish push is sustained, bulls may become embolden to challenge $28,700 soon. Upside clearance of this resistance could expose the 2023 highs.

On the flip side, if sellers regain the upper hand and spark a reversal, the first relevant support to keep in mind rests near $27,500. If this floor gives way, downward pressure could gather pace, setting the stage for a retest of the $25,000 area in short order.

BITCOIN TECHNICAL ANALYSIS

A screen shot of a graph  Description automatically generated with low confidence


Asia Day Ahead: Downbeat Start to the Week; Chinese Equities Weigh

Asia Day Ahead: Downbeat Start to the Week; Chinese Equities Weigh

Major US indices kicked off the shortened trading week in the red (DJIA -0.72%; S&P 500 -0.47%; Nasdaq -0.16%), although the sharp paring of losses mid-day especially in the Nasdaq may still reflect some strength in buyers. The key drag on market performance overnight comes from the energy sector (-2.3%), tracking a dip in oil prices, while the consumer discretionary sector shines on a 5.3% gain from Tesla.

The next two days will place Fed Chair Jerome Powell in the spotlight, who will offer his report on monetary policy and the economy to the House Financial Services Committee today before testifying to the Senate Banking Committee tomorrow. The Fed Chair may likely join his colleagues in retaining his hawkish tone, but with market participants not buying into Fed’s recent guidance lately, he will face a difficult task in having to provide the much-needed conviction for his rate outlook.

The day ahead will also leave eyes on UK inflation numbers, with expectations for a tick lower in the headline to 8.4% (previous 8.7%), but the core aspect is expected to reveal some persistence at 6.8% year-on-year, unchanged from April. Stubborn inflation is likely to reinforce a hawkish tone from the Bank of England (BoE) tomorrow, which has previously expressed their discomfort with the progress in its inflation fight.

The VIX has been struggling to move higher lately, hovering at its lowest level since February 2020. Following a 17% sell-off since the start of the month, the index has been forced into near-term ranging moves on the daily chart, revealing a flat-lined moving average convergence/divergence (MACD). Some attempts to stabilise seem to be at play, although it still lacks the catalyst for a sustained move higher. If seasonality is of any guide, it suggests that the VIX generally see greater upside in late-July until early-October. Near-term, a move back above the 18.00 level may provide some conviction of retesting the key 20.00 level.
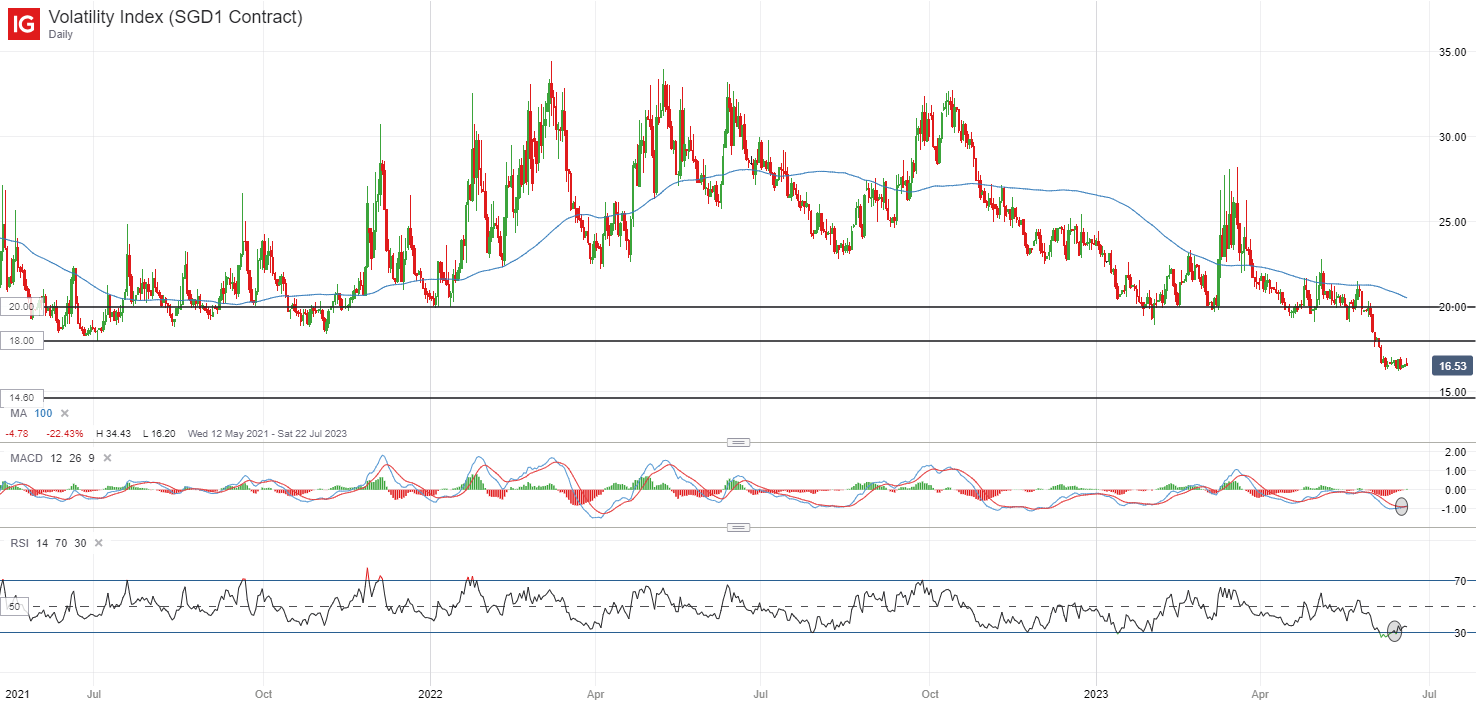
image1.png

Asia Open

Asian stocks look set for a subdued open, with Nikkei +0.23%, ASX -0.16% and KOSPI -0.29% at the time of writing. Chinese equities have failed to find much traction yesterday despite the series of rate cuts by the People’s Bank of China (PBOC), as market participants expect more to be done.

The Nasdaq Golden Dragon China Index plunged 4.9% overnight, while the Hang Seng Index retraces from its key psychological 20,000 level. The leadership change at Alibaba provides testament to the tough environment that Chinese companies operate in, despite regulatory risks taking more of a backseat and recent reopening efforts. On the calendar, early numbers of South Korea’s exports pointed to its first gain (5.3% year-on-year) since August 2022, but ongoing weakness in semiconductors and petroleum products may still provide little reason to cheer just yet.

The Nikkei 225 has retained some strength in today’s session, as the Relative Strength Index (RSI) has managed to revert from overbought to more neutral territory without much of a dip. A bearish crossover remains on its MACD, but previous attempts for a bearish cross (1 June 2023, 9 June 2023) has proven to be a bear trap, which provides less conviction that it should be looked upon as a solid guide. Perhaps one to watch in the near term will be its 20-day moving average (MA), which has been supporting the index steadily over the past two months. With the overall upward trend intact, any retracement may still leave the formation of a higher low on watch, potentially at the 32,000 level.
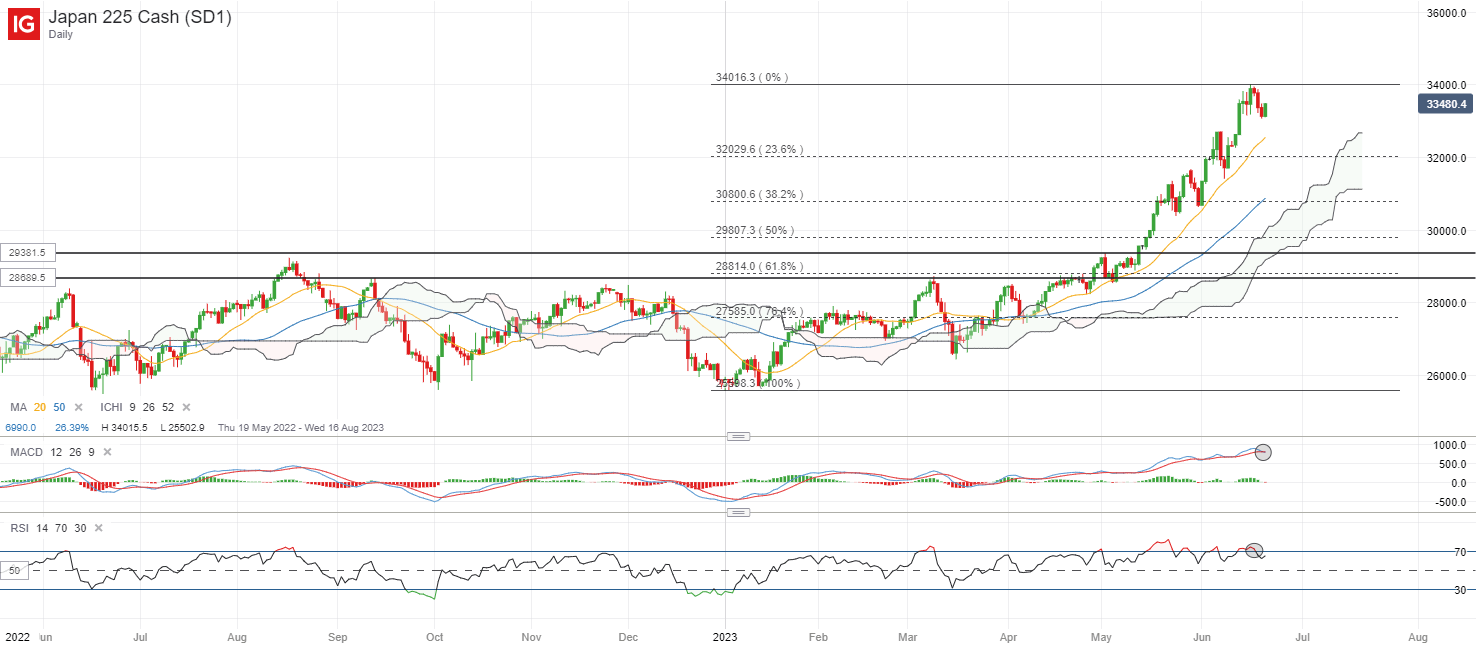
image2.png

On the watchlist: Copper prices back to retest resistance confluence at US$8,600/tonne level

Copper prices have been reacting positively to China’s policy-easing efforts lately, staging a recovery of close to 10% since late-May this year. Mounting hopes of a less-bad-than-feared demand outlook have surfaced, with more stimulus measures from China expected over the coming months while market participants continue to price that the Fed is heading towards its final stage of tightening next month.

Three straight week of gains have brought prices back to retest a key resistance confluence at the US$8,600/tonne level. Its RSI above the 50-mark and MACD attempting for a cross back to positive territory seem to support a near-term bullish bias, but a firm sit above the US$8,600/tonne level may still be warranted for the bulls, where the Ichimoku cloud on the daily chart awaits for a breakout.

Reclaiming the US$8,600/tonne level may potentially support a move to retest its March high at the US$9,100/tonne level. On the downside, immediate support may be on watch at an upward trendline around the US$8,270/tonne level.
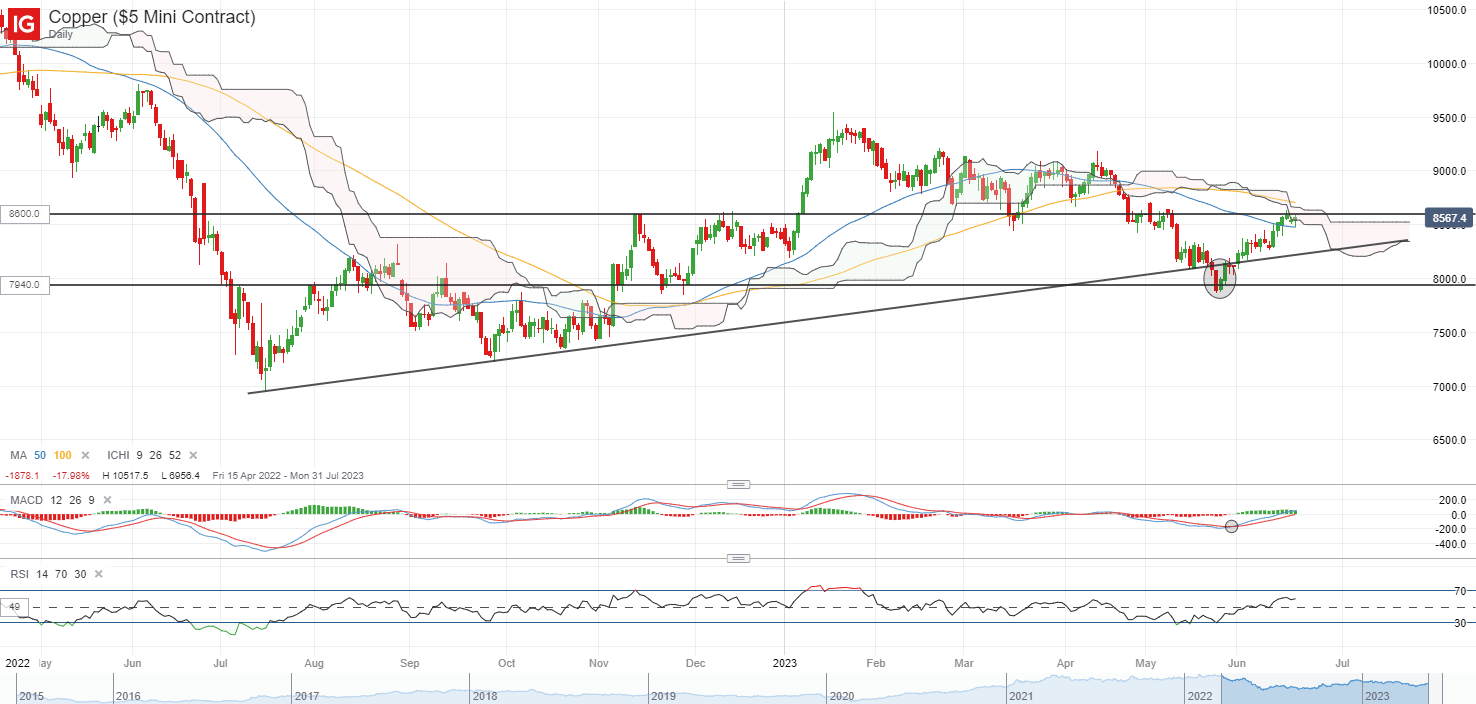
image3.png

Tuesday: DJIA -0.72%; S&P 500 -0.47%; Nasdaq -0.16%, DAX -0.55%, FTSE -0.25%

Article written by IG Strategist Jun Rong Yeap

S&P 500 & Nasdaq 100 Price Setups: Will Powell’s Speech Trigger a Reversal?

S&P 500 & Nasdaq 100 Price Setups: Will Powell’s Speech Trigger a Reversal?

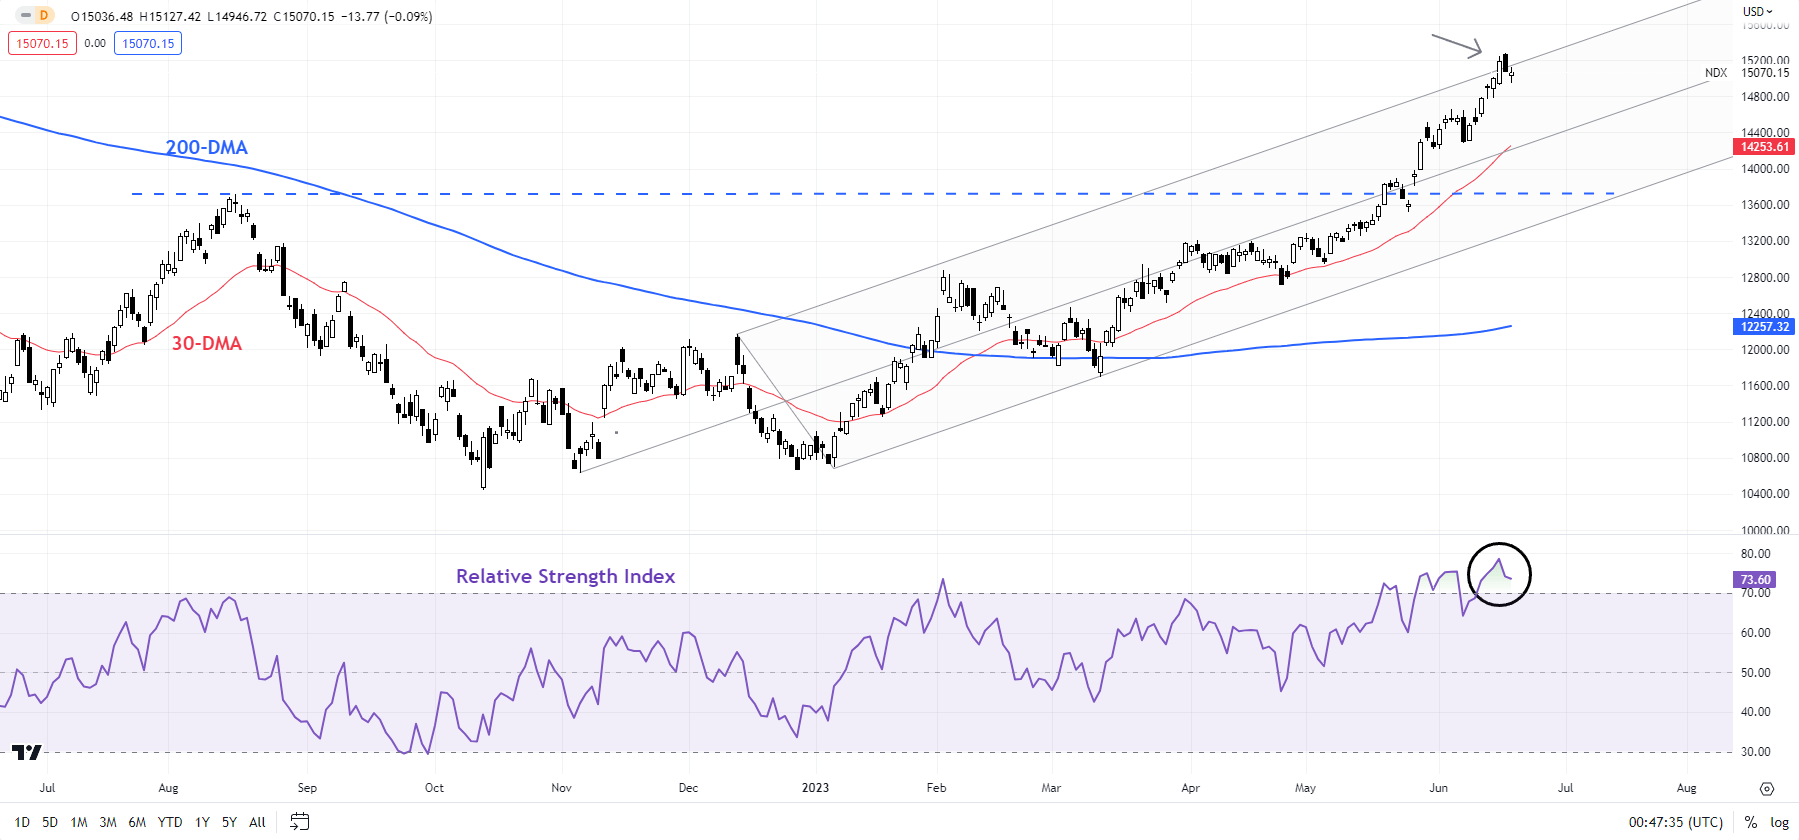
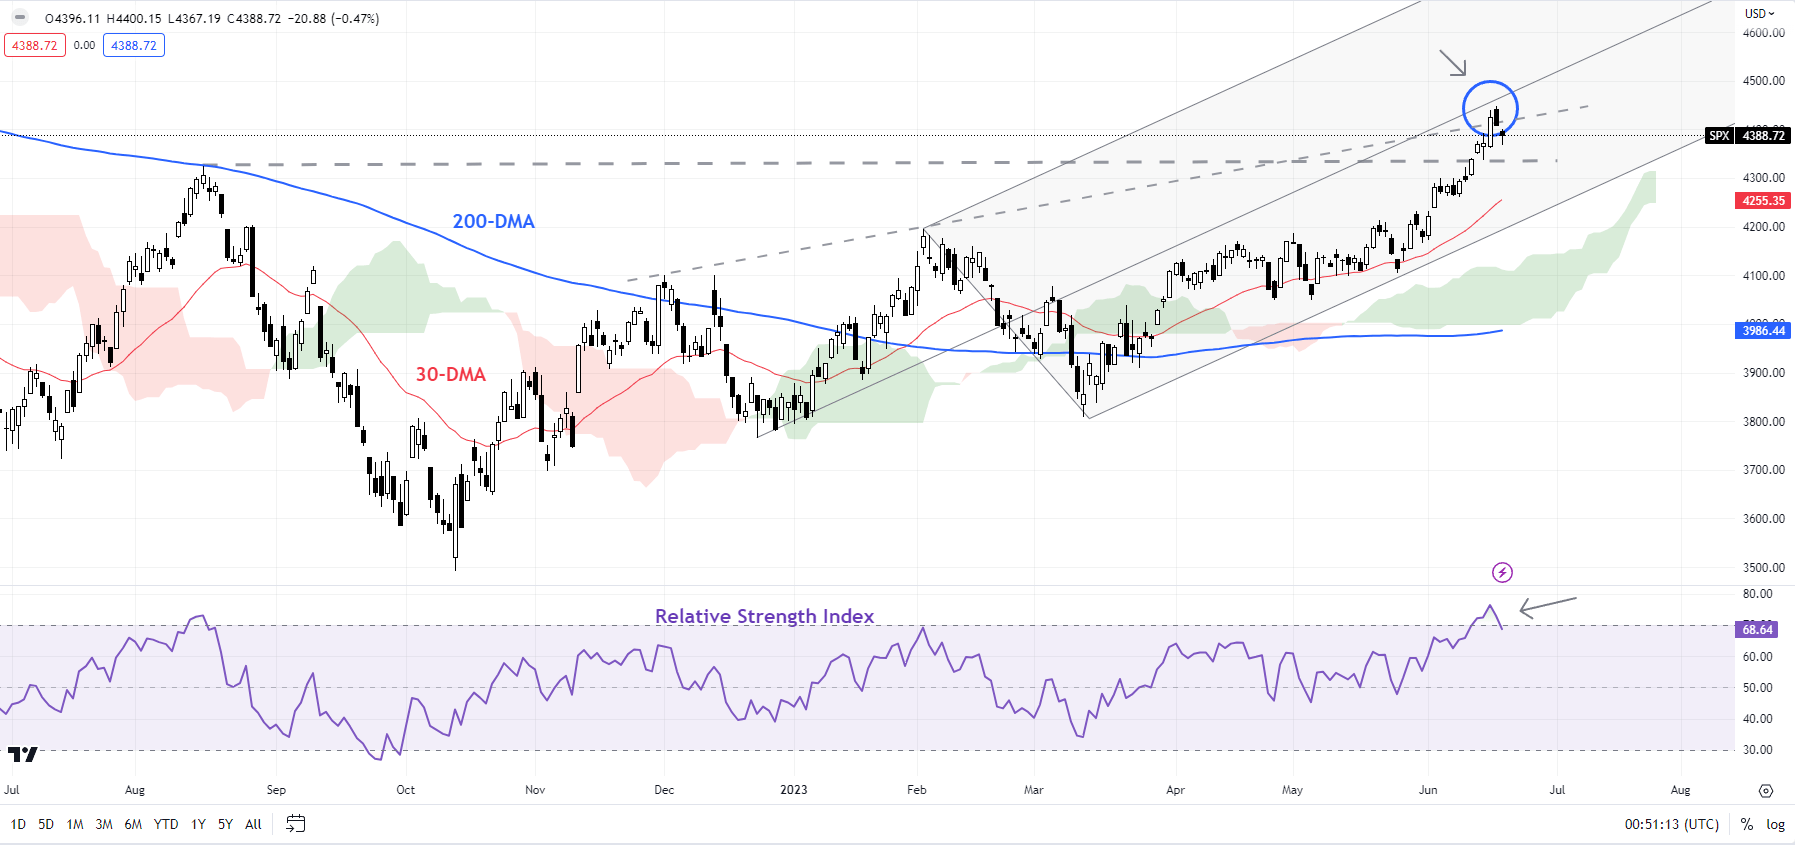
The S&P 500 and the Nasdaq 100 index are looking overbought and have run into stiff resistance areas, raising the risk of a minor retreat, especially if Fed Chair Powell’s tone later Wednesday is hawkish. However, any retreat is likely to be short lived given improved upward momentum on higher timeframe charts.

Markets will be looking for a justification for its dovish pricing from Powell’s congressional testimony due Wednesday and Thursday. Rate futures currently show a 78% chance of a Fed rate hike in July, with no hike until the end of the year. In contrast, the US Federal Reserve last week said that rates may need to rise by as much as 50 basis points by the end of the year on slower-than-expected moderation in inflation and resilience of the US economy.

A hawkish rhetoric by the Fed chair could provide an excuse to unwind some of the longs in equities, which appear to be overbought.

Nasdaq 100 Daily Chart

image1.png

Nasdaq 100: Overbought, but no sign of reversal

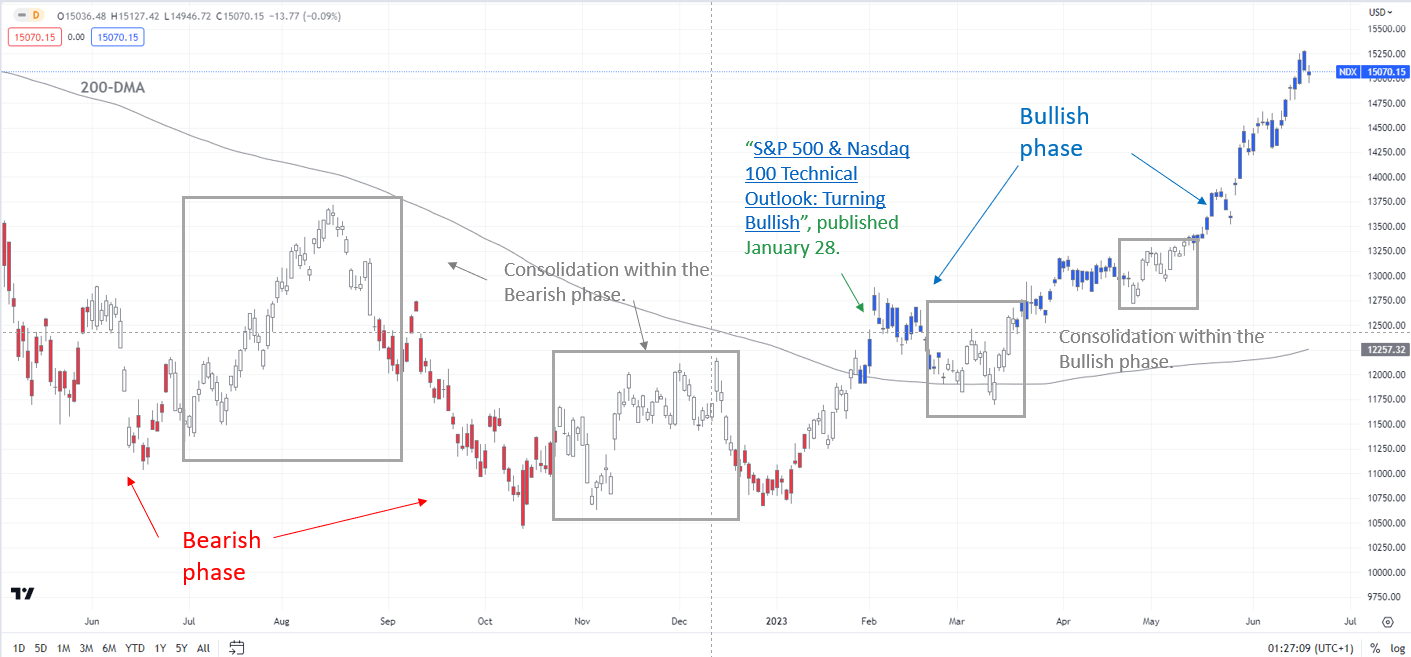
From a directional perspective, the trend remains up for the Nasdaq 100 and the S&P 500 index, as the colour-coded daily candlestick charts show. Moreover, in recent weeks, the uptrend has become more entrenched, looking at momentum on the daily and weekly charts, thanks to the raising of the US debt ceiling and the resilience of the global economy, as recent updates have highlighted. SeeMay 6,May 15, andMay 18updates.

Nasdaq 100 Daily Chart

image2.png

The Nasdaq 100 index in May rose above a stiff hurdle at the August 2022 high of 13720 but is now looking overbought in the near term. The index is now testing a big hurdle on the upper edge of a rising pitchfork channel from the end of 2022, near the April 2022 high of 15265. A minor retreat can’t be ruled out. Any retreat could be contained around the 30-day moving average (now at about 14250) – the moving average has served as good support since the beginning of the year. On the upside, the next level to watch would be the 2021 record high of 16765.

S&P 500 Daily Chart

image3.png

S&P 500: Meets tough resistance

The S&P 500 index has encountered serious hurdles recently after rising above the August high of 4325, including the upper edge of a rising channel from December and a rising uptrend line from the end of 2022. However, unless the index falls decisively below the 30-day moving average, the path of least resistance remains sideways to up. The next level to watch would be the April 2022 high of 4637, potentially the 2022 record high of 4819.

Note: The above colour-coded chart(s) is(are) based on trending/momentum indicators to minimize subjective biases for trend identification purposes. Blue candles represent a Bullish phase. Red candles represent a Bearish phase. Grey candles serve as Consolidation phases (within a Bullish or a Bearish phase), but sometimes they tend to form at the end of a trend. Note: Candle colors are not predictive – they merely state what the current trend is. Indeed, the candle color can change in the next bar. False patterns can occur around the 200-period moving average, or around a support/resistance and/or in sideways/choppy market. The author does not guarantee the accuracy of the information. Past performance is not indicative of future performance. Users of the information do so at their own risk.

Using the COT Report in Forex Trading

Using the COT Report in Forex Trading

The COT report is a weekly sentiment report that can provide forex traders with important information on the positioning of currency pairs. Issued by the Commodities Futures Trading Commission (CFTC) the COT report can be cross-referenced with a trader’s underlying forex strategy.

The forex market is not the only financial market included in the COT report analysis, which makes this valuable commentary for all traders.

COT Report Analysis in Forex Trading: Main Talking Points

What is the Commitment of Traders Report?

The Commodity Futures Trading Commission (CFTC) COT report offers a unique look at the positioning of futures traders across a broad range of markets, and it is quite often used as a proxy for the FX trading market. In the weekly report, the US regulator breaks down long and short positions and overall open interest according to three separate trading groups. Knowing where traders’ positions are in the forex market can be valuable information when constructing trade ideas.

It is a requirement of the CFTC that the largest futures traders in the world must report their positions. These positions can be easily tracked due to the margin they must pay to hold their large positions which the CFTC has been publishing since 1962.

More recently since the year 2000, reports are released every Friday at 3:30ET pm. This information can be highly valuable to traders due to the nature of people who come into the futures market. This includes institutions like hedge funds who enter to make a return above their respective index. Some of the largest companies in the world with real-time data of the health of an economy come to the futures market to hedge their exposure to price fluctuations of raw materials that they use to make their product. This allows traders to gauge the positioning of the market at that specific time.

Breakdown of the three main groups mentioned in the COT report:

  1. Commercial Traders – These are most often large multi-national corporations with commercial hedging interest in their respective futures markets. For example, a large Japanese manufacturer may want to hedge their exposure to fluctuations in the USD/JPY exchange rate.
  2. Non-Commercial Traders – This data most often relates to large speculators such as Commodity Trading Advisors and similarly large institutions speculating in specific futures markets. For example, a major commodity fund believes that the US Dollar will appreciate against the Euro and, as such, place bets on Euro forex futures.
  3. Non-Reportable Traders – Non-Reportable Traders are traders who don’t fall into either group. Most often seen as small speculators, these are arguably less significant and do not frequently figure into COT report analysis. For example, these traders refer to the leveraged players without deep pockets who are shaken out on big moves

With these general definitions in mind, traders can then decide how to use this information. The image below depicts an extract from the COT report with the three main groups as outlined above.

EUR/USD COT Report:

COT report example

Source: CFTC

COT Report Trading Strategies

Upon the first reading of the COT report, it may seem confusing how future positions in USD, JPY, GBP or EUR could be helpful for trading EUR/USD, USD/JPY, or EUR/GBP. There is a lot to learn about the COT report but what’s often helpful is to find where there is a strong divergence between large speculators and large commercials.

USD/JPY COT Report:

USD/JPY COT report

USD/JPY chart confirmation of Non-Commercials selling USD/JPY long positions:

The first place to start with is a clean understanding of ‘net positioning’ which is shown clearly on the report itself, as well as the week over week differential of major market bias (circled above).

The specific number is not necessarily important, but rather a clear sign in percentage terms of open interest which makes it easy in identifying ‘Non-Commercials’ flipping against the primary trend. Furthermore, when a key flip in sentiment of ‘Non-Commercials’ is realized and there is a confirmation on the charts that a trend is exhausting, traders are likely trading in the same direction of the big kids.

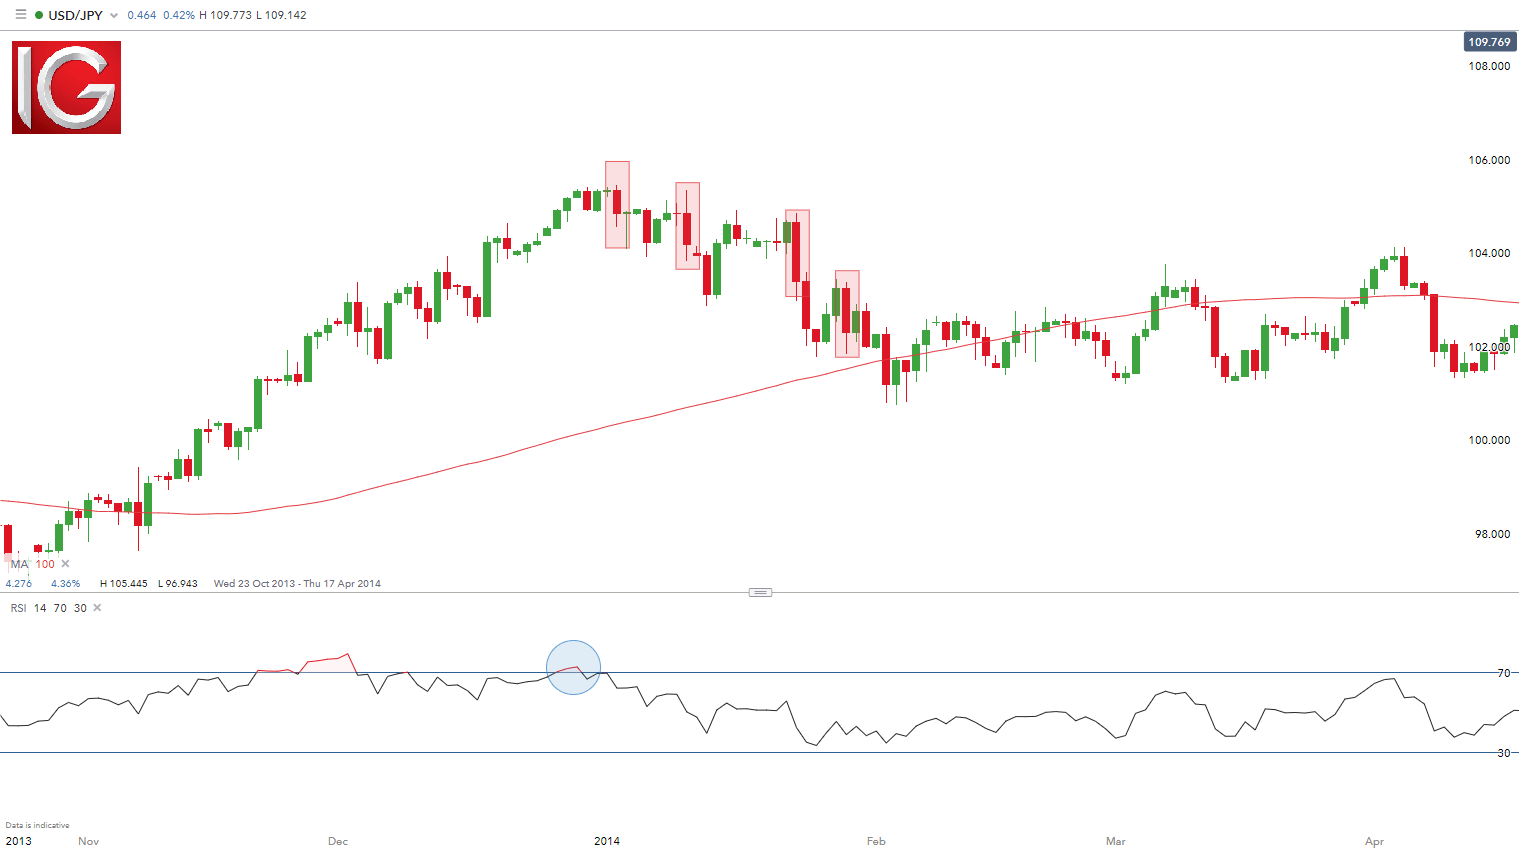
From the report located above, the number of funds off-loading the JPY shorts increased dramatically from the week prior. When this type of shift from major funds is observed, traders can look for other signs that show the prior trend is losing steam which could indicate a possible exit of open positions. The chart above of USD/JPY notes that there have been four bearish key days (highlighted in red) on USD/JPY since the start of 2014 at the same time non-commercials have unloaded their USD/JPY long positions giving credence that this move down may have more to go. Further validated by the technical indicators used in the chart – RSI and 100-day moving average which both signal a bearish bias.

Using the DailyFX COT Analysis Report

Another excellent tool, is the Commitment of Traders Analysis from DailyFX. This weekly report provides analysis of the CFTC report, showing the positioning of forex futures trades with a synopsis of the key flips in positioning. This report also helps traders by providing 52-week percentiles of major moves, showing annual bullish / bearish extremes which assist in trade execution – tightening stops or looking for price action to confirm the funds are selling out.

Summary: Look for chart validation of how the ‘Non-Commercial’ traders are positioning themselves. With a large percentage (greater than 10%) of ‘Non-Commercials’ flipping their bias, traders should take note of this. Lastly, traders can increase their understanding of market sentiment and get a better feel for how a sample group of the ‘Non-Reportable’ or smaller traders are positioned in OTC forex via the IG Client Sentiment Index which is updated twice a day.

Japanese Equities Outlook: Does the Nikkei 225 Rally Have More Legs to Run?

Japanese Equities Outlook: Does the Nikkei 225 Rally Have More Legs to Run?

Nikkei 225 has been the clear outrunner year-to-date

Year-to-date, the Nikkei 225’s performance has way towered above its peers, surging more than 30% to cross the 33,000 level for the first time since 1990. With the index failing to deliver a new record high for more than 30 years ever since its asset price bubble’s collapse in the 1990s, expectations are mounting that an era shift is in the making.

A series of catalysts are on the radar, which include a corporate governance overhaul, hopes that Japan will break free from its deflationary cycle to being a beneficiary of supply-chain diversification with souring US-China relationship.

Not to mention the endorsement from Warren Buffett, who has just recently increased its stake in five major Japanese trading firms (8.5% versus 7.4% in April) as a show of conviction for their longer-term outlook.

Shift in corporate governance may be a multi-year tailwind

Fundamental weaknesses in corporate governance has traditionally served as a deterrence towards Japanese stocks over the past decade, as past experiences from the “post-bubble blues” have instilled a long-lasting culture of heavy capital accumulation while deprioritising shareholders’ returns.

That could seem to head for a change, as markets are finally seeing more forceful action from the Tokyo Stock Exchange in improving capital efficiency. Listed companies with a price-to-book ratio below one are in the crosshair, having to be held accountable for their cost and efficiency of capital. Threats of potential delisting may add to the clear resolve from authorities for a change.

No doubt it may be too premature to deem that the reforms will be a success and attempts for a change has failed many times before, but it will be looked upon as a step in the right direction. More follow-up efforts among companies in terms of share buyback announcements and more shareholder-friendly stances will be on the lookout as indications of progress, which may support further re-rating from current undervalued state and lift the longer-term appeal of Japanese stocks.

Foreign investment for Japan’s equities has turned in an 11th-week net-buying streak

Foreign investors have been convinced thus far, as Japanese equities witnessed its 11th straight week of net-buying – a phenomenon which has not occurred since March 2013. Considering that investors (eg. fund managers) tend to build up their exposure over a period of time, further shift in allocations to Japanese equities may continue to provide some support for the index, with any dips potentially deemed as a buying opportunity.

A ramp-up in foreign investment (or foreign share ownership) in these companies may also translate to mounting pressure to place more focus on profitability and efficient capital allocation, which seems to feed into the drive for improving corporate governance as well.

Source: Ministry of Finance, Japan

Risks: Hopes of sustainable inflation still a black box, policy pivot on the radar

A continued pull-ahead in Japan’s “core core” inflation to its highest level in more than 30 years has also given hopes that Japan may be able to break free from its deflationary cycle. But considering that improving wage dynamics has not been broad-based, much may still be up in the air for now.

Nevertheless, a policy pivot from the Bank of Japan (BoJ) seems to be a question of when and not if. We have seen a surprise tweak to its yield curve control (YCC) policy last December, which prompted a 3% intra-day plunge in the Nikkei. Therefore, any further moves could trigger a bout of volatility in the index, with any higher bond yields reducing the traction in holding equities. At least for now, expectations are that conditions could remain accommodative over the next two meetings, which allow market participants to put the consequences of any policy pivot in the backseat for the time being.

Technical analysis – Bullish flag formation as continuation pattern on monthly chart, near-term moves guided by 20-day MA

The Nikkei 225 has been retaining its strength lately, as the Relative Strength Index (RSI) has managed to revert from overbought to more neutral territory without much of a dip this week. A bearish crossover was formed on its MACD, but previous attempts for a bearish cross (1 June 2023, 9 June 2023) has proven to be a bear trap, which provides less conviction that it should be looked upon as a solid guide.

Perhaps one to watch in the near term will be its 20-day moving average (MA), which has been supporting the index steadily over the past two months. As long as the fundamental outlook stays intact, any retracement on profit-taking activities may still be met with dip-buying, with a series of support lines (20-day MA, 50-day MA, Ichimoku cloud) aiding to drive the formation of any higher low as a continuation of its prevailing upward trend.

image1.pngSource: IG Charts

On the monthly chart, a bullish flag formation has been presented, which serves as a continuation pattern for its upward trend. The trading target as derived from the projection of a proportionate distance from the breakout level points to the potential for the index to deliver a new record high, but nevertheless, shorter-term focus will be on its December 1989 top at the 38,900 level.

image2.png

XAU/USD Price Forecast: Gold Looks to Powell

XAU/USD Price Forecast: Gold Looks to Powell

XAU/USD FUNDAMENTAL FORECAST

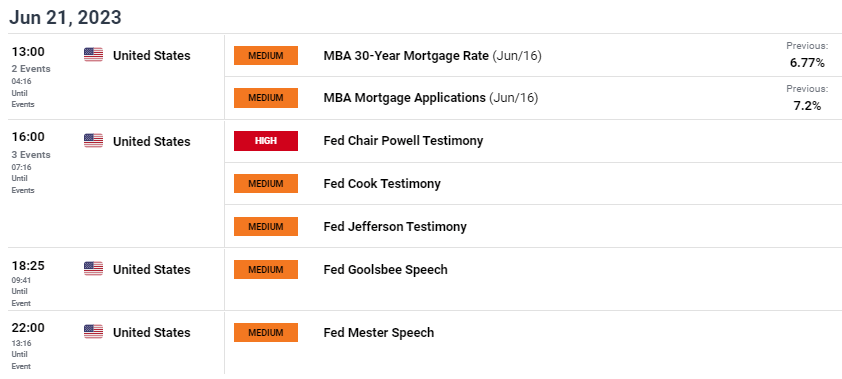
Gold prices have been relatively subdued of recent as markets continue to mull over the recent Fed interest rate pause as well as incoming economic data with particular focus on inflation and labor. The day ahead should stoke some volatility in gold markets with Fed Chair Jerome Powell scheduled to testify before the U.S. House Financial Services Committee (see economic calendar below) where he will submit the Semiannual Monetary Policy Report to Congress. It is expected that Fed Chair Powell will be questioned on the Fed’s monetary policy actions and implications thereof. Additional Fed officials will also be present to testify and may present investors with a clearer picture going forward.

GOLD ECONOMIC CALENDAR (GMT +02:00)

image1.png

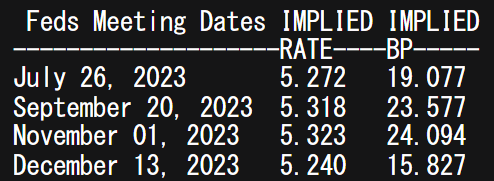
Currently, markets are pricing in just under 25bps of additional rate hikes (see table below) for the November meeting but data dependency remains extremely important, leaving the door open for a sustained pause or greater rate hikes.

FEDERAL RESERVE INTEREST RATE PROBABILITIES

image2.png

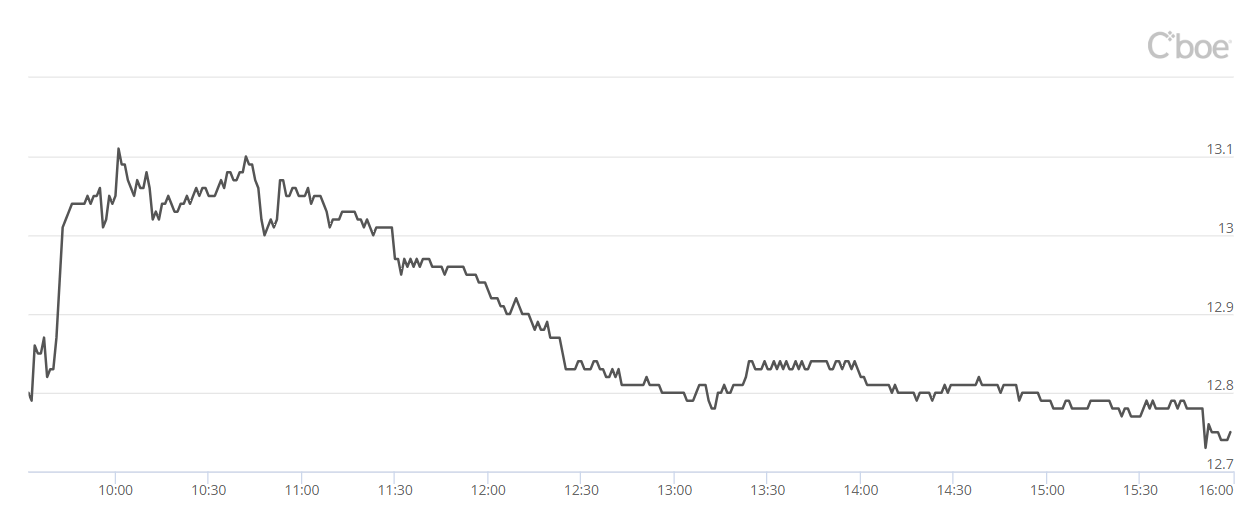
The GVZ or gold price volatility shown in the graphic below is a measure of market’s expected 30-day price movement in the SPDRGold ETF(GLD). Traditionally, most assets tend to move inversely to volatility but gold is one such exception. The graph shows a steady decline in the GVZ reading, correlating with gold’s recent downward trend. Should Fed Chair Powell’s testimony provide little in the way of new or unexpected information, bullion may well extend this downside move.

CBOE GOLD ETF VOLATILITY INDEX (GVZ)

image3.png

TECHNICAL ANALYSIS

GOLD PRICE WEEKLY CHART

image4.png

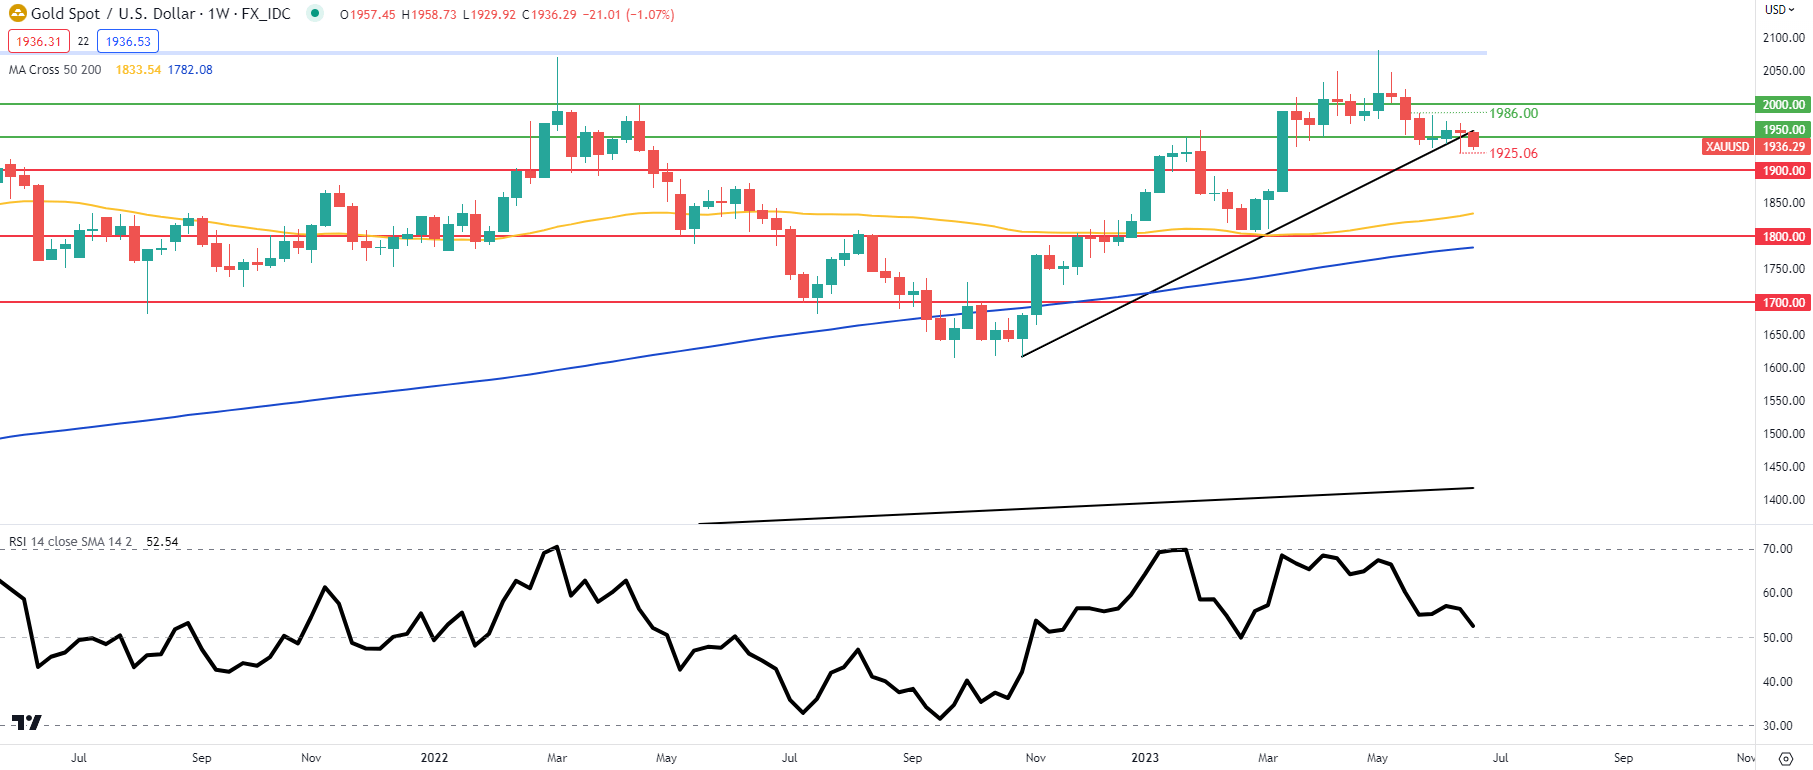
Weekly XAU/USD price action is of particular focus this week as the medium-term trendline support (black) could be breached for the first time. Last week saw bulls marginally push above this level but may not be so fortunate this time around. A confirmation weekly candle close below this area of confluence could spark a large move lower for spot gold.

GOLD PRICE DAILY CHART

image5.png

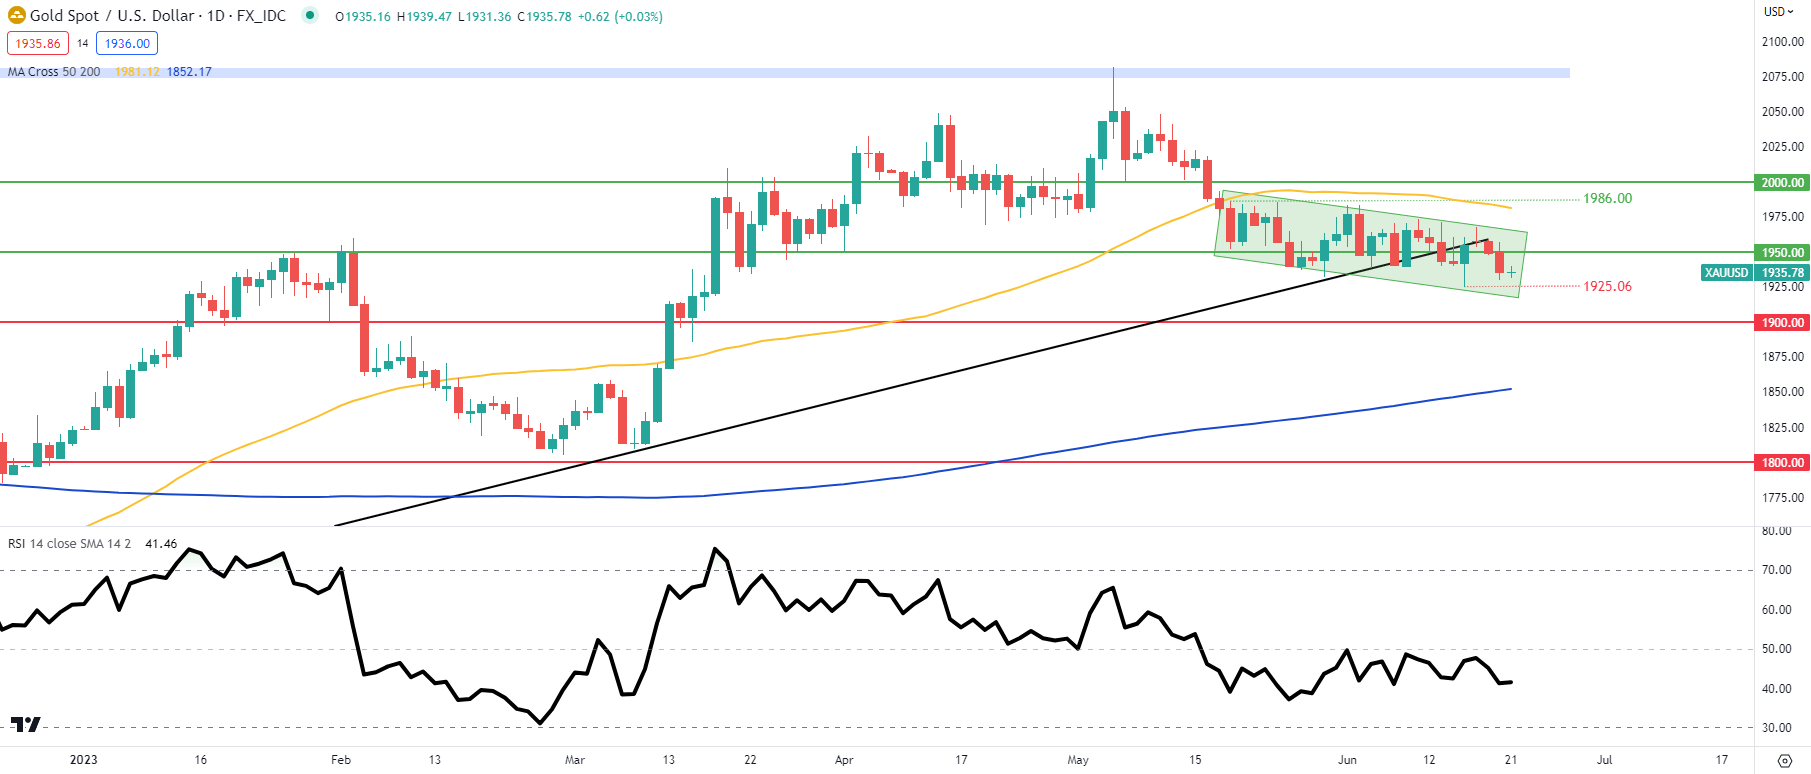
The short-term daily chart above outlines the consolidatory move over recent weeks as daily candles form a rectangle type chart pattern. Investors will be looking for a confirmation close (breakout) above or below rectangle resistance/support respectively as a guide to short-term directional bias.

Resistance levels:

  • 50-day MA (yellow)
  • Rectangle resistance
  • 1950.00

Support levels:

  • 1925.06
  • Rectangle support
  • 1900.00

IG CLIENT SENTIMENT: BEARISH

IGCS shows retail traders are currently distinctly LONG on gold, with 75% of traders currently holding long positions (as of this writing). At DailyFX we typically take a contrarian view to crowd sentiment resulting in a short-term downside disposition.

UK Core Inflation Breaches 7% as Headline Beats Estimates, GBP/USD Bid

UK Core Inflation Breaches 7% as Headline Beats Estimates, GBP/USD Bid

The core inflation rate in the UK is estimated to have risen to 7.1% in the 12 months to May 2023, up from 6.8% in April, and the highest rate since March 1992 ahead of the Bank of England meeting.

image1.png

For all market-moving economic releases and events, see the DailyFX Calendar

The YoY inflation rate held steady at 8.7% coming in above estimates of around 8.4% and remains at a 13-month low. This may sound rosy however, the print no doubt remains extremely high and at levels that will no doubt continue to concern the BoE. Rising prices for air travel, recreational and cultural goods and services, and second-hand cars were enough offset slowing food inflation and falling prices for motor fuel. The data is likely is likely to place additional pressure om BoE policymakers heading into tomorrow’s meeting.

image2.png

Source: ONS

Food price inflation meanwhile remains another area of concern with a small drop in the month of overall but the YoY rate far exceeding the headline inflation number. Fuel prices led to the largest downward contribution to monthly inflation in May, falling 13.1 YoY compared to the 8.9% in April. The inflation rate for UK goods eased a little in May don to 9.7% but another concern lies in service sector inflation which accelerated to 7.4%. This could pose a further risk to the fight against inflation as the UK heads into a busy summer period which could keep service inflation on the rise.

Trading Forex News: The Strategy

Trading Forex News: The Strategy
Recommended by Zain Vawda
Trading Forex News: The Strategy
Get My Guide

IMPLICATION FOR THE BANK OF ENGLAND (BoE) MOVING FORWARD

The Bank of England’s (BoE) faces more challenges than most in navigating its way through the current economic climate. This weeks BoE meeting will hold particular significance as markets have already heard from both the ECB and the Federal Reserve on their projections for the second half of 2023.

Inflation in the UK continues to be a hotly debated topic with rising mortgage payments being one of the key issues. Yesterday saw the mortgage issue discussed in the House of Commons with UK Chancellor Jeremy Hunt quick to stress that any further Government intervention could lead to further inflationary pressure. The Chancellor urged stretched consumers to look at the Government support measures which are already in place.

The continued repricing of the peak rate for the Bank of England has remained another area of contention with current market estimates resting around 5.75%. This would suggest a further 130bps of hikes which according to the Bank of England is extremely optimistic. The Core inflation print is likely to be a key factor for the BoE moving forward, particularly after the acceleration seen in today’s print. As I have discussed over the course of the year, the drop in inflation that many had hoped may materialize but it will be a bumpy road ahead. I still believe that a large chunk of inflation has been entrenched in markets and thus going forward we may see further signs of stickiness which would only serve to complicate matter further for the Bank of England (BoE). For a full PREVIEW and BREAKDOWN of the BoE meeting CLICK HERE.

MARKET REACTION

GBP/USD Daily Chart

image3.png

Source: TradingView, prepared by Zain Vawda

GBPUSD saw an initial 50-pip spike higher toward the 1.2800 zone before paring gains to trade at 1.2770 at the time of writing. Bulls still remain in control following the fresh yearly high printed at the back end of last week. Immediate support rests around the 1.2680 area before the 1.2600 and 1.2500 areas come into focus, the latter of which lines up with the 50-day MA.

Looking at a continuation of the upside rally and the psychological 1.3000 level remains key with a break above likely eyeing the 1.3250 area.

Key Levels to Keep an Eye on:

Support Levels:

On Juneteenth, Treasury Department Releases Fact Sheet Detailing Investments in Black Communities

On Juneteenth, Treasury Department Releases Fact Sheet Detailing Investments in Black Communities

WASHINGTON – Today, to commemorate the Juneteenth holiday, the U.S. Department of the Treasury released a fact sheet detailing actions the Department has taken and their impact on Black households, businesses, and communities. Advancing equity for historically underserved people and places is a priority for the Biden-Harris Administration and for the Treasury Department. The Treasury Department has delivered real results that aim to expand opportunities for all Americans to fully participate and compete in the 21st century economy.

When President Biden came into office just over two years ago, Black Americans were being disproportionately affected by the COVID-19 pandemic’s health and economic impacts and were poised to face a significant setback. Over the past two and a half years, the Treasury Department’s work to center equity in its pandemic recovery efforts delivered real results and contributed to the most equitable recovery in recent history – creating a blueprint for equitable implementation of other Biden-Harris Administration priorities and initiatives.

Key Treasury Department Actions:

  • Helping Black families remain homeowners: The reach of Homeowner Assistance Fund (HAF) resources to economically vulnerable and traditionally underserved homeowners exceeded prior federal mortgage assistance and foreclosure prevention programs. As of December 2022, 57 percent of HAF assistance was delivered to very low-income homeowners, and 35 percent of HAF homeowners self-identified as Black.
  • Helping Black families avoid eviction: The Emergency Rental Assistance (ERA) program was the first-ever nationwide program aimed at preventing eviction through direct assistance to renters. As of December 2022, extremely low-income renters received close to two-thirds of ERA assistance, while Black families received 42 percent of assistance.
  • Growing Black-owned businesses by expanding financing and technical assistance: The State Small Business Credit Initiative (SSBCI) includes $2.5 billion in funding and incentive allocations to support the provision of capital to underserved businesses – with $1 billion of these funds to be awarded to the jurisdictions who are most successful in reaching underserved businesses. In addition, state participants are required to collect demographic data on the business owners receiving support through the program – including race and ethnicity – with the goal of providing transparency and accountability regarding who is served by the program.
  • Investing in financial institutions with a track record of delivering capital to Black communities and businesses: Through the Emergency Capital Investment Program (ECIP), the Treasury Department has invested $1.4 billion in Black-owned and Black-majority shareholder depository institutions. ECIP investments are predicted to increase lending in Black communities by nearly $80 billion over the next decade.

Additionally, the Treasury Department’s Community Development Financial Institutions Fund (CDFI Fund) has prioritized community investment efforts to address credit needs and asset-building opportunities in low-income and financially underserved communities, including for Black borrowers and in predominately Black communities. In April, the CDFI Fund announced $1.73 billion of grant awards through the Equitable Recovery Program, which included many awards to community development financial institutions (CDFIs) that have strong track records of lending to Black borrowers and in majority minority census tracts.

  • Building the capacity of local governments to address systemic barriers to health, housing, and financial well-being for Black households: The Treasury Department prioritized equity in its spending guidelines for the American Rescue Plan’s State and Local Fiscal Recovery Fund (SLFRF). A recent study found that many local governments used SLFRF resources to invest in projects that address the systemic health and economic challenges causing disparities in Black and low-income communities disproportionately negatively impacted by the pandemic.
  • Increasing federal business with Black-owned companies:In the past two years, the dollar amount of contracts awarded by Treasury to Black-owned businesses increased by 60 percent. In FY 2022, the total amount Treasury awarded to Black-owned businesses was $188 million, which is about $75 million more than was awarded in FY 2020.

While significant progress has been made, much more remains. Among other initiatives, in the coming months, the Treasury Department will continue leading the implementation of key provisions of the Inflation Reduction Act, which will help create good-paying jobs and ensure all Americans benefit from the growth of the clean energy economy, particularly communities that have been left behind and harmed by pollution. As the Treasury Department continues to tackle both immediate and long-term structural challenges of the American economy, equity and racial justice will remain at the forefront of its work.