USD Price Forecast: DXY Holds its Breath Ahead of Big Data Week

USD Price Forecast: DXY Holds its Breath Ahead of Big Data Week

USD FUNDAMENTAL BACKDROP

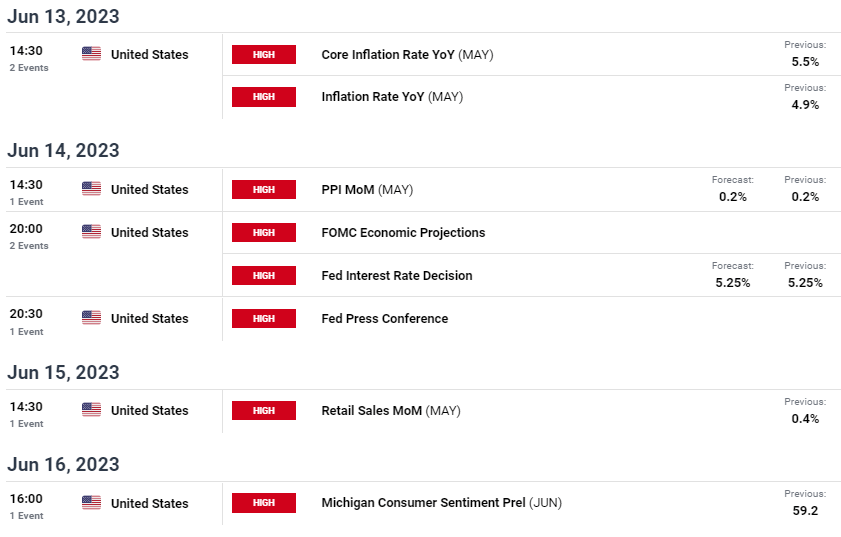
The Dollar Index (DXY) is marginally higher this Friday morning after yesterday’s slump following the US jobless claims report. With no economic data scheduled for today, focus shifts to next week’s plethora of high impact US releases (see economic calendar below). US CPI and the Federal Reserve’s interest rate decision will dominate. US CPI will be the primary factor for generating a short-term directional bias with recent data all culminating into a slowing US economy. Should inflation come in higher or elevated, this could unwind other data releases and heighten further monetary policy tightening forecasts from the Fed.

US ECONOMIC CALENDAR (GMT +02:00)

image1.png

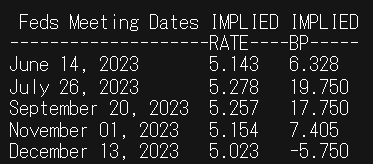
Money markets are currently pricing in a 75% probability of a rate pause for next week but may change in tandem with the US CPI print.

FEDERAL RESERVE INTEREST RATE PROBABILITIES

image2.png


Asia Day Ahead: Wall Street Up Overnight; Sentiment in Extreme-Greed Territory

Asia Day Ahead: Wall Street Up Overnight; Sentiment in Extreme-Greed Territory

The softer US economic calendar overnight prompted market participants to source for clues on the Fed’s policy path from the US weekly jobless claims, which reflected a pull-ahead in initial claims reading to its highest since October 2021 (261,000 versus 235,000 forecast). With its tendency to provide an early lead for the US unemployment rate, its sharp rise uplifted hopes that the US labour market may continue to see some softening ahead, although we will have to look towards subsequent weeks’ data to provide conviction for a clear trend.

With rate expectations being highly sensitive to economic data on the Fed’s data-dependent stance, the claims figure translated to a dovish adjustment in rate expectations towards the end of the year. Two-year and 10-year Treasury yields were lower by 4.1 basis-points and 7.5 basis-points respectively, overall dragging the US dollar to its two-week low while supporting a 1% jump in gold prices.

The quiet front on the economic schedule today may lead to a drift in Wall Street in the lead-up to the US Consumer Price Index (CPI) and the FOMC meeting outcome next week, which will be key catalysts to dictate whether the S&P 500 can deliver a break above its 4,320 level of resistance. For now, the CNN Fear and Greed Index has reflected market sentiments in “extreme greed” territory for the first time in four months. Previous two instances where the index touches this territory in December 2022 and February 2023, the S&P 500 forms a near-term top shortly thereafter. While it may not necessarily play out this time round, it suggests that risks may be considerably higher and a buy-on-retracement approach may be the preferred option.
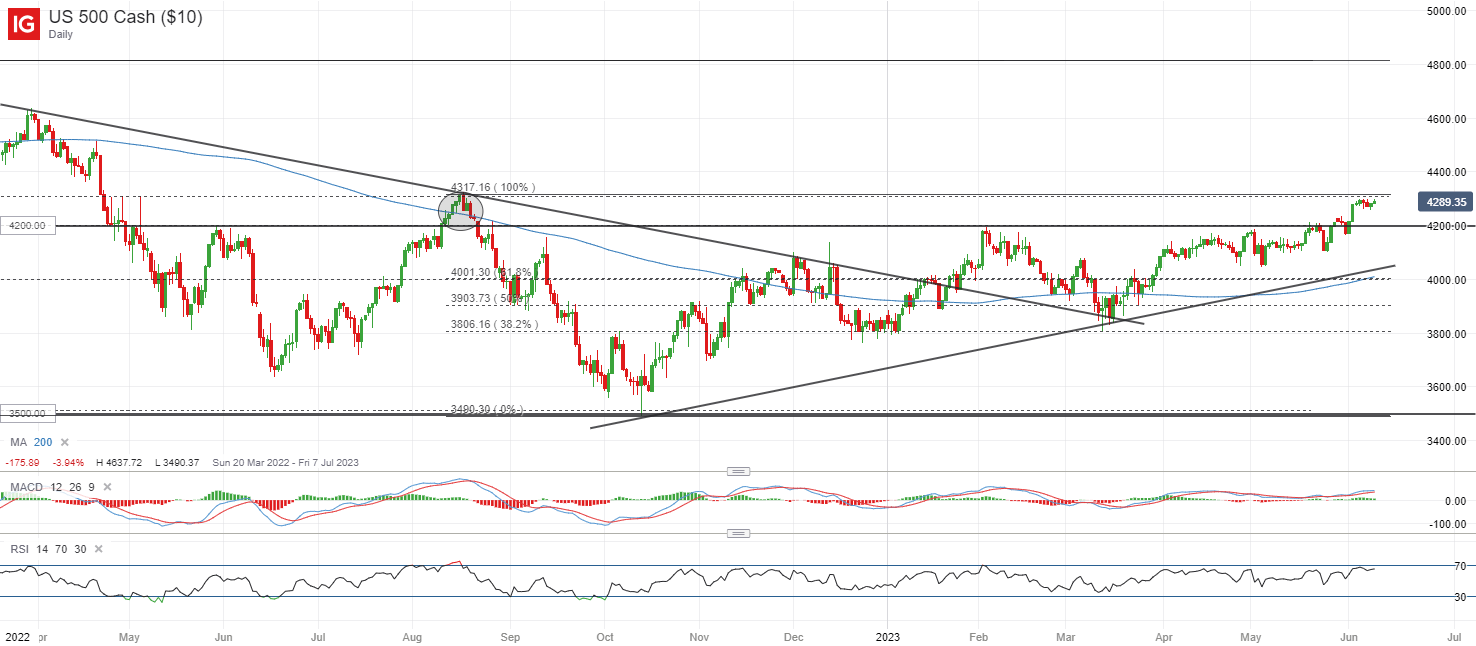
image1.png

Asian stocks look set for a positive open, with Nikkei +1.62%, ASX +0.26% and KOSPI +0.43% at the time of writing, tracking the renewed gains in Wall Street overnight. The economic calendar today will place market focus on China’s inflation figures, which are expected to reinforce a low-for-longer growth outlook but could be seen as an added justification for more support stimulus from Chinese authorities.

Current consensus is for a subdued 0.3% rise in its headline consumer prices (previous 0.1%) as a reflection of still-soft demand, while producer prices is expected to decline for the eighth consecutive month (consensus -4.3% versus previous -3.6%).

Any higher-than-expected read may provide a much-needed positive surprise by pointing to stronger consumer demand but with the China’s Citi economic surprise index trending in negative territory for the first time since its reopening efforts in January this year, a clear trend of economic resilience will be what investors may want to see to support greater conviction for Chinese equities.

Closer to home, the Straits Times Index has been attempting to defend a key upward trendline support at the 3,180 level but intermittent bounces thus far have been short-lived as a reflection of strong selling pressures. A bearish flag formation since April this year remains in place and should the trendline support fail to hold ahead, a retest of its year-to-date bottom may be in sight. On any upside, the index will have to face a test of resistance confluence around the 3,220 level, where a previous support-turned-resistance stands alongside its 200-day moving average (MA).
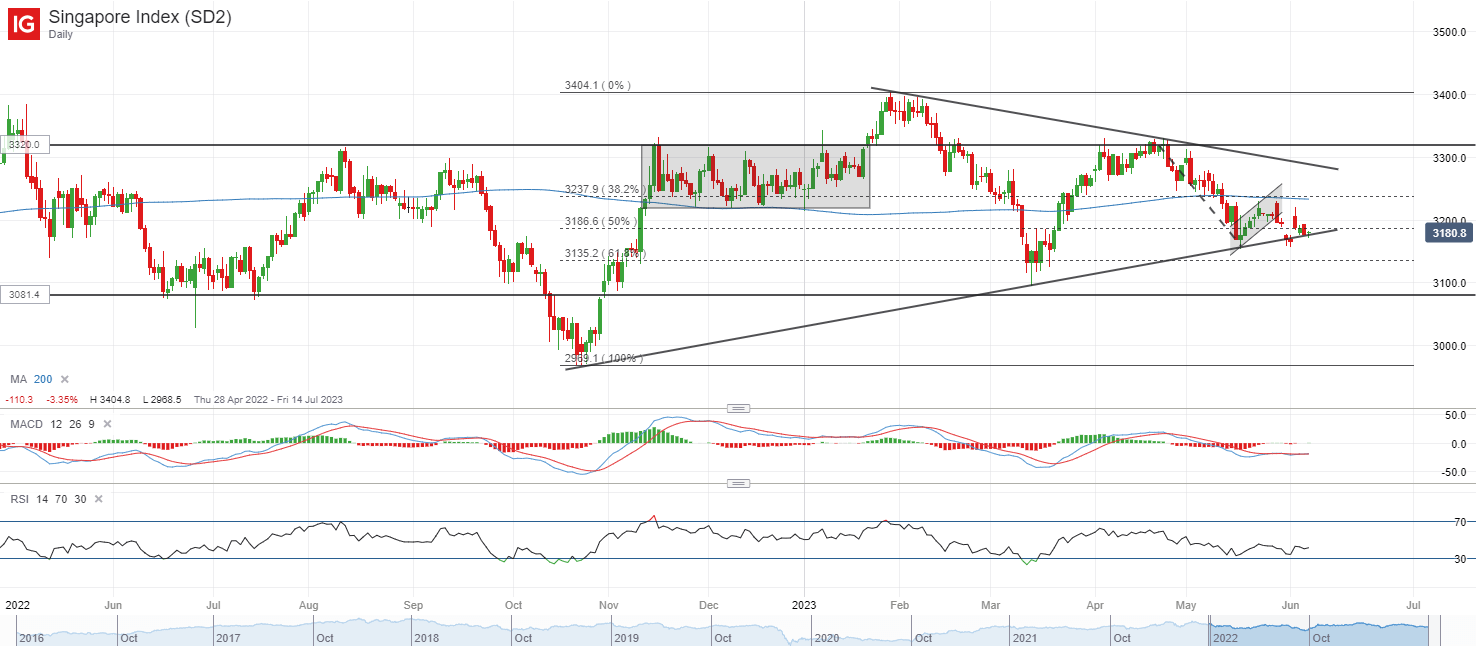
image2.png

The USD/CHF has given back all of its past two weeks’ gains with a 1.2% dive overnight, following another failed attempt in overcoming the upper edge of its Ichimoku cloud on the daily chart. A more-than-expected rise in US initial jobless claim figure puts an overnight drag on the US dollar (-0.7%) while on the other hand, a highlight on inflation persistence by Swiss National Bank (SNB) Chairman Thomas Jordan suggests that its central bank’s policy may diverge with additional hikes being priced over the two meetings.

The confluence of both events saw a downward break of a near-term rising channel pattern for the USD/CHF, with a bearish crossover displayed on moving average convergence divergence (MACD). Near-term, the 0.910 level will be a key resistance level to overcome, where a move above the Ichimoku cloud resistance may support a move to retest the 0.922 level next. For now, selling pressures remain dominant, with further downside potentially leaving its May 2023 bottom on watch.
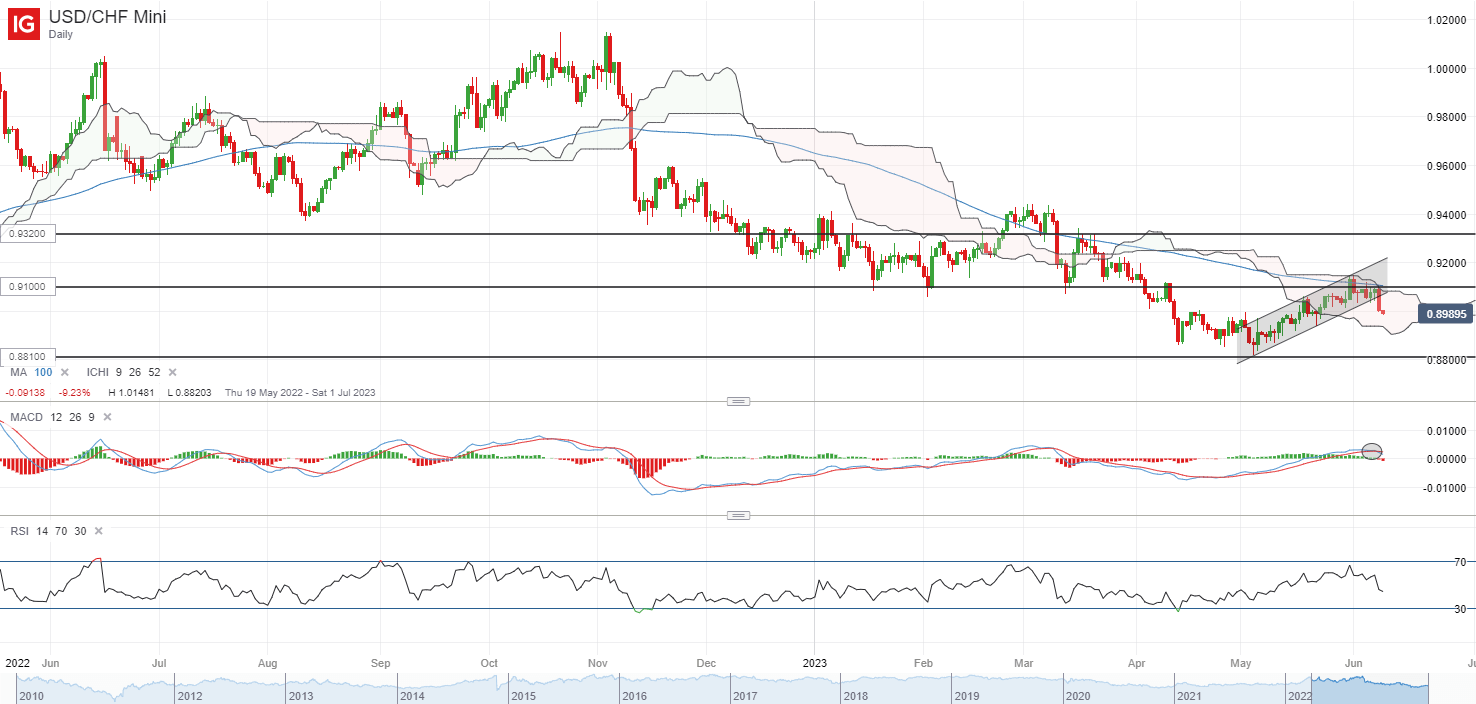

image3.png

New Zealand Dollar Boosted by Low Volatility; What’s Next for NZD/USD, AUD/NZD, EUR/NZD?

New Zealand Dollar Boosted by Low Volatility; What’s Next for NZD/USD, AUD/NZD, EUR/NZD?

The suspension of the US debt ceiling, the resilience of the global economy, and hopes that US interest rates are peaking have boosted risk-sensitive currencies, including the New Zealand dollar.

Volatility across asset classes has fallen over the past two weeks, with equity market volatility, as measured by the CBOE VIX index, down to the lowest level since the Covid selloff in 2020. Currency volatility, as measured by CVIX, is at the lowest level in more than a year (see chart).

Volatility indicators

A picture containing text, font, handwriting, line  Description automatically generated

Source Data: Bloomberg; Chart created in Microsoft Excel.

The improvement in risk sentiment has pushed up NZD/USD by over 1% since the start of the month. The NZD fell sharply late last month after the Reserve Bank of New Zealand (RBNZ) hiked interest rates by 25 basis points, but acknowledged that rates are at a peak. For more details see “New Zealand Dollar Slides as RBNZ Hikes By 25 Basis Points, But Sees Peak in Rates”, published May 24.

NZD/USD: Holds above key support

On technical charts, NZD/USD has managed to so far hold above vital converged support on the lower edge of a declining channel from February and a 50% retracement of the October 2022-February 2023 rise. For more discussion, see “New Zealand Dollar’s Slide Approaches Limits: NZD/USD, EUR/NZD, GBP/NZD Price Setups”, published June 1.

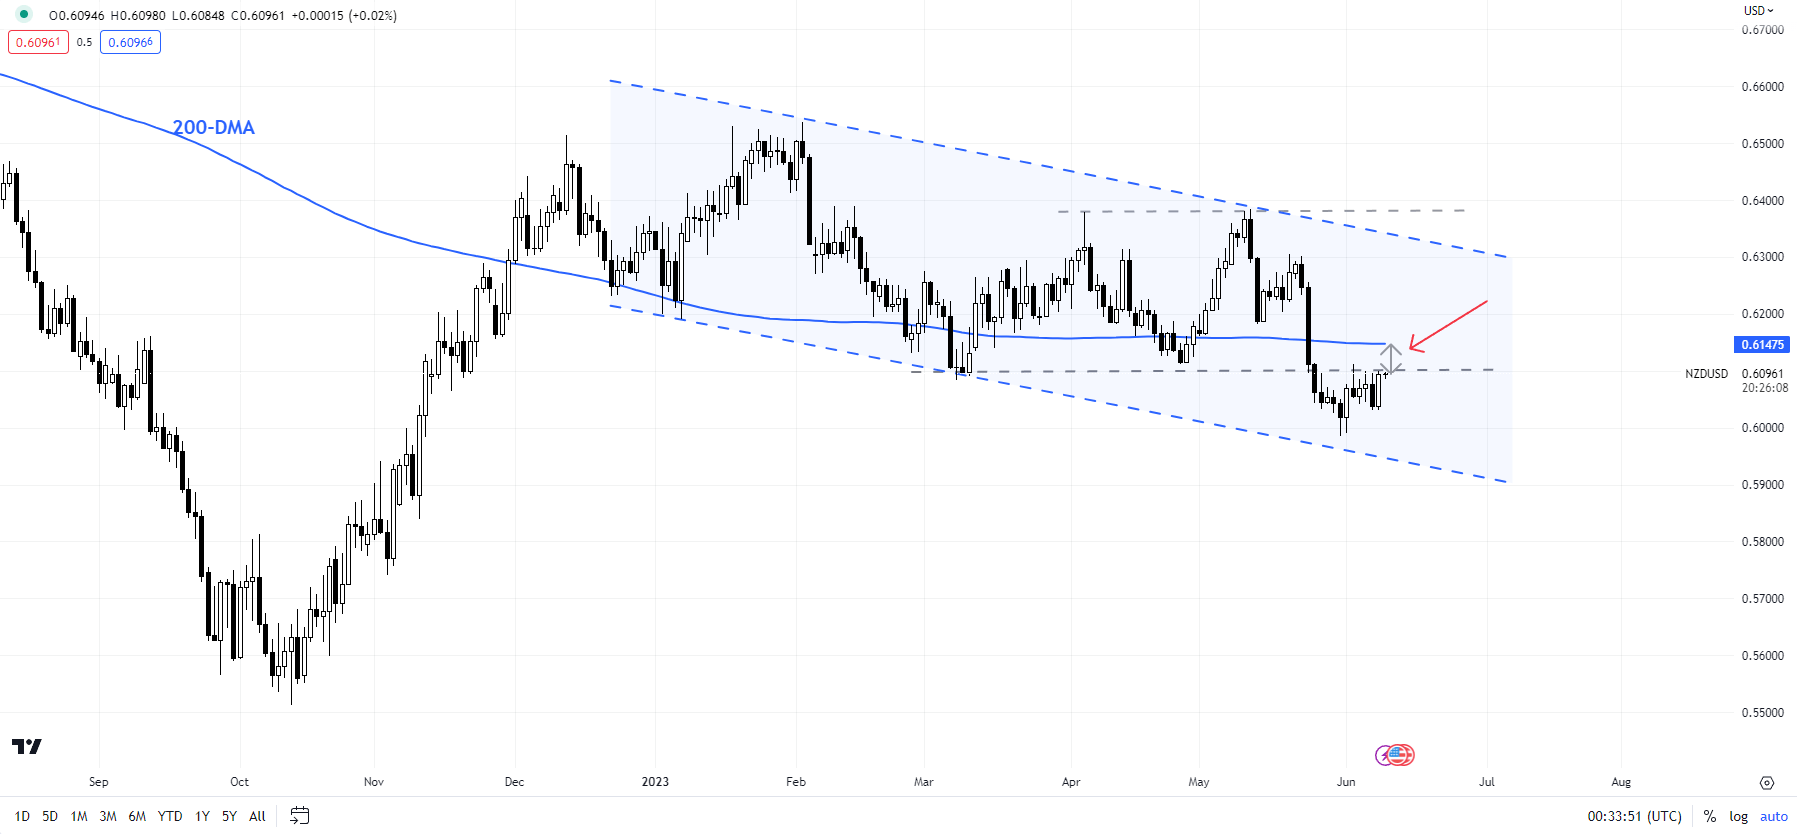
NZD/USD Daily Chart

image2.png

While the hold above support is encouraging for bulls, it doesn’t mean that the worst is over – at minimum, NZD/USD would need to break above the 200-day moving average (now at about 0.6150) for the immediate downward pressure to ease. A stronger signal would be a cross above the May high of 0.6385 for the bearishness to reverse.

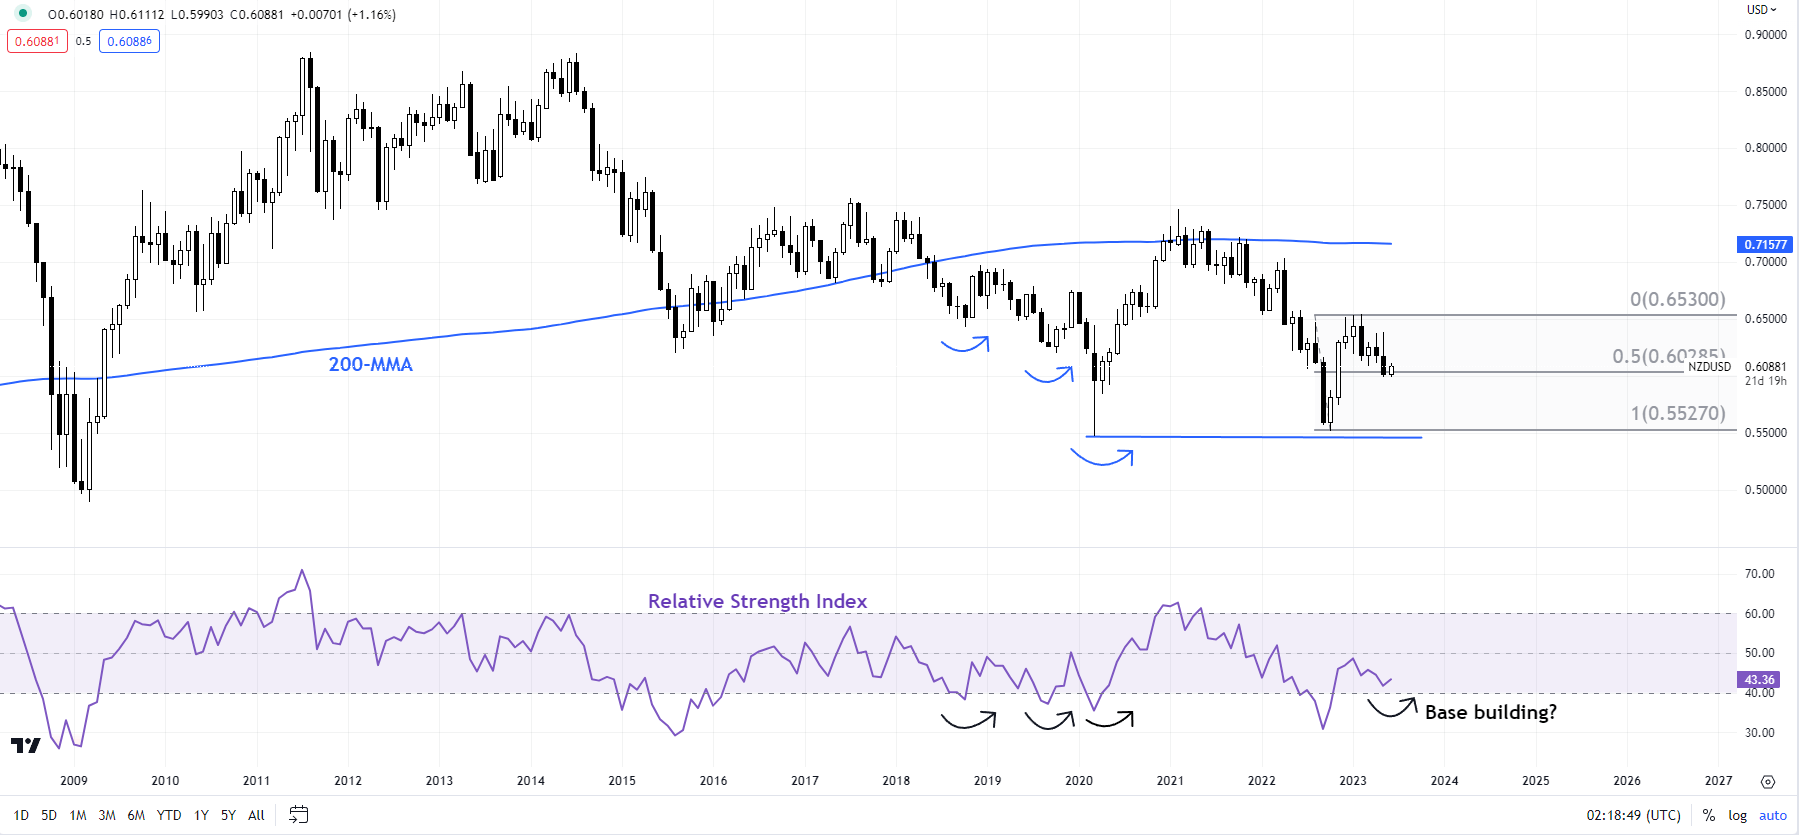
NZD/USD Monthly Chart

image3.png

Interestingly, on the monthly chart, the 14-month Relative Strength Index appears to be turning up from near the crucial 40-mark, which has been associated with rebounds in the pair in the past. On the downside, any break below the lower edge of the bearish channel would accentuate downside risks.

AUD/NZD Monthly Chart

image4.png

AUD/NZD: Time for a breather?

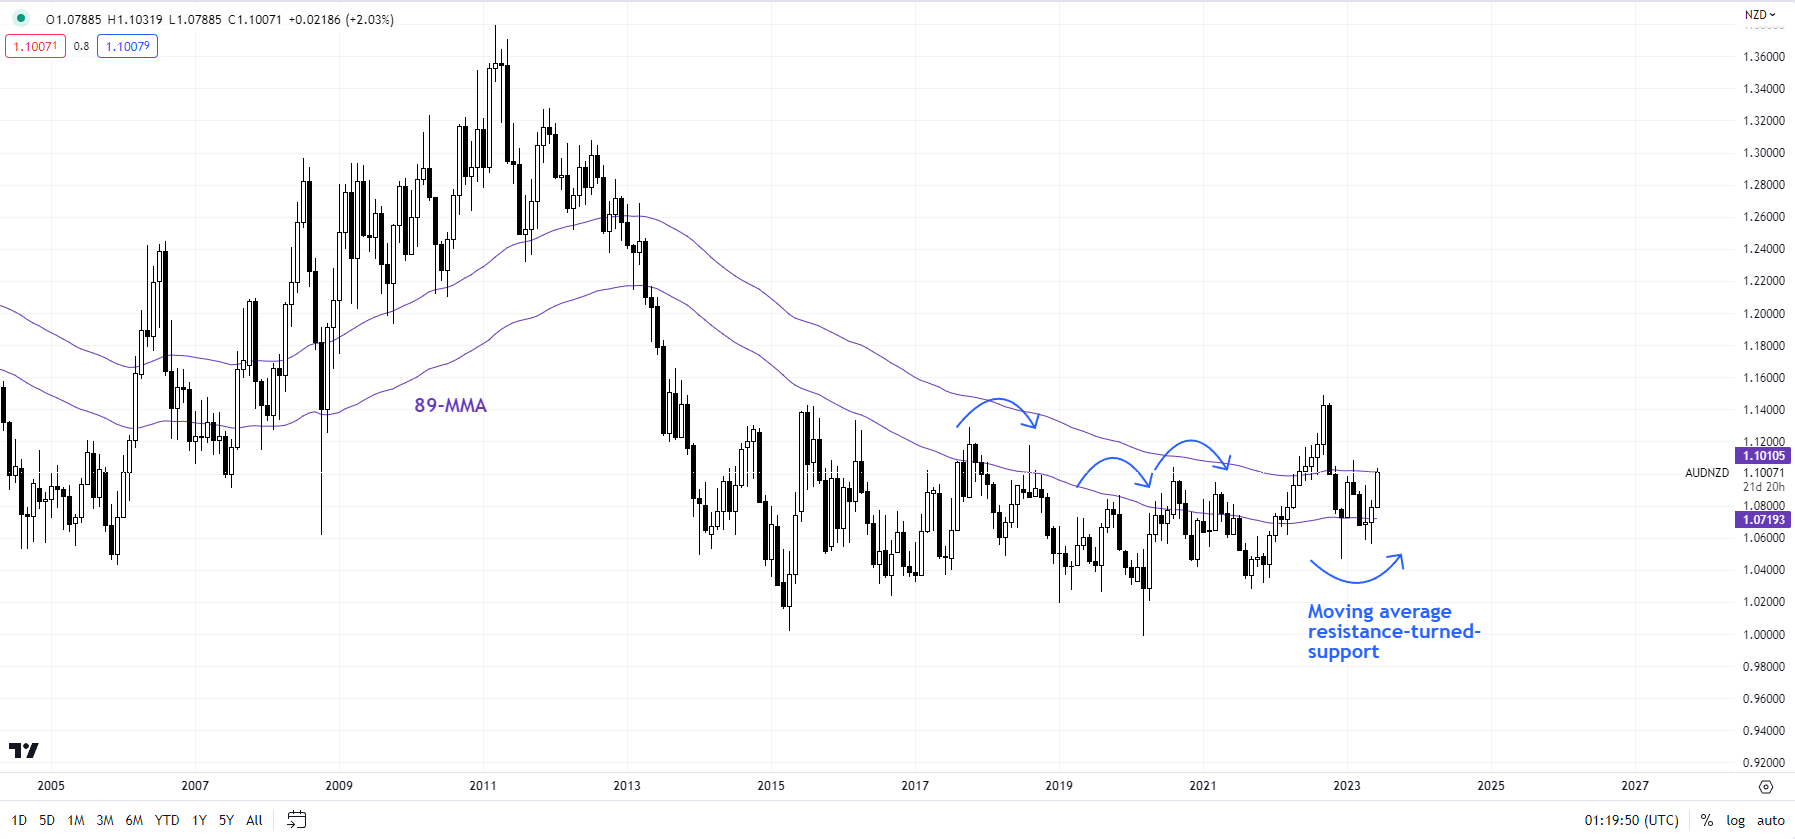
After a spectacular rebound, AUD/NZD could be due for a short breather as it nears a tough ceiling at the February high of 1.1085. But two important developments on the higher timeframe charts indicate the rally this month could have some legs. Firstly, the rise in 2022 above the 2020 high of 1.1040 is a sign that the multi-month downward pressure is fading. Secondly, on monthly charts, the cross has managed to find support on the resistance-turned-support on the 89-month moving average. Any break above 1.1085 is needed for the medium-term outlook to turn constructive.

EUR/NZD Daily Chart

image5.png

EUR/NZD: Rally over for now?

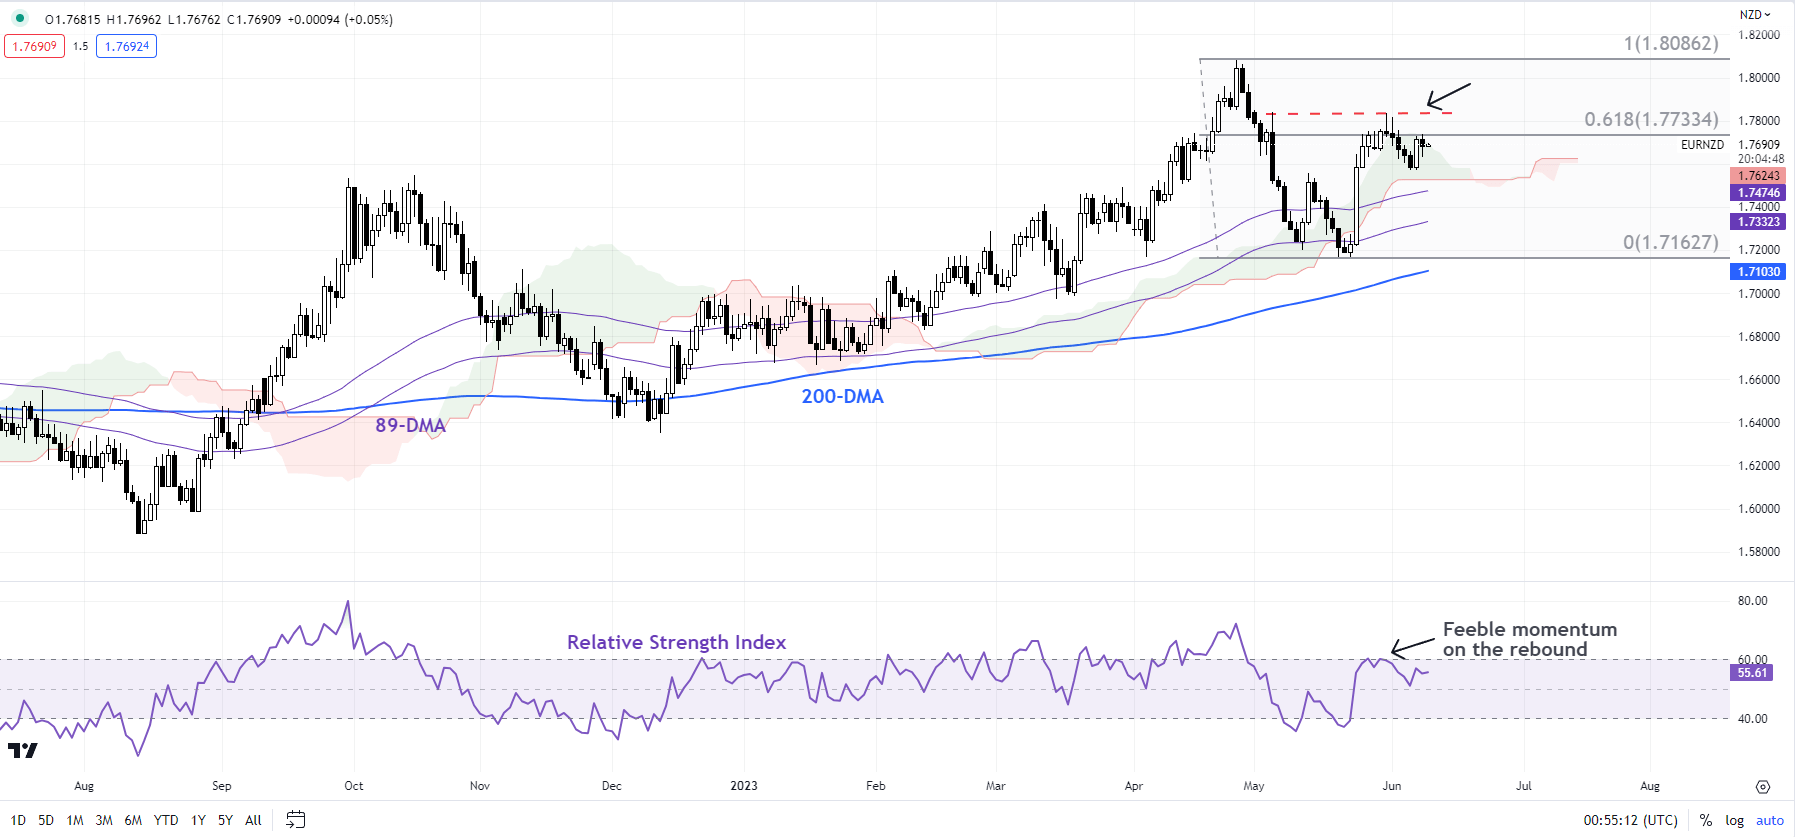
EUR/NZD’s rebound this month has lacked strength, just as the cross approaches a stiff hurdle at the early-May high of 1.7835. Chances are that EUR/NZD could settle in a 1.7150-1.7850 range in the near term. This follows a retreat in April from the top of a rising channel since 2015. Any break above immediate support at Tuesday’s low of 1.7570 would raise the odds of the range view.

EUR/GBP Price Analysis: Volatility contraction deepens as ECB-BoE policy divergence to remain steady

EUR/GBP Price Analysis: Volatility contraction deepens as ECB-BoE policy divergence to remain steady

The EUR/GBP pair has remained inside the woods around 0.8600 as investors have sidelined ahead of the interest rate decisions by the Bank of England (BoE) and the European Central Bank (ECB). Considering the fact that inflation in Eurozone and the United Kingdom is still stubborn despite the long practice of raising interest rates, the BoE and the ECB are expected to raise rates further.

The street is anticipating that both central banks will raise their current rates by 25 basis points (bps). This will push ECB’s policy rate to 4% while BoE’s financing rate would jump to 4.75%. An occurrence of the same will keep the ECB-BoE policy divergence steady in absolute terms.

EUR/GBP has delivered a breakout of the Falling Channel chart pattern formed on an hourly scale in which each pullback is considered as a selling opportunity by the market participants. A breakout of the aforementioned chart pattern warrants a bullish reversal.

The cross has climbed comfortably above the 50-period Exponential Moving Average (EMA) at 0.8600, which indicates that the short-term trend has turned positive.

Meanwhile, the Relative Strength Index (RSI) (14) has shifted its broader trading range from the bearish range of 20.00-60.00 to the bullish range of 40.00-80.00. The momentum indicator is consistently taking support near 40.00.

Going forward, an upside move above the intraday high at 0.8614 will drive the asset toward June 05 high of 0.8636 and May 25 low at 0.8666.

In an alternate scenario, a downside move below June 01 low at 0.8568 would drag the cross toward a six-month low near 01 December 2022 low at 0.8547 followed by 12 August 2022 high at 0.8493.

EUR/GBP hourly chart

Gold Prices at Risk of Freefall Below the 100-Day MA

Gold Prices at Risk of Freefall Below the 100-Day MA

GOLD (XAU/USD) PRICE FORECAST:

Gold prices fell around $30 from its high during yesterday’s US session as a surprise hike by the Bank of Canada (BoC) had a ripple effect across the markets. The Bank of Canada followed in the footsteps of the RBA with a surprise 25bps hike with swaps now completely pricing in the probability of a 25bps rate hike from the US Federal Reserve (Fed) in July. However, the probability for a rate hike at next weeks Fed meeting rose as well but remains below the 40% mark.

image1.png

Source: CME FedWatch Tool

The impact of yesterday’s decision also impacted US Treasury Yields which saw a sharp upward move as the possibility of higher rates for longer grows. The greater the likelihood of further increases from the Fed the more support we are likely to see for US yields which in turn could continue to cap any attempt by Gold prices to push higher.

CLIENT SENTIMENT DATA AND DAY AHEAD

Taking a look at the IG client sentiment data and we can see that retail traders are currently net LONG on GOLD with 73% of traders holding long positions (as of this writing). Not surprising at all given that Gold has been unable to follow through on recent moves with market participant likely expecting support at $1940 hold firm. At DailyFX we typically take a contrarian view to crowd sentiment meaning we could see Gold prices continue to decline.

Looking ahead to the rest of the day and the calendar remains relatively quiet with jobless claims data out of the US the only highlight. For now, it appears Gold prices may continue looking for guidance from US Treasury yields and the DXY ahead of next weeks CPI release and Federal Reserve meeting.

image2.png

GOLD TECHNICAL OUTLOOK AND FINAL THOUGHTS

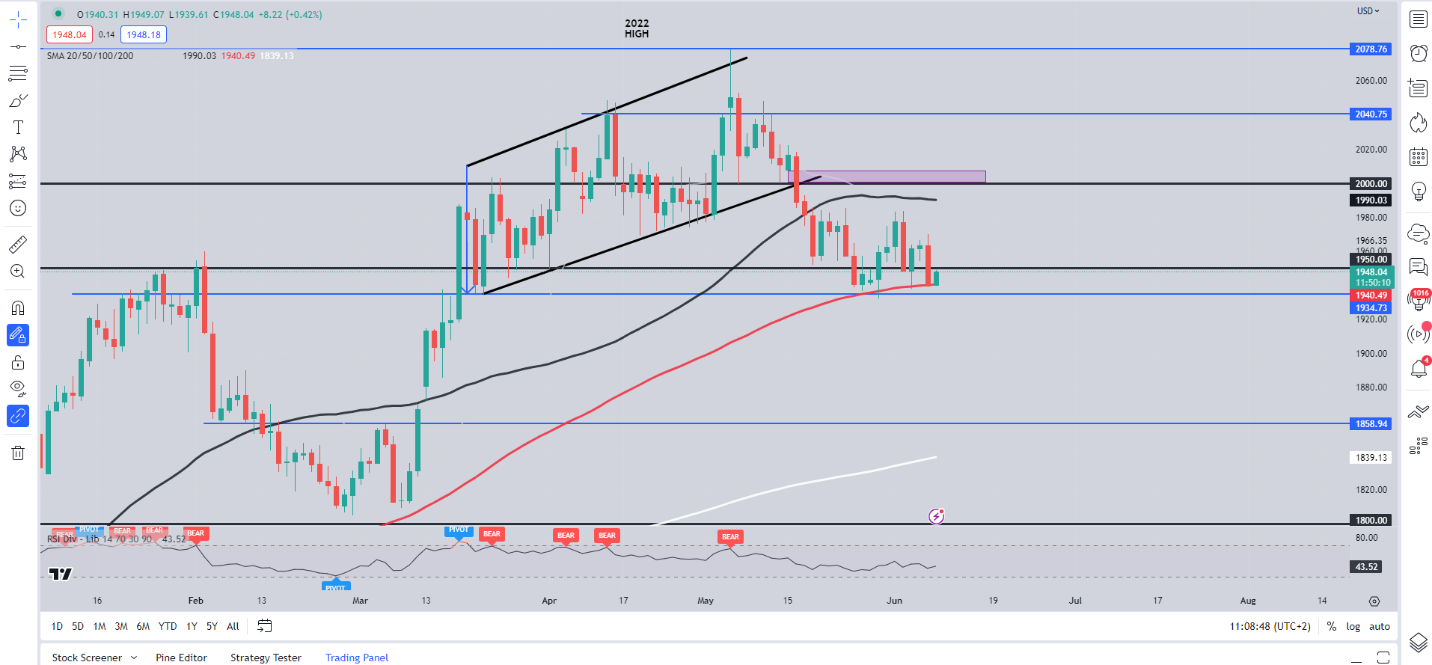
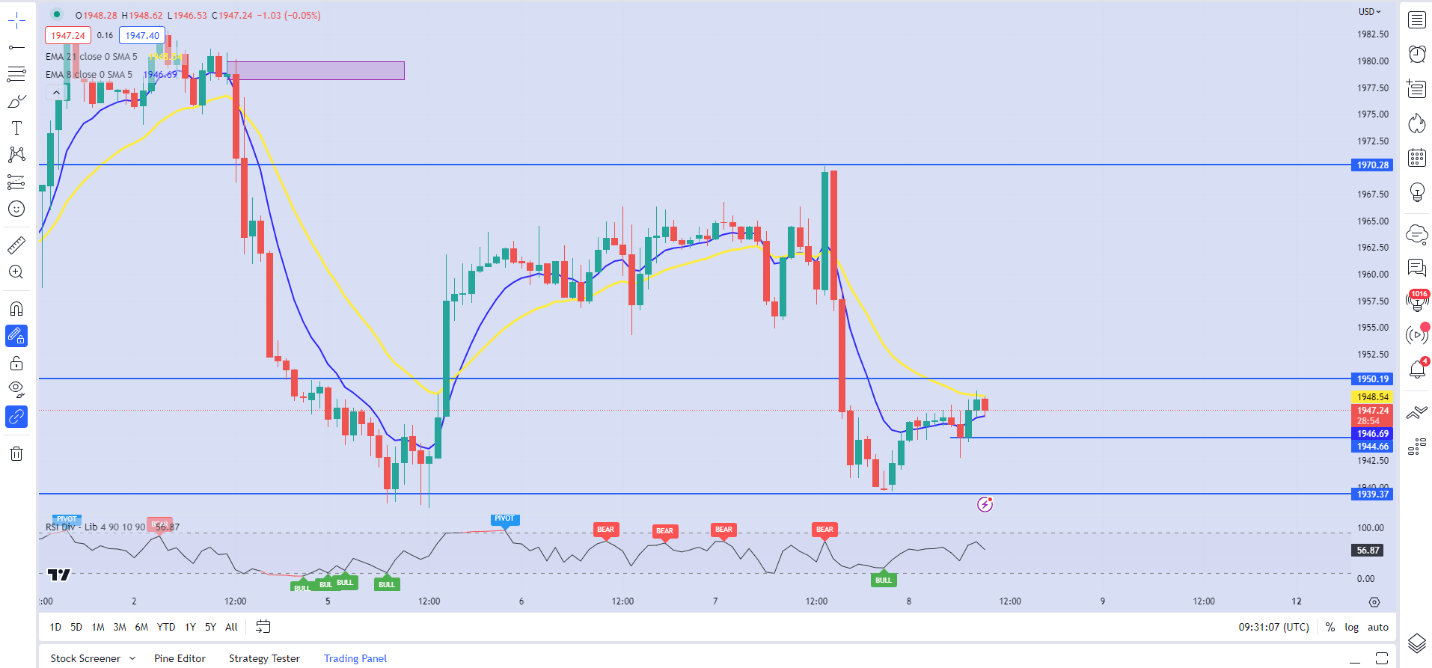
Form a technical perspective, Gold price action has been messy of late. Prior to yesterday’s drop, price action hinted at a new high looking toward the $1990 handle and the 50-day MA. The pair has once again found support at the 100-day MA overnight and continuing to push higher into the European session, trading just shy of the $1950 handle.

Gold (XAU/USD) Daily Chart – June 8, 2023

image3.png

Dropping down to a smaller timeframe and looking at the H1 chart we are printing higher highs and higher lows since bottoming out around the $1940 handle. A push higher and deeper retracement could be in store if the recent H1 higher low around $1944.73 holds firm. A 1-hour candle close below obviously invalidating the bullish structure and could see a retest of yesterday’s lows and a potential push toward the $1925 support handle.

Gold (XAU/USD) Daily Chart – June 8, 2023

image4.png

The 100-day MA on the daily timeframe resting around $1940 will be from a bigger picture perspective, with a daily candle close below opening up the possibility of a freefall in gold prices. We do not have a lot in the way of support between the 100-day MA and the $1900 psychological level. It is important to note that given next week’s US CPI release and Federal Reserve meeting there is a real chance we could continue to see rangebound price action between the 100-day MA ($1940) and 50-day MA ($1990).

USD Index Price Analysis: Decent support emerges near 103.40

USD Index Price Analysis: Decent support emerges near 103.40

DXY regains downside traction and breaches the 104.00 support to print daily lows near 103.80 on Thursday.

In case the index breaks below the weekly consolidation, a potential test of the June low of 103.38 (June 2) could emerge on the horizon prior to the transitory 100-day SMA at 102.98.

Looking at the broader picture, while below the 200-day SMA at 105.48 the outlook for the index is expected to remain negative.

DXY daily chart

USD/JPY: There is more downside room than upside risk – SocGen

USD/JPY: There is more downside room than upside risk – SocGen

Kit Juckes, Chief Global FX Strategist at Société Générale, analyzes JPY outlook as the Yen is beginning to look at the BoJ meeting.

BoJ in focus

The Q1 real GDP gain of 2.7% saar, compares with a 25-year average growth rate of 0.7% and the 2% (YoY) deflator compares to a 25-year average of -0.4%. That last number helps explain BoJ caution, of course – they’ve been trapped in disinflation for an awfully long time. Still, there’s got to be a chance that they are contemplating a further tweak to the yield curve control policy next week.

10yr yield differential and USD/JPY re-set itself with the first YCC change at the end of last year. By the end of January USD/JPY was 10 figures lower than the yield differential implied, but that gap has halved in recent weeks. That increases the downside potential for USD/JPY (or EUR/JPY) if we do get a BoJ move.

Gold Price Forecast: XAU/USD rebounds to near $1,950 as investors divide about Fed’s policy

Gold Price Forecast: XAU/USD rebounds to near $1,950 as investors divide about Fed’s policy

Gold price (XAU/USD) attempted a recovery after dropping to near $1,940.00. The precious metal has extended its rebound move to near $1,950.00 as the US Dollar Index (DXY) has dropped sharply. Broader choppiness in the USD Index has kept investors on their toes. An absence of potential triggers this week has bounded the USD Index in a limited territory.

S&P500 futures have recovered their entire losses and have turned positive, showing signs of recovery in the risk appetite of the market participants. It seems that investors have started shrugging off fears associated with expectations of more interest rate hikes by the Federal Reserve (Fed).

The USD Index has found an intermediate support around 103.80, however, the situation for the USD index seems vulnerable as the market sentiment has turned cheerful. In spite of the short-term correction, strength in the USD Index would stay as the Fed is expected to remain hawkish further.

Meanwhile, a survey from Reuters showed that “It would take rate cuts from the Federal Reserve to weaken the currency substantially.” Also, Fed would pause in June for the first time in more than a year and keep its key interest rate at 5.00%-5.25% then and for the rest of the year.

Gold technical analysis

Gold price is hovering near the upward-sloping trendline of the Ascending Triangle chart pattern on a two-hour scale plotted from May 30 low at $1,932.12. The horizontal resistance of the aforementioned pattern is placed from May 19 high at $1,983.29. The precious metal is trading below the 50-period Exponential Moving Average (EMA) at $1,955.38, which indicates that the short-term trend is bearish.

Meanwhile, the Relative Strength Index (RSI) (14) is struggling in holding itself above 40.00.

Gold two-hour chart

XAU/USD

EUR/USD extends gains toward 1.0750 despite disappointing EU data

EUR/USD extends gains toward 1.0750 despite disappointing EU data

EUR/USD is stretching higher toward 1.0750, as bulls ignore dismal revisions to the Eurozone GDP and jobs data. The pair is benefiting from the ongoing decline in the US Dollar, despite positive US Treasury bond yields and tepid risk sentiment. Focus shifts to the US data.

The Relative Strength Index (RSI) indicator on the four-hour chart rose above 50 and EUR/USD closed the last four-hour candle above the 20-period and the 50-period Simple Moving Averages (SMA), reflecting the bullish tilt.

Nevertheless, EUR/USD is likely to face stiff resistance at 1.0745/50, where the 10-period SMA and the Fibonacci 23.6% retracement of the latest downtrend align. Above that level, 1.0770 (static level) could be seen as interim resistance ahead of 1.0800 (Fibonacci 38.2% retracement, psychological level).

On the downside, 1.0700 (20-period SMA, 50-period SMA) forms first support before 1.0670 (upper-limit of the descending regression channel) and 1.0650 (end-point of the latest downtrend).

Dow and CAC40 Move up, but Nasdaq 100 Struggles

Dow and CAC40 Move up, but Nasdaq 100 Struggles

Dow Jones, Nasdaq 100, CAC40 Analysis and Charts

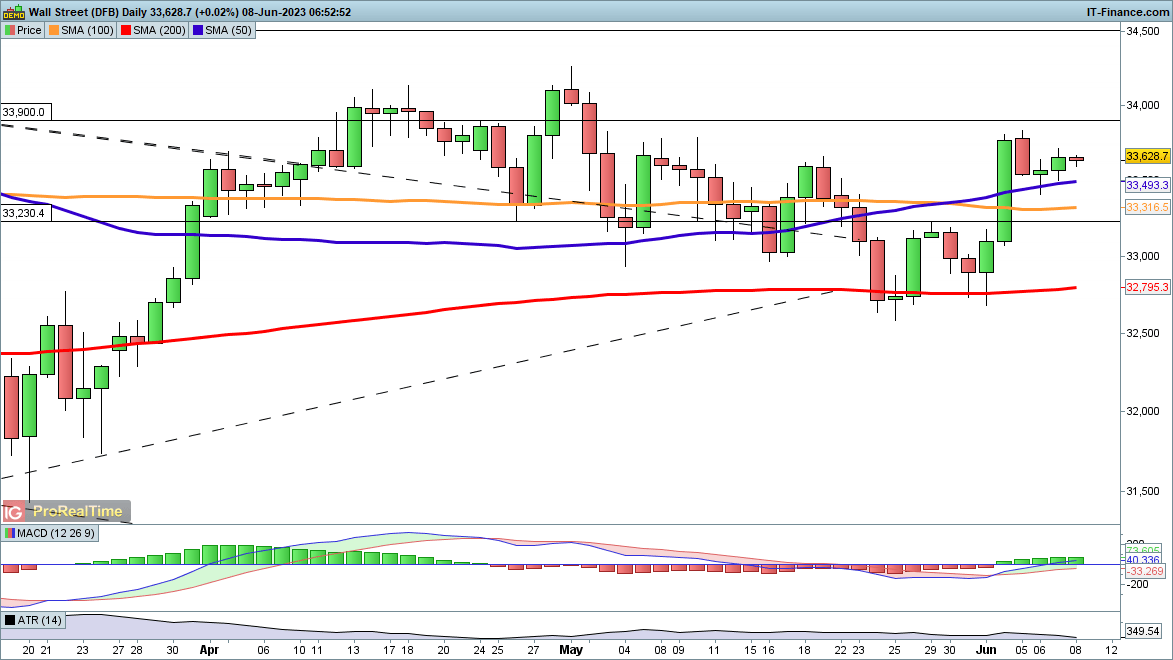
​​​Dow makes headway in early trading

​The price has managed to rise over the past two days, moving back above the 50-day SMA, bolstered in part by a recovery in oil stocks.

​Gains faltered in early May around the 37,740 mark, so a move above here and then above 33,900 continues to build a bullish move, supported by the rising 50-day SMA and a bullish MACD.

​​A reversal back below 33,310 would negate this view and risk a return to the 200-day SMA and the lows of late May around 32,700.

Dow Jones Daily Price Chart – June 7, 2023

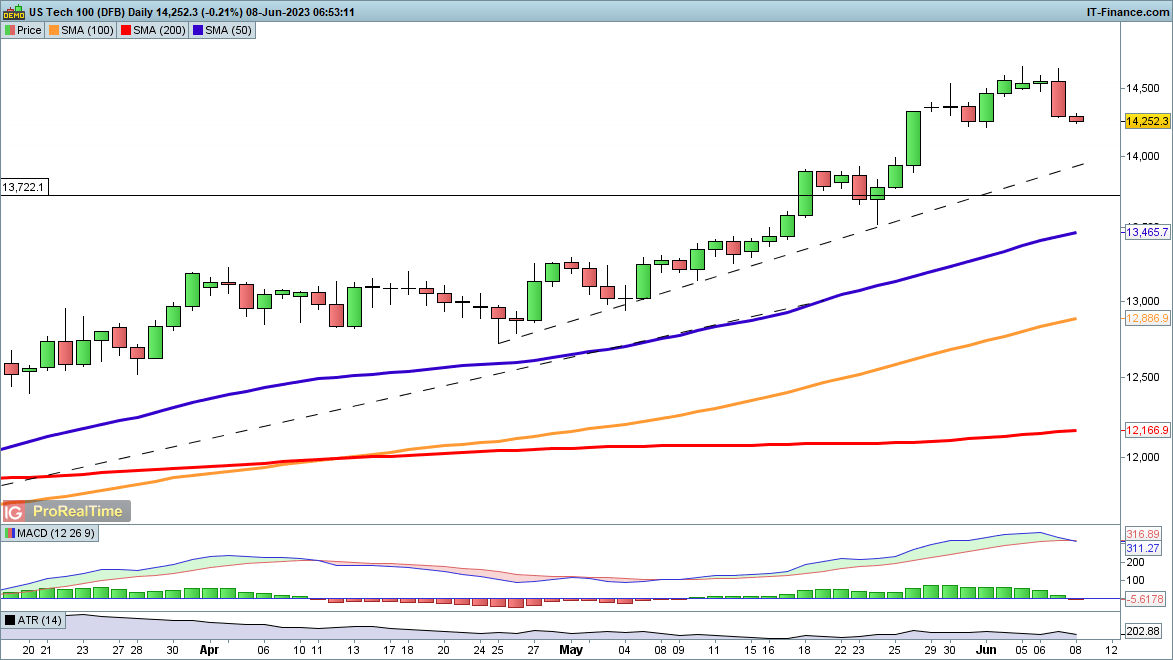
​Nasdaq 100 drops back from a one-year high

​The move higher over the preceding four sessions was broadly negated by Wednesday’s losses.

​​This might point towards a reversal towards the 50-day SMA, though short-term trendline support from late April might also come into play around 14,000.

​​A reversal above 14,500 points the way to some fresh short-term upside.

Nasdaq 100 Daily Price Chart – June 7, 2023

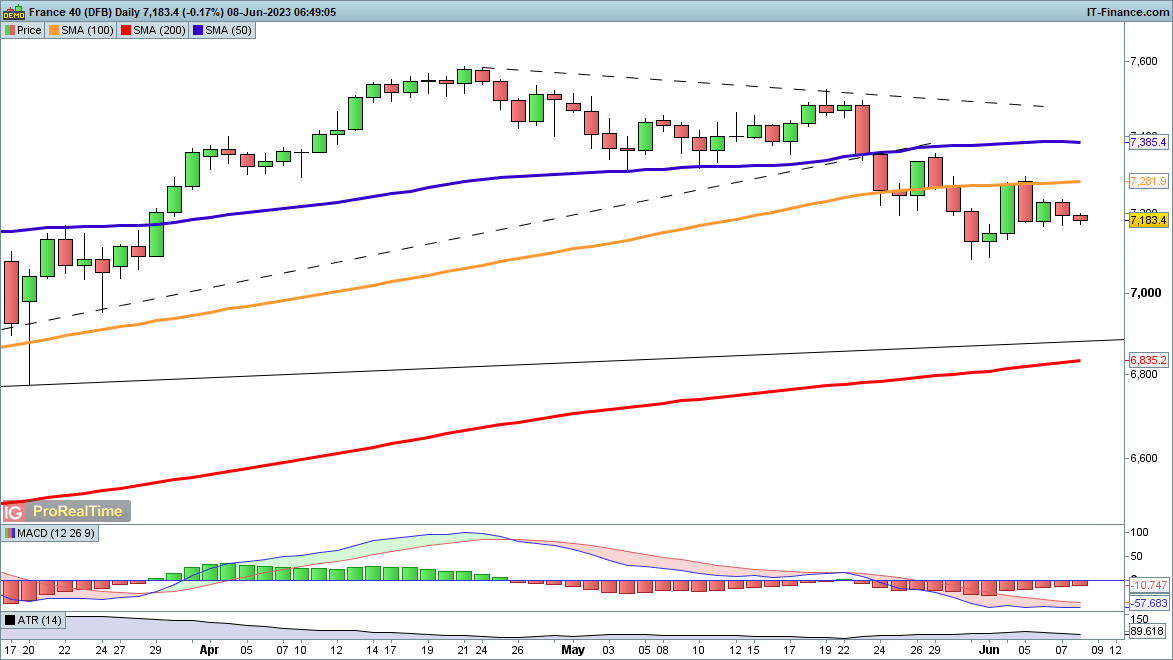
​CAC40 edges back above 7200

​The index struggled on Wednesday as poor Chinese and German data, plus a rate hike by the Canadian central bank, prompted a risk-off mood to prevail in European markets.

​However, it avoided a move below Tuesday’s lows, and this could provide the foundation for a move higher, with a move above 7300 likely to bolster the bullish outlook. The broader uptrend is still intact, so a higher low for the index would be a bullish development.

​​This view would be negated with a daily close below 7100.

CAC40 Daily Price Chart – June 7, 2023